and Mutual Fund Behavior
Inauguraldissertation zur
Erlangung des Doktorgrades der
Wirtschafts- und Sozialwissenschaftlichen Fakult¨ at der
Universit¨ at zu K¨ oln
2015
vorgelegt von
Dipl.-Kfm. Christoph Sorhage aus
Mannheim
Vorsitz: Univ.-Prof. Dr. Thomas Hartmann-Wendels, Universit¨ at zu K¨ oln
Tag der Promotion: 21. Januar 2016
Cici, Gjergji, Alexander Kempf, and Christoph Sorhage (2015): Do Financial Advisors Provide Tangible Benefits for Investors? Evidence from Tax-Motivated Mutual Fund Flows,
Working Paper.
Sorhage, Christoph (2015): Outsourcing of Mutual Funds’ Non-core Competencies, Working Paper.
Dahm, Laura K., and Christoph Sorhage (2015): Milk or Wine: Mutual Funds’
(Dis)economies of Life, Working Paper.
I wrote this thesis during my time as a research assistant at the Department of Finance at the University of Cologne. The completion of this thesis would not have been possible without the help of many, whom I would like to thank.
First of all, I would like to thank my advisor Prof. Dr. Alexander Kempf for his support and relentless guidance. His critical advice has helped me to continuously improve academically and permanently influenced my way of thinking beyond this thesis. My thanks also go to Prof.
Dr. Dieter Hess for serving as co-referee and Prof. Dr. Thomas Hartmann-Wendels for chairing the dissertation committee.
Moreover, I am indebted to my co-author Prof. Dr. Gjergji Cici, who accompanied me since my first steps in research. I am particularly grateful for our countless fruitful discussions and his positive mindset that continuously stimulated me to push my research forward.
Many thanks go to my current and former colleagues at the Department of Finance. In par- ticular, I would like to mention Sebastian Bethke, Prof. Dr. Monika Gehde-Trapp, Marc-Andr´ e G¨ oricke, Stefan Jaspersen, and Florian Sonnenburg for their advice and valuable comments as well as Dr. Alexander P¨ utz for his mentoring support throughout the years. I would also like to thank Edith Diekmann for her assistance in coping with the administrative challenges that accompany all academic work.
Furthermore, I wish to thank my parents and my sister, who always believed in me and supported me in all my pursuits.
Most of all, I would like to express my gratitude to Laura Dahm. Aside from our joint research that has been productive, pleasurable and that contributed greatly to this thesis, I am deeply grateful for meeting Laura which turned out to be the most fortunate event in my life.
As such, I cannot overestimate her tremendous support and encouragement that accompanied me during this thesis.
Cologne, February 2016 Christoph Sorhage
List of Tables vii
List of Figures ix
1 Introduction 1
2 Do Financial Advisors Provide Tangible Benefits for Investors? Evidence
from Tax-Motivated Mutual Fund Flows 7
2.1 Introduction . . . . 7
2.2 Data . . . . 10
2.2.1 Data sources and sample construction . . . . 10
2.2.2 Sample characteristics . . . . 12
2.3 Main results . . . . 13
2.4 Alternative explanations . . . . 17
2.4.1 Do unobservable fund characteristics drive the results? . . . . 17
2.4.2 Are retirement flows responsible? . . . . 18
2.4.3 Does our flow change measure really capture tax-avoidance behavior? . . 20
2.5 Do advisors help more in critical situations? . . . . 22
2.5.1 Tax-avoidance and size of tax liabilities . . . . 22
2.5.2 Tax-avoidance and hard-to-predict distributions . . . . 23
2.6 Do advisors also help with tax-loss-selling? . . . . 25
2.7 Robustness . . . . 28
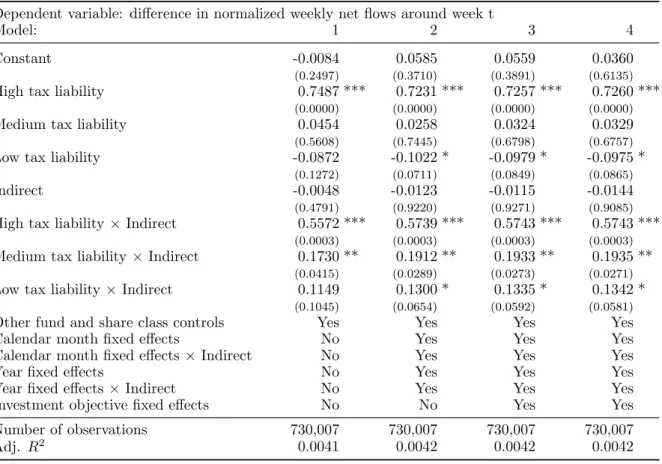
2.7.1 Alternative ways of measuring tax liabilities . . . . 28
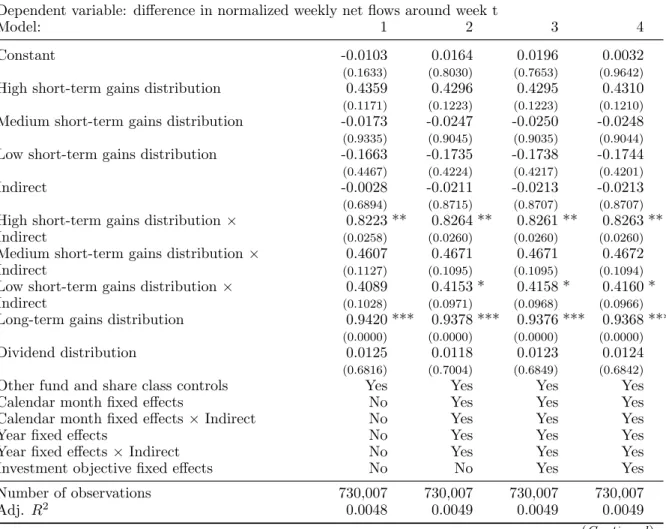
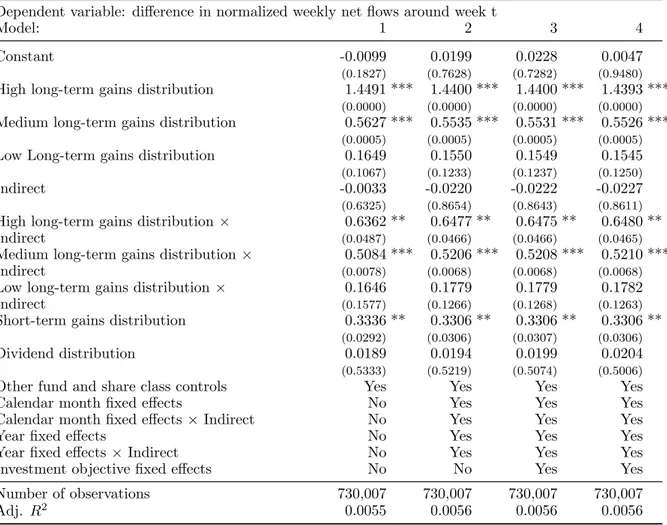
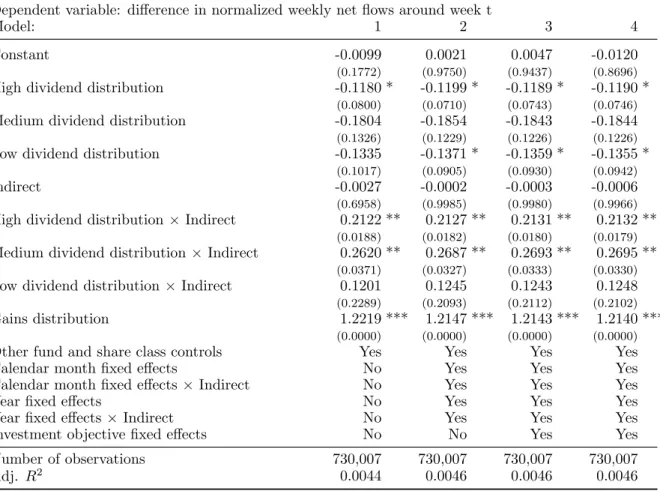
2.7.2 Capital gains versus dividends . . . . 30
2.8 Summary and conclusion . . . . 33
3 Outsourcing of Mutual Funds’ Non-core Competencies 35 3.1 Introduction . . . . 35
3.2 Data . . . . 39
3.2.1 Sources and sample construction . . . . 39
3.2.2 Sample characteristics . . . . 41
3.3 Main result . . . . 42
3.3.1 Service outsourcing and fund performance . . . . 42
3.3.2 Service outsourcing and alternative measures for funds’ portfolio manage-
ment focus . . . . 44
3.4 Endogeneity concerns . . . . 46
3.4.1 Panel regression with family fixed effects . . . . 46
3.4.2 Matched sample analysis . . . . 48
3.4.3 Permutation test . . . . 49
3.4.4 Instrumental variable regression . . . . 51
3.5 Potential channels for the performance effect of service outsourcing . . . . 53
3.6 Service outsourcing and fund flows . . . . 56
3.7 Conclusion . . . . 59
4 Milk or Wine: Mutual Funds’ (Dis)economies of Life 60 4.1 Introduction . . . . 60
4.2 Theoretical foundation of the age-performance relation . . . . 64
4.2.1 Liability of newness theory . . . . 64
4.2.2 Liability of aging theory . . . . 65
4.3 Data . . . . 66
4.3.1 Sample selection . . . . 66
4.3.2 Summary statistics . . . . 66
4.4 Impact of fund age on performance . . . . 68
4.4.1 Main result: Liability of newness versus liability of aging . . . . 68
4.4.2 Robustness . . . . 72
4.4.2.1 Incubation bias . . . . 72
4.4.2.2 Influences of the fund family . . . . 73
4.4.2.3 Influences of the fund manager . . . . 75
4.5 Do we capture innovation induced performance effects? . . . . 78
4.5.1 Age-performance relation among index and actively managed funds . . . 78
4.5.2 Age-performance relation and competition . . . . 81
4.6 Fund age and innovative investment behavior . . . . 83
4.6.1 Impact of fund age on trading behavior . . . . 83
4.6.2 Fund age and hard-to-value stocks . . . . 86
4.7 Demand for mature funds and their potential benefits . . . . 89
4.7.1 Diversity in investor characteristics . . . . 89
4.7.2 Style and performance extremity . . . . 93
4.8 Conclusion . . . . 96
Bibliography 98
2.1 Share class characteristics by distribution channel . . . . 12
2.2 Impact of financial advice on tax-avoidance behavior . . . . 15
2.3 Funds with indirect- and direct-sold shares . . . . 18
2.4 Impact of financial advice on tax-avoidance behavior for non-DC fund shares . . 19
2.5 Tax-exempt versus taxable distributions . . . . 21
2.6 Size of tax liability and tax-avoidance behavior . . . . 23
2.7 Volatility of funds’ tax liabilities and tax-avoidance behavior . . . . 25
2.8 Interaction of tax-deferral with tax-loss selling . . . . 27
2.9 Size of tax liability and tax-avoidance behavior for alternative tax rates . . . . . 29
2.10 Size of tax liability and tax-avoidance behavior for gains and dividend distributions 31 3.1 Sample characteristics by service outsourcing status . . . . 41
3.2 Service outsourcing and fund performance . . . . 43
3.3 Service outsourcing and alternative measures for a portfolio management focus . 45 3.4 Service outsourcing and fund performance with family fixed effects . . . . 47
3.5 Matched sample analysis . . . . 48
3.6 Permutation test for the impact of funds’ shareholder service outsourcing status on performance . . . . 49
3.7 First stage of 2SRI – The impact of the number of service providing companies located in the state of the fund’s management company on outsourcing . . . . 52
3.8 Second stage of 2SRI – The impact of service outsourcing on fund performance . 53 3.9 Mechanisms for the performance impact of service outsourcing . . . . 55
3.10 Service outsourcing and fund flows . . . . 58
4.1 Summary statistics . . . . 67
4.2 Impact of fund age on performance . . . . 71
4.3 Impact of fund age on performance with incubation control . . . . 73
4.4 Impact of fund age on performance with family controls . . . . 74
4.5 Impact of fund age on performance with manager controls . . . . 76
4.6 Impact of fund age on performance among index funds and actively managed funds 79 4.7 Impact of fund age on performance stratified by competitive environment . . . . 82
4.8 Impact of fund age on turnover . . . . 84
4.9 Impact of fund age on active management . . . . 86
4.10 Impact of fund age on funds’ holdings in hard-to-value stocks . . . . 88
4.11 Fund age and the performance sensitivity of investors . . . . 91
4.12 Fund age and the demand through institutional investors . . . . 93
4.13 Impact of fund age on style extremity and performance extremity . . . . 95
4.1 Age-performance relation . . . . 69
Introduction
This thesis consists of three essays on the interaction of investor clienteles and mutual fund behavior. In particular, I focus on how the interrelation of investor preferences and the behavior of mutual funds determine the allocation of investor wealth to actively managed funds.
Over the last three decades the mutual fund industry has been characterized by a substantial increase in market activity. As such, only the market for U.S. mutual funds became a business with more than $15 trillion assets under management, while the number of funds took off from a couple of hundreds to almost 8,000.
1Considering the relevance of this investment type and the increase in the number of market participants, economists explore the interaction of investor clienteles and mutual fund behavior. The academic literature addresses the matching of funds and investors from two different ankles: First, researchers analyze to what extend heterogeneity among investors determines the selection of fund investments.
2Second, another strand of the literature investigates heterogeneity among mutual funds based on their families’ decisions to compete for the different groups of investors.
3The first essay (Cici, Kempf, and Sorhage, 2015) adds to the literature on fund investor clien- teles by addressing the question for potential benefits accruing to investors who rely on financial advisors when acquiring shares in a fund. Several academic studies show that less sophisticated investors who seek services aside from portfolio management invest through financial advisors,
1See Investment Company Institute (2015).
2Some examples for clientele effects among mutual funds are investor sophistication (see, e.g., Malloy and Zhu, 2004, Del Guercio and Reuter, 2014, Evans and Fahlenbrach, 2012), taxation (see Sialm and Starks, 2012), retirement saving (see Sialm, Starks, and Zhang, 2015), risk-taking (see Kamstra et al., 2015), or financial advice (see, e.g., Bhattacharya et al., 2012, Christoffersen, Evans, and Musto, 2013).
3Some examples for such behavior of fund families are the active exploitation of investor heterogeneity through product differentiation (see, e.g., Massa, 2003, Khorana and Servaes, 2012), fee structures (see, e.g., Chordia, 1996, Nanda, Narayanan, and Warther, 2000, Nanda, Wang, and Zheng, 2009), star-fund creating strategies (see, e.g., Nanda, Wang, and Zheng, 2004, Gaspar, Massa, and Matos, 2006), or varying emphasis on portfolio management (see, e.g., Del Guercio, Reuter, and Tkac, 2010, Del Guercio and Reuter, 2014).
while more sophisticated, performance-sensitive investors invest in funds directly without any intermediary.
4However, although the benefits of direct-sold funds in the form of superior per- formance outcomes have been studied extensively, empirical evidence for the benefits delivered to investors of the indirect channel of funds is lacking.
5We provide first evidence that investors under the guidance of financial advisors receive tangible benefits in the form of valuable tax ad- vice. We focus on tax-management as the channel for advisory services because of the following reasons: First, tax advice is one of the most widely hypothesized dimensions for value gener- ation through financial advice in the literature.
6Second, both financial advisors and private investors emphasize the role of tax planning services as a central motive for the development and maintenance of the advisor-client relationship.
7Hence, we explore whether investors of the indirect channel exhibit more tax savvy investment behavior. In particular, we hypothesize that financial advisors assist in reducing their clients’ tax liabilities by helping them to avoid taxable fund distributions.
8Consistent with this Tax-Advisory Hypothesis, our main results confirm a relation between financial advice and investors’ reactions to taxable fund distributions. In particular, advised investors exhibit tax-avoidance behavior that is significantly stronger than the reaction of direct channel investors who do not rely on financial advisors. Moreover, fund distributions which lead to larger tax liabilities and are harder to predict trigger stronger tax-avoidance reactions among investors in the indirect channel. Our results also suggest that financial advice encompasses multiple facets of tax-management since advised investors do not only avoid taxable distribu- tions but simultaneously engage in tax-loss selling to reduce their tax-liabilities. We rule out several alternative explanations: We show that differences in unobservable fund characteristics such as distinct patterns in funds’ distributions are not responsible for our findings. In addition, we document that the tax-avoidance differential is unaffected when we control for differences in the fraction of funds’ investments through tax-exempt retirement accounts. Finally, we find that the superior tax-avoidance behavior of advised investors is limited to distributions that are taxable and is non-existent for tax-exempt distributions.
4See, e.g., Malloy and Zhu (2004), Investment Company Institute (2008), and Chalmers and Reuter (2015).
5See, e.g., Bergstresser, Chalmers, and Tufano (2009), and Del Guercio and Reuter (2014).
6See, e.g., Bergstresser, Chalmers, and Tufano (2009), and Bhattacharya et al. (2012).
7See, e.g., Investment Company Institute (2007), and Financial Advisor Magazine (2008).
8In accordance to the regulations of the Internal Revenue Code of 1986 (IRC) mutual funds are legally obliged to distribute dividends and capital gains to their shareholders which then are taxable at the individual investor account (see Title 26 Subchapter M of IRC). Thus, fund distributions provide investors with an incentive to delay investments into a distributing fund until after the distribution to avoid the associated tax consequences.
For a detailed discussion on how fund distributions accelerate investors’ tax liabilities see Johnson and Poterba (2010).
Taken together, the findings from the first essay suggest that the investment decisions of fund investors are affected by their demand for financial advice. Specifically, we show that investors from the indirect channel of mutual funds benefit from financial advisors by receiving valuable tax-management advice. Moreover, our results provide direct support for the view that funds are separated into a service-oriented and performance-oriented market segment.
9However, this classification of funds based on their targeted group of investors provides only indirect evidence since the determinants of investors’ fund selections are more diverse than the reliance on financial advice. Thus, it is still possible that other motives such as risk taking preferences are responsible for the fund-investor interaction. Hence, a more direct classification for funds’
varying performance- or service-orientations should be observable by studying management decisions at the family level.
Adhering to this idea, in the second essay (Sorhage, 2015) I investigate the relation between mutual fund behavior and fund families’ decisions to source fund activities unrelated to portfolio management internally or from external providers. Consistent with the literature on industrial organization, I propose that funds whose families outsource non-portfolio management services are the same funds with an emphasis on their core business portfolio management.
10Specifically, I classify mutual funds’ focus on portfolio management based on the outsourc- ing status of their shareholder services. Shareholder services involve a substantial number of tasks that by nature embody an immediate link to funds’ shareholders but that do not add to funds’ investment abilities. Thus, shareholder services are a suitable candidate for out- sourcing to performance-oriented funds, while service-oriented funds are cautious to maintain this link.
11Moreover, according to estimates by Gremillion (2005), shareholder services are the second most expensive component of mutual fund activities which makes it attractive to performance-oriented funds to reduce resource consumption in a non-core area by relying on external specialists’ comparative advantage.
To provide evidence on a relation between fund behavior and the outsourcing status of shareholder services, I employ a new dataset with information on funds’ service operations
9According to Del Guercio, Reuter, and Tkac (2010) and Del Guercio and Reuter (2014) direct-sold funds put an emphasis on portfolio management, for instance, by employing more skilled managers from prestigious universities, while indirect-sold funds are presumed to cater to investors who value services aside from portfolio management.
10Some examples for an impact of outsourcing on the performance of an organization’s core responsibility are Prahalad and Hamel (1990), Gilley and Rasheed (2000), Goffredson, Puryear, and Philips (2005), Lafontaine and Slade (2007), Novak and Stern (2008), Bustinza, Arias-Aranda, and Gutierrez-Gutierrez (2010), Lee and Kim (2010).
11For a comprehensive overview on the services rendered by funds’ shareholder services as well as to what extend they are a suitable candidate for outsourcing see Gremillion (2005).
reported by mutual funds in their N-SAR reports filed with the SEC. I determine the outsourcing status of a mutual fund’s shareholder service by manually checking whether the service provider in N-SAR is affiliated with the fund’s family reported in the CRSP mutual fund database. I document that about 57 percent of all funds source their shareholder services externally, which emphasizes the importance of service outsourcing among mutual funds. In addition, consistent with the notion that service outsourcing represents a management decision at the family level, I find that fund families source shareholder services for all of their member funds either externally or internally.
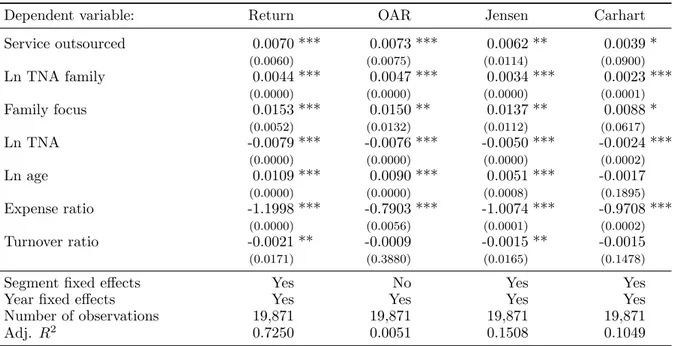
My main results confirm a relation between the outsourcing status of funds’ shareholder services and performance. In particular, service-outsourced funds deliver significantly better performance results than service-inhouse funds. I rule out several alternative explanations: I show that the performance differential is unaffected when I control for other proxies of a portfo- lio management focus of funds such as the distribution channel of funds and the use of portfolio subadvisors. In addition, I employ a set of empirical techniques to address endogeneity con- cerns and show that omitted variables are not responsible for my findings. In an additional analysis, consistent with the performance results, I document that service-outsourced funds are indeed associated with higher values for measures of successful active management. I show that service-outsourced funds create more value through superior idiosyncratic bets, unobserved ac- tions and profitable information on specific industries. Furthermore, I find that the stronger portfolio management focus of service-outsourced funds is rewarded by investors in the form of higher growth rates. Taken together, my results suggest that funds whose families outsource non-portfolio management activities are more concerned with their core business portfolio man- agement.
The first two essays showed that the interaction between investor clienteles and mutual fund behavior is determined by investors’ varying performance- and service-needs and mutual funds’ dedication to attract the specific investor groups. However, considering this interactive character the question about time-variations within the fund-investor matching arises as a result of dynamics in mutual funds’ behavior.
1212Some examples for time-dependent behavior of mutual funds are their trading activity (see, e.g., P¨utz and Ruenzi, 2011, P´astor, Stambaugh, and Taylor, 2015a), the use of picking and timing skills in different market periods (see Kacperczyk, Nieuwerburgh, and Veldkamp, 2014), risk-shifting (see, e.g., Brown, Harlow, and Starks, 1996, Kempf and Ruenzi, 2008, Kempf, Ruenzi, and Thiele, 2009, Huang, Sialm, and Zhang, 2011), window dressing (see, e.g., Agarwal, Gay, and Ling, 2014), or events such as manager turnover (see, e.g., Khorana, 1996, 2001) and fund mergers (see, e.g., Jayaraman, Khorana, and Nelling, 2002, Khorana, Tufano, and Wedge, 2007).
The third essay (Dahm and Sorhage, 2015) adds to the literature on time-varying fund be- havior and is related to the previous two essays by examining whether funds’ investment skills change to the positive or negative over time and how this is interrelated to investor groups. In particular, we investigate two competing theories from the literature on organizational ecology which postulate that funds’ investment abilities improve or deteriorate with the passing time.
First, the liability of newness theory suggests that funds’ are subject to learning effects which al- low them to improve their investment strategies and thus facilitate fund performance.
13Second, the liability of aging theory suggests that funds experience a decline in innovative investment ideas because of a preference for proven courses of action.
14Consistent with the liability of aging theory, we find that the performance of a fund de- teriorates over its lifetime. We show robustness for the negative age-performance relation by controlling for unobservable effects that could impact on the performance effect at the fund, family, manager and investment segment level. Furthermore, we explore the idea of the liability of aging theory that funds’ diseconomies of life are attributable to less innovative investment strategies from two different ankles: First, we investigate funds’ age-performance relationship in different environments that present varying potentials for mutual funds to exploit innova- tive investment ideas. Second, we analyze funds’ actual investment behavior for a relation to innovative investments. Referring to the first set of tests, we document no impact of age on the performance of passively managed index funds whose investment activity is predefined and as such has no scope for creative investments. Relatedly, we cannot confirm a negative age- performance relation among actively managed funds with an investment focus on large, well- established companies and consistent generations of income. Moreover, we find that a decline in funds’ investment success is limited to periods with reduced competitive pressure on funds.
15With regard to the second set of tests we show that funds’ investment behavior changes over their lifetime: We document that mature funds trade significantly less than their younger selves which is consistent with a diminished pursuit of new investment ideas. Moreover, older funds are associated with a less active management and fewer investments in hard-to-value stocks.
However, providing support for a dynamic interaction between mutual fund behavior and fund investor clienteles, we find that mature funds are populated by less performance-sensitive and non-institutional investors relative to their earlier stages of life and that these investors poten-
13Some examples for a relation between an organization’s age and learning are, e.g., Stinchcombe (1965), Hannan and Freeman (1984), and March (1991).
14Some examples for a relation between aging of organizations and innovation are, e.g., Cohen and Levinthal (1990), Singh and Lumsden (1990), and Barron, West, and Hannan (1994).
15Cohen (2010) provides an overview in how far competition facilitates innovation.
tially benefit from less extreme investment styles and performance outcomes. Taken together, our results show that mutual funds’ investment abilities are not constant but deteriorate over time.
Overall, the results of the three essays suggest that heterogeneity in both investor clienteles
and mutual fund behavior determine the fund-investor matching. For example, some investors
invest into mutual funds through financial advisors because they benefit from valuable tax-
management advice or mutual funds exhibit variations in their focus on portfolio management
based on their families’ decision to attract specific groups of investors. However, time-variant
mutual fund behavior can introduce dynamics into the fund-investor matching. Accordingly,
funds experience a decline in their investment abilities over their lifetime and simultaneously
cater to the investment preferences of different investor groups during their earlier and advanced
stages of life.
Do Financial Advisors Provide Tangible Benefits for Investors?
Evidence from Tax-Motivated Mutual Fund Flows ∗
2.1 Introduction
About one half of all mutual fund investors seek financial advice and are willing to pay for it (Investment Company Institute, 2014). Possible ways in which financial advisors can help their clients have been discussed in previous research. For example, Bergstresser, Chalmers, and Tufano (2009) suggest that investors might receive tangible and intangible benefits in the form of portfolio customization that reflects individual asset allocation needs, reduced search costs, lower susceptibility to behavioral biases, and tax management advice, among others.
However, despite the list of hypothesized benefits from financial advice, there has been no empirical evidence to date documenting such benefits for U.S. investors.
16We fill this gap in the literature by documenting that U.S. mutual fund investors do indeed receive at least one of the many previously hypothesized benefits, which comes in the form of valuable tax-management advice.
∗This chapter is based on Cici, Kempf, and Sorhage (2015).
16There are very few empirical studies that document benefits related to financial advice outside of the U.S. Using data from Israel and Germany, respectively, Shapira and Venezia (2001) and Hackethal, Haliassos, and Jappelli (2012) provide evidence that investors improve their portfolio performance by following financial advice.
Specifically, we examine whether financial advisors help U.S. mutual fund investors reduce their tax liabilities by actively helping them avoid taxable fund distributions. To address this question, we compare the tax-avoidance behavior of investors who operate under the guidance of financial advisors (hereafter, indirect investors) with that of investors who do not rely on financial advisors (hereafter, direct investors).
Using a broad sample of U.S. mutual funds over the period 1999–2011, we document tax- avoidance among both groups of investors. However, this behavior is much stronger for indirect investors than for direct investors as the tax-avoidance pattern in the indirect channel is about 60 percent stronger than in the direct channel. Our results hold even after we control for the advisors’ compensation, changes in fund performance, and several other factors that can affect flows. Since previous research focusing on U.S. investors shows that investors who seek advice are generally less sophisticated than those who do not (see, e.g., Malloy and Zhu, 2004, Investment Company Institute, 2008, Chalmers and Reuter, 2015),
17we can attribute the stronger tax- avoidance pattern of indirect investors to the assistance provided by financial advisors.
18We consider several alternative explanations for our findings. First, we rule out the possibil- ity that unobservable fund characteristics are responsible for our results by showing that our key finding persists even after we compare the behavior of direct and indirect investors within the same fund. Second, retirement investors, who have no incentive to avoid taxable distributions, perhaps make up a higher fraction of investors in the direct channel than in the indirect channel, which could lead to the flow patterns we observe. We rule this out by showing that the stronger tax-avoidance behavior of indirect investors persists even after we exclude share classes that are available to retirement investors. Finally, we rule out that investor trading patterns other than tax-avoidance lead to the flow patterns we observe by looking at flow patterns around tax-exempt and taxable distributions. We find flow evidence consistent with tax-avoidance only around taxable distributions but not around tax-exempt distributions. Furthermore, we find
17This view was first presented by Gruber (1996) in his AFA presidential address and has been corroborated by both empirical and theoretical studies. Malloy and Zhu (2004) show that investors from less affluent and less educated neighborhoods are more likely to invest through brokers. Chalmers and Reuter (2015) document younger individuals with less education and lower income to be more likely to choose financial advice for retirement decisions. Survey evidence also suggests that investors who seek financial advice are from households with lower income and financial assets (see Investment Company Institute, 2008). This empirical evidence is also supported by theoretical models of Inderst and Ottaviani (2009) and Stoughton, Wu, and Zechner (2011) which imply that advisors service mainly less sophisticated investors.
18In Europe unsophisticated investors who most need professional financial advice appear less interested in it (Bhattacharya et al., 2012), most likely because they seem to rely more on family and friends as their main source of financial advice and are less likely to invest in the stock market (see, e.g., Rooij, Lusardi, and Alessie, 2011, Calcagno and Monticone, 2015). The reason for the lower participation of unsophisticated investors in the stock market is likely related to the fact that in Europe, unlike in the U.S., retirement investing is mainly done by the government.
that these patterns are affected by the distribution channel only among the taxable distribu- tions. These two findings suggest that the flow patterns around taxable distributions are more likely to be driven by tax-avoidance considerations and that the advisors’ influence on investors in this particular setting is more likely related to helping investors with tax-avoidance.
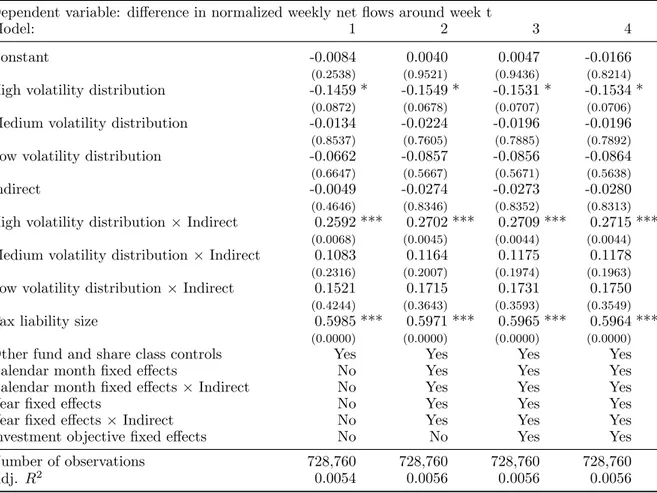
Extending our investigation, we argue that if financial advisors do indeed provide tax- management services to their clients, then their advice ought to lead to stronger tax-avoidance behavior in critical situations that affect investors in the most adverse ways. One such critical situation arises in the face of distributions that can cause large tax liabilities. Another one is when investors are facing distributions associated with tax liabilities that are hard to predict and consequently make financial planning more challenging. Our results support this view. We show that the difference in tax-avoidance behavior between direct and indirect investors is more pronounced for distributions that lead to larger tax liabilities and for distributions that are harder to predict.
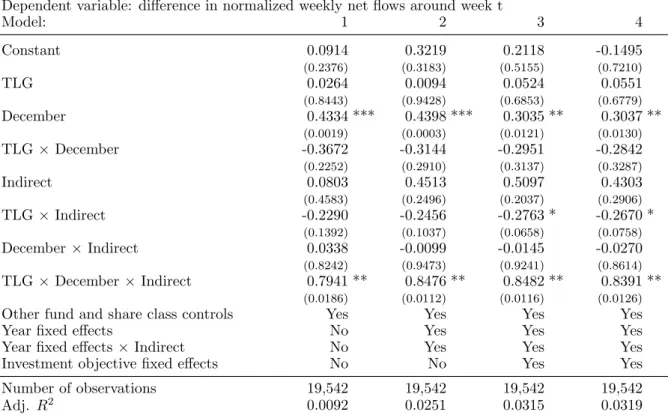
We next explore whether the tax-avoidance advice from financial advisors interacts with other tax-related considerations. Ivkovi´ c and Weisbenner (2009) show that, consistent with tax-loss selling, investors’ propensity to sell fund shares that have declined in value is more pronounced in December. We hypothesize that tax-loss selling interacts with the tax-avoidance behavior that we document and that this effect is more pronounced in the indirect channel.
Our results show that the tax-avoidance difference between direct and indirect investors gets stronger in December but only for funds where investors are most likely to be subject to capital losses. This finding is consistent with indirect channel investors being advised to not only delay additional investments until after the distribution date but to also redeem shares that have declined in value prior to the distribution date to harvest losses for tax-loss selling purposes.
Our paper is related to a growing number of studies that examine whether financial advice
generates measurable benefits for U.S. investors. Bergstresser, Chalmers, and Tufano (2009),
Del Guercio and Reuter (2014) and Chalmers and Reuter (2015) show that financial advisors
are unable to help investors pick outperforming funds. Mullainathan, Noeth, and Schoar (2012)
document that financial advisors fail to moderate their clients’ behavioral biases. We contribute
to this literature with findings suggesting that financial advisors are providing useful tax man-
agement advice to fund investors. To the best of our knowledge, ours is the first study to provide
evidence of a tangible benefit delivered by financial advisors to their clients in the U.S. As such,
our evidence provides concrete support for the view espoused by Del Guercio, Reuter, and Tkac
(2010) and Del Guercio and Reuter (2014) that indirect channel investors demand and receive financial advisory services rather than purely portfolio management services.
Our study is also related to a second group of studies that examine how tax considerations shape decisions of individual fund investors (see, e.g., Barclay, Pearson, and Weisbach, 1998, Bergstresser and Poterba, 2002, Ivkovi´ c and Weisbenner, 2009, Johnson and Poterba, 2010). We contribute to this literature by documenting that mutual fund investors are not homogeneous when responding to taxes. Instead, investors’ reaction to taxes is related to the distribution channel through which they transact, whereby indirect channel investors display stronger tax awareness shaped in large part by financial advice.
The remainder of this paper is organized as follows. In Section 2.2, we discuss our data set and sample summary statistics. Section 2.3 presents our main findings on mutual fund investors’
avoidance of taxable distribution across the direct and indirect distribution channels. In Section 2.4, we explore alternative explanations for our key finding. Section 2.5 investigates whether financial advice leads to stronger tax-avoidance behavior in situations that affect investors in the most adverse ways, and Section 2.6 examines whether the tax-avoidance effect interacts with tax-loss selling. In Section 2.7 we provide several robustness checks, and Section 2.8 concludes.
2.2 Data
2.2.1 Data sources and sample construction
We obtain mutual fund data from four databases: Thomson Reuters Lipper Flows, Thomson Reuters Mutual Fund Holdings, Center for Research in Security Prices (CRSP) Stock Files, and CRSP Survivor-Bias-Free U.S. Mutual Fund database.
Data on the primary distribution channels of U.S. equity fund shares as well as weekly data on net flows and assets under management are from Thomson Reuters Lipper Flows (Lipper).
Lipper assigns each fund share class to one of its three distribution channel categories.
19Share classes sold primarily through brokers and financial advisors are placed in the indirect channel
19Previous studies such as Bergstresser, Chalmers, and Tufano (2009), Del Guercio, Reuter, and Tkac (2010) and Del Guercio and Reuter (2014) rely on the distribution channel classifications from Financial Research Corporation (FRC). However, since FRC’s classification is based on Lipper’s, differences between the two classification schemes are very small as documented by Bergstresser, Chalmers, and Tufano (2009).
category while share classes sold directly to investors are placed in the direct channel category.
20The remaining distribution channel comprises share classes sold primarily to institutional in- vestors. Holdings data for U.S. equity funds are from Thomson Reuters Mutual Fund Holdings database. The database reports the name, identifier, and number of shares for each security held by each mutual fund on each reporting date. Holdings data are supplemented with individual stock prices and other information from the CRSP Monthly and Daily Stock Files.
We obtain information on share class and fund characteristics, such as returns, expense ratios, portfolio turnover, and investment objectives from the CRSP Mutual Fund database.
We estimate weekly returns for each share class by compounding daily returns. For the share classes we also obtain information on distribution dates, distribution amounts, and net asset value reinvestment prices (NAV) from CRSP. Similar to P´ astor and Stambaugh (2002) we assign a fund’s investment objective classification based on the CRSP fund objective code.
We analyze flows at the share class level rather than at the fund level for two reasons.
First, most share classes are distributed primarily only through one distribution channel, and accordingly, the Lipper classification of primary distribution channels is done at the share class level. Second, mutual funds allocate received dividends and realized capital gains on a pro- rata basis when making distributions and these distributions are paid net of expenses, causing distributions to differ across share classes.
To arrive at our final sample, we start by excluding all share classes with missing MFLINKS code. We next proceed by excluding shares sold through the institutional channel to examine the investment behavior of retail investors. This makes our study comparable to previous papers such as Bergstresser, Chalmers, and Tufano (2009) and Del Guercio and Reuter (2014).
Since our focus is on taxable and actively managed U.S. domestic equity funds, we take additional steps to exclude index, international, sector, balanced, fixed-income, and tax-exempt funds. Next, we exclude all retirement share classes (R share classes) that are designed for retirement plans. We further require that each fund share has at least 52 weeks of flow and return data. Our final sample consists of 730,007 share class-week observations. It covers 2,425 U.S. domestic equity fund shares over the period September 1999 to June 2011.
20Like previous studies listed above, we lack the data to distinguish between brokers and financial advisors. Thus, we will treat them as one group and for ease of exposition refer to them as financial advisors. Furthermore, given the recent growth in the activity of fee-based financial advisors who sell no-load funds but charge a fee as a percentage of the client’s assets they manage, we expect there to be some funds classified as direct channel funds, part of which are sold by fee-based financial advisors. However, this effect would work against us finding a difference in the behavior of direct and indirect channels.
2.2.2 Sample characteristics
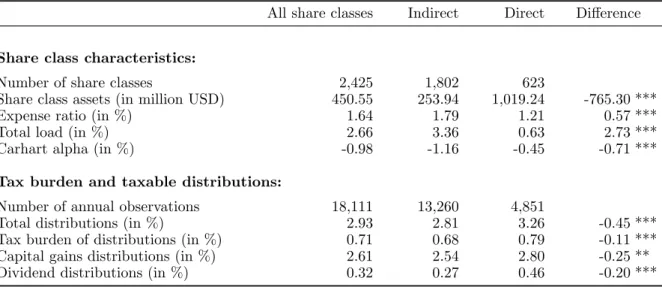
Table 2.1 presents summary statistics. About 75 percent of the share classes in our sample are sold through the indirect channel, which is consistent with Bergstresser, Chalmers, and Tufano (2009). In terms of assets, however, indirect-sold shares are significantly smaller than the direct- sold ones. Hence, although they are more numerous, indirect share classes control a smaller amount of total assets. This is consistent with Del Guercio and Reuter (2014). Consistent with previous studies (see, e.g., Bergstresser, Chalmers, and Tufano, 2009, Del Guercio and Reuter, 2014), indirect channel share classes have significantly higher expense ratios, which translate into a lower (net-of-fee) performance of indirect share classes. In addition, indirect share classes have higher load fees, consistent with the fact that a sizable part of advisors’ compensation comes out of loads.
21Table 2.1: Share class characteristics by distribution channel
All share classes Indirect Direct Difference
Share class characteristics:
Number of share classes 2,425 1,802 623
Share class assets (in million USD) 450.55 253.94 1,019.24 -765.30 ***
Expense ratio (in %) 1.64 1.79 1.21 0.57 ***
Total load (in %) 2.66 3.36 0.63 2.73 ***
Carhart alpha (in %) -0.98 -1.16 -0.45 -0.71 ***
Tax burden and taxable distributions:
Number of annual observations 18,111 13,260 4,851
Total distributions (in %) 2.93 2.81 3.26 -0.45 ***
Tax burden of distributions (in %) 0.71 0.68 0.79 -0.11 ***
Capital gains distributions (in %) 2.61 2.54 2.80 -0.25 **
Dividend distributions (in %) 0.32 0.27 0.46 -0.20 ***
Notes: This table reports share class characteristics and information on taxable distributions for our sample of U.S. equity fund shares between 1999 and 2011. Share classes are categorized by their primary channel of distribution. We classify a share class as belonging to the Indirect (Direct) distribution channel based on classification provided by Lipper. Share class assets, represents the share class’ total net assets under management in million USD; Expense ratio, is the share class’ fees charged for total services. Total Load, is the combined front-end and back-end load of the share class, and Carhart alpha, is the share class’ annualized risk-adjusted return from the Carhart (1997) 4-factor model. Alpha estimates are obtained from 12-month window regressions of funds’ net-of-fee excess returns on the excess market return, HML (value) factor, SMB (size) factor, augmented by the MOM (momentum) factor. Total distributions are measured as the distribution amount per share normalized by the share’s net asset value (NAV). Tax burden of distributions are calculated by multiplying distributions’ yields with the average marginal tax rate of investors as in Sialm (2009) and Sialm and Starks (2012). Capital gains distributions and Dividend distributions are measured, respectively, as the capital gains and dividend distribution amount per share normalized by the share’s NAV at the distribution date. Expense ratio, Total load, Carhart alpha and the information on share class’ tax burdens and distribution yields are reported in percentage points. ***, **,
* denote statistical significance at the 1%, 5%, and 10% significance level, respectively.
Table 2.1 also reports statistics on fund shares’ annual distribution yields. There are a total of 18,111 share class-year observations with at least one taxable distribution. Such observations
21Our load variable is measured as the sum of front-end and back-end load fees.
are more likely in the indirect channel than in the direct channel, which is expected given the larger number of share classes in the indirect channel. Most important, share classes in the indirect channel have significantly smaller distribution yields than those in the direct channel.
This difference amounts to roughly 0.45 percentage points and is almost equally driven by funds’
capital gains and dividend distributions.
To get a sense for the tax implications of the documented difference in distribution yields, we multiply the difference in distribution yields (0.45 percentage points) with the average marginal tax rate of investors as in Sialm (2009) and Sialm and Starks (2012). This calculation suggests that the difference in distribution yields translates into tax savings for indirect investors relative to direct investors of 11 bp.
222.3 Main results
This section explores our Tax-Advisory Hypothesis, which postulates that flows of indirect in- vestors exhibit stronger tax-avoidance patterns than flows of direct investors. Our measurement of the tax-avoidance flow effect is based on a two-step procedure. First, for each share class i around each taxable distribution event, we compute the flow change from the week before to the week after the distribution week t as follows,
∆F
i,t= F
i,t+1− F
i,t−1, (2.1)
where F is the net flow of fund share class i in week t normalized by its total net assets under management lagged by one week. Looking at fund shares’ flow changes is attractive because it directly captures investors’ net reaction around distribution weeks and minimizes the influence of share class and fund level characteristics on flows. Second, we compare flow changes around distribution weeks with flow changes around non-distribution weeks. To avoid flow changes of non-distribution weeks being affected by surrounding distribution events, we eliminate all non-distribution weeks that are preceded or followed by a distribution in the two weeks before or after. The intuition behind our approach for measuring tax-avoidance behavior is that if investors are delaying their investments in a particular share class in the week prior to the distribution week to avoid that distribution, then flows in the week before should be lower
22This is based on the assumption that indirect investors pay the marginal tax rate of investors. However, indirect investors might have lower tax rates if their income is lower, which would potentially lead to a lower tax burden difference.
than in the week after, resulting in a higher flow change around distribution weeks compared to non-distribution weeks, all else equal.
23To test the Tax-Advisory Hypothesis, we employ several regression specifications in which the dependent variable, ∆F, is the flow change of fund share i in week t.
24Our base model specification is as follows:
∆F
i,t=α
0+ α
1Distribution
i,t+ β
0Indirect
i+ β
1Distribution
i,t× Indirect
i+ δDelta Return
i,t+ γAdvisor Compensation
i,t+
i,t,
(2.2) Our main independent variables are, Distribution, a binary variable that equals one if share class i is subject to a taxable distribution in week t and zero otherwise as well as, Indirect, a binary variable that equals one if share class i is sold indirectly and zero otherwise. Our key test for the Tax-Advisory Hypothesis is based on the interaction of these two variables, which measures how the effect of distributions on the flow change variable differs between indirect and direct channels. Thus, we employ a difference in differences approach.
To control for flows reacting to past performance, which is an empirical regularity first documented by Ippolito (1992), Chevalier and Ellison (1997) and Sirri and Tufano (1998), we include the differential weekly return of share class i between week t and t-2 (Delta Return). We also control for advisors’ incentives to generate fees. The idea is that advisors could use taxable distributions as an excuse to encourage clients to make changes in their portfolios, which in turn generate transaction-based fees in the form of load charges. To control for this possibility, we include the total advisor compensation as an additional control, which is measured as the sum of front-end loads, back-end loads, and 12b-1 fees (Advisor Compensation).
25In further regressions we extend our baseline specification by sequentially including time (calendar month and year) fixed effects, investment objective fixed effects as well as other fund and share class level controls. Those controls include the fund share’s total expense ratio (Expense ratio ), the logarithm of the fund share’s total net assets under management (Share class assets ), and the fund’s yearly turnover ratio (Portfolio turnover ). The first two control
23Investors might start thinking about avoiding distributions even sooner than week t-1 and wait even after t+1 to invest in a fund. To account for this possibility we replicate all tests in the paper with the modification that the dependent variable now denotes the difference between cumulative normalized net flows in weekst+1 to t+2 and the cumulative normalized net flow in weekst-1 to t-2. Results (not reported) are qualitatively the same.
24We acknowledge thatFi,t+1is affected by net flows in weektsince net flows intdetermine the total net assets under management int. For robustness we employ:
∆Fi,t= net flowsi,t+1
assets under managementi,t−2 − net flowsi,t−1
assets under managementi,t−2
in an alternative specification and repeat our analyses. Results (not reported) are qualitatively the same.
25Results are not different when we do not include 12b-1 fees in this calculation.
variables are at the share class level, while the last one, Portfolio turnover, is at the fund level since multiple share classes are backed by the same portfolio and thus share the same turnover.
To be consistent with the Delta Return calculation, which uses the return of week t-2, all four additional controls are lagged by two weeks. To account for possible correlations both within time periods and funds’ share classes, we follow Petersen (2009) and cluster standard errors by fund and week.
Table 2.2: Impact of financial advice on tax-avoidance behavior
Dependent variable: difference in normalized weekly net flows around week t
Model: 1 2 3 4
Constant -0.0085 0.0463 0.0395 0.0055
(0.2465) (0.4814) (0.5453) (0.9395)
Distribution 0.3118 *** 0.2789 *** 0.2872 *** 0.2876 ***
(0.0000) (0.0001) (0.0001) (0.0001)
Indirect -0.0049 -0.0048 -0.0031 -0.0059
(0.4668) (0.9688) (0.9798) (0.9621)
Distribution×Indirect 0.1685 ** 0.1805 ** 0.1845 ** 0.1852 **
(0.0396) (0.0272) (0.0234) (0.0228)
Delta return 0.0189 *** 0.0188 *** 0.0188 *** 0.0188 ***
(0.0000) (0.0000) (0.0000) (0.0000)
Advisor compensation 0.0008 0.0008 0.0007 0.0009
(0.3066) (0.3158) (0.3985) (0.3084)
Expense ratio 0.0088
(0.1183)
Share class assets 0.0020
(0.3292)
Portfolio turnover 0.0000
(0.4339)
Calendar month fixed effects No Yes Yes Yes
Calendar month fixed effects×Indirect No Yes Yes Yes
Year fixed effects No Yes Yes Yes
Year fixed effects×Indirect No Yes Yes Yes
Investment objective fixed effects No No Yes Yes
Number of observations 730,007 730,007 730,007 730,007
Adj. R2 0.0024 0.0027 0.0027 0.0027
Notes: This table presents results from pooled OLS regressions that relate fund shares’ flow changes with fund shares’
distributions. The analysis is done at the share class and weekly level. We estimate share classes’ flow changes as:
∆Fi,t=Fi,t+1−Fi,t−1.
Thereby, for each share class and week flow changes (∆F) are estimated as the differential between fund shares’ weekly net flows before and after the week of observation. Net flows are reported in percentage points and normalized by fund shares’ assets under management lagged by one week. The main independent variables include: Distribution, a binary variable that equals one if the share class is subject to a taxable distribution and zero otherwise as well as Indirect, a binary variable that equals one if the share class is indirectly sold and zero otherwise. Additional independent controls include Delta return, Advisor compensation, Expense ratio, Share class assets, and Portfolio turnover. Delta return, is the fund share’s differential in weekly returns between the current week and the return lagged by two weeks. Advisor compensation, is the size of the compensation that financial advisors receive measured as the sum of the front-end load, back-end load, and 12b-1 fee. Expense ratio, represents the fund share’s total expense ratio. Share class assets, represents the logarithm of the fund share’s total net assets under management. Portfolio turnover, is the fund’s yearly turnover ratio. Expense ratio, Share class assets, and Portfolio turnover are lagged by two weeks. Regressions are run with and without calendar month and year fixed effects and investment objective fixed effects. P-values reported in parentheses are based on robust standard errors clustered by fund and week. ***, **, * denote statistical significance at the 1%, 5%, and 10% significance level, respectively.
Results reported in Table 2.2 confirm a general tax-avoidance pattern in fund flows around taxable distributions. In all models, the incremental effect of a distribution on the flow change in the direct channel is about 0.30 percentage points, that is, the flow in the week after a taxable distribution is about 0.30 percentage points larger than the flow in the week before.
More importantly, however, the estimated coefficient on the interaction term shows that the tax-avoidance effect is significantly stronger in the indirect channel than in the direct channel.
It is about 0.18 percentage points and is significant in all models. This suggests that the incremental effect of a distribution on the flow change in the indirect channel is about 0.48 percentage points, thus 60 percent larger than in the direct channel. This result provides support for our Tax-Advisory Hypothesis.
Although we do not have detailed data at the account level to make precise inferences about the economic magnitude of the effect, we make an attempt at a simple back-of-the-envelope calculation. A reasonable interpretation of our coefficient estimate is that for each distribution that an advised investor is able to avoid, the direct investor avoids only 62.5 percent (1/1.6) of the associated tax liability. The distribution yields reported in Table 2.1, combined with marginal tax rates applied as in Sialm (2009) and Sialm and Starks (2012), produce tax burden estimates of 68 bp for the indirect and 79 bp for the direct share class. Thus, if the indirect investor was able to fully avoid her tax burden, the average direct investor would still carry a tax burden of 30 bp (37.5 percent of 79 bp), suggesting a tax saving of 30 bp for the indirect investor. However, this tax saving should be viewed as a rough approximation for the following reasons: First, because we rely on weekly but not daily flows, we might not be able to capture the full extent of the flow effect. Second, given the aggregate nature of the flow data, we are not able to determine the fraction of the indirect investors that are able to fully avoid their tax burdens. Finally, the tax saving is calculated based on the assumption of identical tax rates for indirect and direct investors. Again, not having investor level data, we are unable to determine the difference in tax rates faced by the direct and indirect investors in our sample.
Regarding the control variables, Delta Return has a significantly positive impact on the flow change variable, which is consistent with flows following returns. The coefficient on Advisor Compensation is insignificant indicating that the compensation of advisors has no impact of fund shares’ flow changes. All our results are virtually identical in the various models, suggesting that neither the fixed effects nor the other controls have a notable impact on our main finding.
In summary, our results suggest that mutual fund investors exhibit behavior that is consis-
tent with a tax-avoidance motivation in both channels. However, the effect of tax-avoidance
on flows is much stronger among indirect channel investors. This is consistent with financial advisors informing their clients about impending distributions and advising them accordingly to delay investments until after taxable distributions take place.
2.4 Alternative explanations
In this section we explore alternative explanations for why indirect channel investors exhibit stronger tax-avoidance behavior.
2.4.1 Do unobservable fund characteristics drive the results?
To rule out the possible impact of unobserved fund characteristics, we run a matched sample analysis and focus on a subset of funds that contemporaneously offer indirect- and direct-sold share classes. This allows us to compare the tax-avoidance behavior between indirect- and direct-sold share classes within the same fund.
26We start by estimating investors’ reaction around distribution weeks and non-distribution weeks for each share class. We calculate the average flow changes for each share class across all distribution weeks and non-distribution weeks separately and denote these averages, respectively by ∆F
Distand ∆F
N on−Dist. Then we compute the difference between these averages for each share class i as:
∆FD
i= ∆F
Disti− ∆F
N on−Disti, (2.3)
In economic terms, ∆FD measures the abnormal investor reaction to distributions in a particular share class. Since we are interested in comparing the abnormal reaction to fund distributions for indirect- and direct-sold share classes belonging to the same fund, we next average the abnormal flow changes, ∆FD, across all share classes that belong to the indirect and direct channels of fund n, respectively. We denote these averages as ∆FD
Indnand ∆FD
Directnand calculate the difference between them as follows:
DID
n= ∆FD
Indn− ∆FD
Directn, (2.4)
26Although most mutual fund families (e.g., Vanguard) offer automatic reinvestment programs whereby distri- butions are automatically reinvested on the day of the distributions, there could be families where automatic reinvestment takes place with a delay. For these families, delayed reinvestment of distributions could cause flows after the distribution week to be higher than before, creating a flow change pattern that would be con- sistent with tax-avoidance. However, the speed of automatic reinvestments is determined at the fund level, meaning that all the share classes that belong to the same fund would have the same reinvestment policy. Thus, comparing share classes within the same fund properly controls for unobserved reinvestment-related issues.
Table 2.3 reports average ∆FD
Indn, ∆FD
Directn, and DID
nfor the subset of 127 funds from our sample with share classes offered through both distribution channels.
Table 2.3: Funds with indirect- and direct-sold shares
∆FD
Share class subsample Indirect Direct DID
All 0.5421 ** 0.0836 0.4585 **
(0.0189) (0.7198) (0.0307) With longest history 0.6297 ** 0.1760 0.4537 **
(0.0133) (0.4740) (0.0438)
Notes: This table presents results on flow measures for funds that have contemporaneous indirect- and direct-sold fund shares. We compare the tax-avoidance behavior of indirect and direct investors within the same fund by using a difference in differences flow measure, DID. We obtain the difference in differences flow measure in a two-step procedure. First, we estimate the differential between fund shares’ flow changes around distribution weeks and non-distribution weeks as:
∆FDi= ∆FDisti −∆FN on−Disti ,
where ∆FDisti represents a share class’ average flow change (∆F) over distribution weeks and ∆FN on−Disti represents a share class’ average flow change (∆F) over non-distribution weeks. Second, we calculate the difference in differences flow measure DID for each fund n as:
DIDn= ∆FDIndn −∆FDDirectn ,
where ∆FDIndn (∆FDDirectn ) represents the average flow change differential around distribution weeks and non- distribution weeks of all share classes that belong to the indirect (direct) distribution channel. We report statistics on flow change differentials and the difference in differences flow measure for two subsamples. Results in the first row include all the share classes that belong to a fund that has at least one contemporaneous direct- and indirect-sold share class.
Results from the second row include only the share classes with the longest history for each fund and distribution channel.
P-values are reported in parentheses. ***, **, * denote statistical significance for flow differentials larger than zero at the 1%, 5%, and 10% significance level, respectively.
In the first row of Table 2.3, the calculations are based on all share classes of a fund as described above, and in the second row we keep for each fund only the share class from each channel with the longest history. Both rows lead to the same conclusion, DID
nis positive and significant at the 5 percent level. This means that the tax-avoidance behavior of investors in the indirect channel is stronger than that of investors in the direct channel from the same fund.
Thus, our main result persists even after we explicitly control for unobserved fund characteris- tics.
2.4.2 Are retirement flows responsible?
Even though we removed all share classes that are exclusively designed for retirement savings
plans (R shares) from our sample, the remaining shares could still be jointly available to retire-
ment investors (through retirement plans) and to non-retirement investors. Thus, it is possible
that the share classes in the two distribution channels differ with respect to the fraction of
flows that come from tax-exempt retirement investments. If retirement investments are more
prevalent in the direct channel, we would expect flows in the direct channel to be less sensi-
tive to tax considerations, consistent with the main finding of our paper. To examine whether retirement flows are responsible for the differential tax-avoidance behavior between direct and indirect investors, we identify share classes that experience no retirement flows in a given year and replicate our tests on that subset.
We identify share classes with no retirement flows from Pensions & Investments annual surveys, where mutual fund families report the assets held in defined contribution (DC) accounts in individual fund shares that are used the most by DC plans. Fund families are asked to report the 12 most used funds by DC plans in each broad investment category (Domestic Equity, Domestic Fixed Income, International Equity, Balanced, and Money Market). We link the DC information from the Pensions & Investments surveys to the share classes in our sample using share tickers and classify share classes with zero retirement flows each year by identifying share classes that have no DC asset information. Focusing on domestic equity funds, we identify families that report DC asset data for fewer than 12 funds. Then we consider funds for which the fund families do not report DC assets as having zero DC assets.
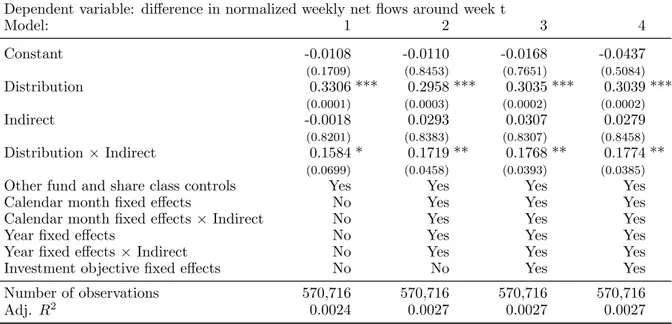
Table 2.4: Impact of financial advice on tax-avoidance behavior for non-DC fund shares
Dependent variable: difference in normalized weekly net flows around week tModel: 1 2 3 4
Constant -0.0108 -0.0110 -0.0168 -0.0437
(0.1709) (0.8453) (0.7651) (0.5084)
Distribution 0.3306 *** 0.2958 *** 0.3035 *** 0.3039 ***
(0.0001) (0.0003) (0.0002) (0.0002)
Indirect -0.0018 0.0293 0.0307 0.0279
(0.8201) (0.8383) (0.8307) (0.8458)
Distribution×Indirect 0.1584 * 0.1719 ** 0.1768 ** 0.1774 **
(0.0699) (0.0458) (0.0393) (0.0385)
Other fund and share class controls Yes Yes Yes Yes
Calendar month fixed effects No Yes Yes Yes
Calendar month fixed effects×Indirect No Yes Yes Yes
Year fixed effects No Yes Yes Yes
Year fixed effects×Indirect No Yes Yes Yes
Investment objective fixed effects No No Yes Yes
Number of observations 570,716 570,716 570,716 570,716
Adj. R2 0.0024 0.0027 0.0027 0.0027
Notes: This table presents results from pooled OLS regressions that relate fund shares’ flow changes with fund shares’
distributions. The sample is restricted to the observations of fund shares without defined contribution (DC) investments.
The main independent variables include: Distribution, a binary variable that equals one if the share class is subject to a taxable distribution and zero otherwise as well as Indirect, a binary variable that equals one if the share class is indirectly sold and zero otherwise. Other independent variables are defined as in Table 2.2 but not reported for brevity. They include Delta return and Advisor compensation (Model 1-4), augmented by Expense ratio, Share class assets, and Portfolio turnover in Model 4. Regressions are run with and without calendar month and year fixed effects and investment objective fixed effects. P-values reported in parentheses are based on robust standard errors clustered by fund and week. ***, **, * denote statistical significance at the 1%, 5%, and 10% significance level, respectively.