Essays on Mutual Fund Governance and Corporate Governance
Inauguraldissertation zur
Erlangung des Doktorgrades der
Wirtschafts- und Sozialwissenschaftlichen Fakultät der
Universität zu Köln
2015
vorgelegt von
Diplom-Ökonom Florian Sonnenburg aus
Köln
Referent: Prof. Dr. Alexander Kempf
Korreferent: Prof. Dr. Dieter Hess
Tag der Promotion: 21.01.2016
Acknowledgements
This thesis is the result of five years’ work at the Department of Finance at the University of Cologne. I would like to acknowledge several people for helping me during my dissertation process.
First and foremost, I wish to express my sincere gratitude to my supervisor, Prof. Dr.
Alexander Kempf, for his continuous support, encouragement, and guidance throughout my doctoral work. I especially would like to thank him for his constructive criticism and insightful suggestions, and for giving me the opportunity to pursue research on topics for which I am truly passionate. I am also very grateful to Prof. Dr. Dieter Hess for co-reviewing my thesis, and to Prof. Dr. Thomas Hartmann-Wendels for chairing the dissertation defense committee.
I would also like to give special thanks to my co-authors: I am thankful to Dr. Alexander Pütz for his willingness to share his experience, as well as for his continuous support, which was very helpful for me to learn how to develop research. Furthermore, I express my heartfelt thanks to Dr. Peter Limbach for spending countless hours discussing various issues with me, for his numerous valuable suggestions to improve my dissertation, and, above all, for his friendship. I am also grateful to Thorsten Martin for a stimulating environment for developing our research paper and for many inspiring discussions. I am looking forward to continue doing research with all of them.
I would also like to thank Prof. Dr. André Betzer for believing in me and for supporting me. I am likewise thankful to Simone Lang for her ongoing guidance and for always lending me her ear when I needed it. Furthermore, I thank my current and former colleagues at the Department of Finance and the University of Cologne for their inspiring discussions, critiques and suggestions. I am especially thankful to Sebastian Bethke, Dr. Kerstin Drachter, Prof. Dr.
Monika Gehde-Trapp, Dr. Niklas Hüther, Dr. Philipp Immenkötter, Stefan Jaspersen, and Dr. Christoph Sorhage.
Finally, I am deeply grateful to my family and my friends for providing ongoing support
and friendship that I needed. Those who are thanked know who they are.
Contents
List of Tables ... VIII
List of Figures ... X
1 Introduction ... 1
2 The Impact of Duality on Managerial Decisions and Performance: Evidence from the Mutual Fund Industry ... 7
2.1 Introduction ... 7
2.2 Data... 10
2.3 Impact of duality on managerial decisions ... 14
2.4 Impact of duality on manager performance ... 19
2.4.1 Level of performance ... 19
2.4.2 Performance extremity ... 23
2.5 Alternative explanations ... 25
2.5.1 Causality ... 25
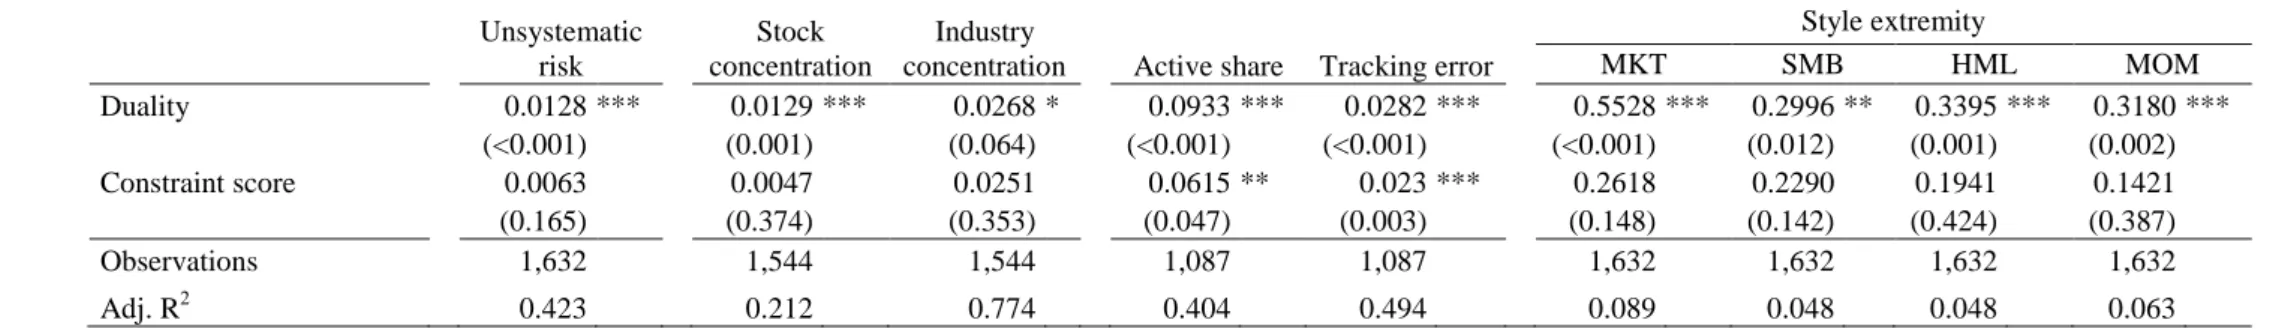
2.5.2 Impact of constraints ... 28
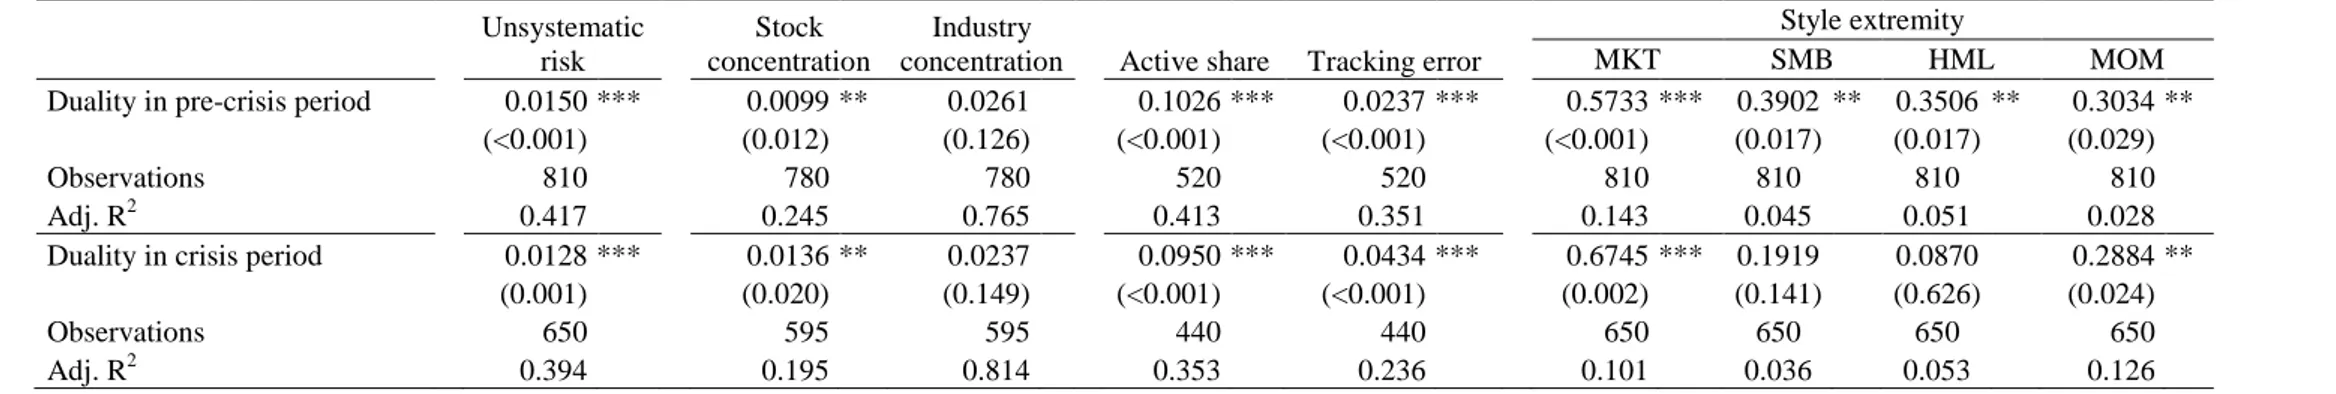
2.5.3 Impact of financial crisis ... 29
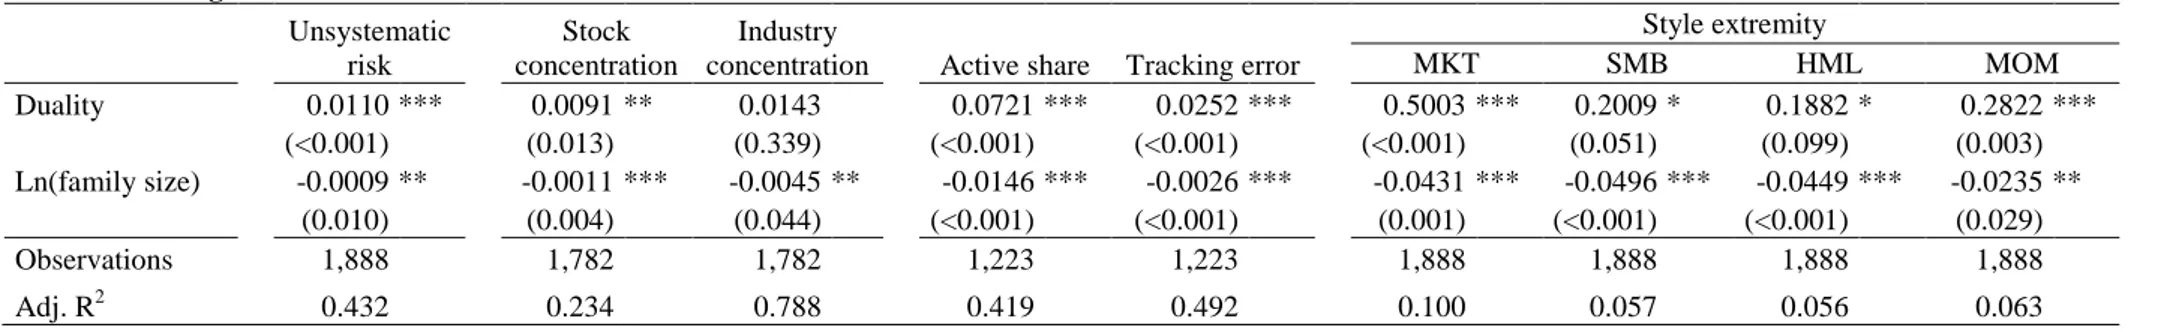
2.5.4 Impact of family size ... 32
2.6 Impact of the power of the manager ... 34
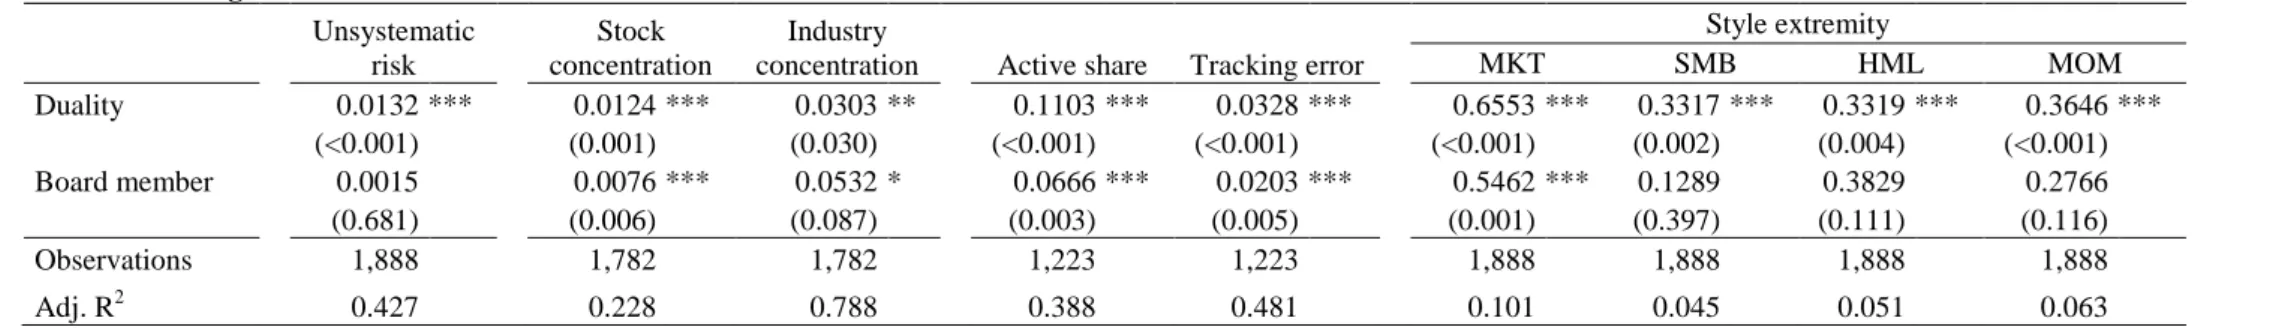
2.6.1 Fund manager as ordinary member of the board ... 34
2.6.2 Independent members of the board ... 36
2.7 Conclusion ... 39
3 Managerial Ownership Changes and Mutual Fund Performance ... 41
3.1 Introduction ... 41
3.2 Data and summary statistics ... 45
3.3 Ownership changes and changes in future fund performance ... 48
3.3.1 Main results ... 48
3.3.2 Robustness ... 49
3.4 Ownership changes and other predictors of future fund performance ... 53
3.5 Ownership changes induced by family policies ... 56
3.6 Conclusion ... 60
4 CEO Fitness and Firm Value ... 61
4.1 Introduction ... 61
4.2 Data and sample ... 66
4.2.1 Data on CEO fitness and sample selection ... 66
4.2.2 Summary statistics ... 70
4.3 Empirical results ... 73
4.3.1 CEO fitness and firm value ... 73
4.3.2 Channels ... 75
4.3.2.1 CEO fitness and firm profitability ... 75
4.3.2.2 CEO fitness and M&A performance ... 77
4.4 Robustness and identification ... 82
4.4.1 Do we really measure CEO fitness? ... 82
4.4.1.1 When fitness matters most ... 83
4.4.1.2 Unobserved CEO heterogeneity ... 86
4.4.1.3 Permutation tests: random assignment of pseudo fitness ... 89
4.4.2 Reverse causality and unobserved time-varying heterogeneity ... 90
4.4.2.1 Do fit CEOs have the time to be fit? ... 91
4.4.2.2 Unobserved firm- and industry-specific heterogeneity ... 93
4.4.3 Sudden deaths and the value of fitness ... 97
4.5 Conclusion ... 99
References ... 101
Appendix to Chapter 4 ... 111
List of Tables
Table 2.1: Descriptive statistics ... 12
Table 2.2: Descriptive statistics for duality and non-duality funds ... 13
Table 2.3: Managerial decisions ... 16
Table 2.4: Performance ... 21
Table 2.5: Performance extremity ... 24
Table 2.6: Second stage regressions ... 27
Table 2.7: Restrictedness of funds... 28
Table 2.8: Impact of constraints ... 30
Table 2.9: Impact of financial crisis ... 31
Table 2.10: Impact of family size ... 33
Table 2.11: Managerial power: board chair versus ordinary board member ... 35
Table 2.12: Managerial power: impact of independent board members ... 37
Table 3.1: Descriptive statistics ... 47
Table 3.2: Ownership changes and changes in fund performance ... 50
Table 3.3: Robustness ... 52
Table 3.4: Ownership changes and alternative predictors of fund performance ... 55
Table 3.5: Family policy change: fund performance ... 57
Table 3.6: Family policy change: trading activity ... 59
Table 4.1: Largest 15 U.S. marathons by number of finishers ... 67
Table 4.2: Summary statistics... 71
Table 4.3: CEO fitness and firm value ... 74
Table 4.4: CEO fitness and firm profitability ... 76
Table 4.6: When fitness matters most: evidence from CEO characteristics ... 85
Table 4.7: Unobserved CEO heterogeneity: CEO-firm fixed effects ... 88
Table 4.8: Permutation tests: random assignment of pseudo fitness ... 89
Table 4.9: Do fit CEOs have the time to be fit? ... 92
Table 4.10: Excluding fit CEOs with fast marathon finish times ... 94
Table 4.11: Alternative time-variant explanations ... 96
Table 4.12: Sudden deaths and the value of fitness ... 98
List of Figures
Figure 4.1: Company clusters and marathon locations ... 68
Figure 4.2: Fraction of CEOs identified as marathon runners over the sample period 70
Figure 4.3: CEO fitness and firm value ... 72
Figure 4.4: CEO fitness and firm value within the treatment group ... 87
Chapter 1
1 Introduction
This thesis comprises of three essays on mutual fund and corporate governance. It focuses on (1) the impact of manager duality on managerial decisions and performance, (2) the relationship between managerial ownership and performance, and (3) the role of physical fitness as an important managerial characteristic relevant for hiring decisions of the board of directors.
1The need for governance in corporations as well as mutual funds rests on the idea that managers may act in opportunistic ways that are detrimental to shareholders when ownership and control are separated and contracts are incomplete (see, e.g., Jensen and Meckling (1976), Fama and Jensen (1983), and Hart (1995)). Put differently, managers seek to maximize their personal utility, which does not necessarily mean they maximize shareholder wealth. For instance, Yermack (2006) shows that firms in which chief financial officers (CEOs) are permitted to use their companies’ aircrafts for personal travel (a sign of weak corporate governance) underperform the market benchmark by about 4% per year. In the context of mutual funds, managers may engage in opportunistic risk-taking behavior, which may ultimately hurt investors’ performance (see, e.g., Brown, Harlow, and Starks (1996), Kempf and Ruenzi (2008), Kempf, Ruenzi, and Thiele (2009), and Huang, Sialm, and Zhang (2011)).
Overall, the importance of governance mechanisms to mitigate agency conflicts between managers and shareholders has been highlighted by a series of corporate collapses, including
1 Mutual funds are often seen as being similar to regular corporations as both are separate legal entities, having their board of directors and shareholders. However, there are significant differences between mutual funds and regular corporations with respect to governance mechanisms (see, e.g., Roiter (2015) and footnote 3 of the present thesis for an example). Thus, the terms mutual fund governance and corporate governance are not used interchangeably in this thesis.
the cases of Enron and WorldCom, or several fund scandals involving market timing and late trading in 2003 (see Zitzewitz (2006)). As a consequence, a sound understanding of the mechanisms that improve or hamper mutual fund and corporate governance appears highly relevant.
The academic literature on mutual fund and corporate governance can broadly be separated into two strands. One strand of this literature is concerned with external governance mechanisms such as the market for corporate control and the impact of blockholders and institutional shareholders on corporate governance.
2As mutual fund shareholders are able to redeem their fund shares at the net asset value, fund researchers mainly focus on investor flow sensitivity as an external mutual fund governance mechanism.
3The other strand of the governance literature examines mechanisms of internal governance, primarily the board of directors, the relationship between managerial ownership and performance, and, more generally, the role of managerial incentives.
4The essays in this thesis complement the latter strand of the governance literature.
The first essay (Kempf, Puetz, and Sonnenburg (2013)) analyzes the consequences of manager duality in the U.S. mutual fund industry, i.e., a sole leadership structure where the manager also acts as the chairman of the board. While previous studies show that manager duality is often associated with poor company performance (see, e.g., Rechner and Dalton (1991)) and a lower performance-turnover sensitivity (see, e.g., Goyal and Park (2002)), comprehensive evidence on the behavior of duality managers is scarce. An analysis of manager duality in the fund industry is attractive as the decisions of fund managers are
2 Some examples of studies that analyze the external market for corporate takeovers are Holmstrom and Kaplan (2001), Denis and McConnell (2003), Kini, Kracaw, and Mian (2004), Masulis, Wang, and Xie (2007), Netter, Poulsen, and Stegemoller (2009), and Servaes and Tamayo (2014). Examples of papers that examine the role of blockholders and institutional investors in corporate governance are Barclay and Holderness (1991), Brav, et al. (2008), Cronqvist and Fahlenbrach (2009), Burns, Kedia, and Lipson (2010), Becker, Cronqvist, and Fahlenbrach (2011), Clifford and Lindsey (2015), and Edmans (2014) for an overview on the relationship between blockholders and corporate governance.
3 The idea that fund investors can discipline fund managers by redeeming their shares at the net asset value is based on Fama and Jensen (1983). In regular corporations, shareholders do not have this disciplining mechanism, as they sell their shares at a stock price which is likely to incorporate the problem with the CEO.
Some examples of studies that investigate external fund governance are Sirri and Tufano (1998), Johnson (2010), and Evans and Fahlenbrach (2012).
4 Among others, Hermalin and Weisbach (2003), Boone, et al. (2007), Coles, Daniel, and Naveen (2008), and Linck, Netter, and Yang (2008) examine board structure and its impact on corporate outcomes. For an overview on the role of the board of directors in corporate governance, see Adams, Hermalin, and Weisbach (2010). Some examples of studies that analyze the relation between managerial ownership and corporate performance are Himmelberg, Hubbard, and Palia (1999), Zhou (2001), Fahlenbrach and Stulz (2009), and Lilienfeld-Toal and Ruenzi (2014). Examples of papers that investigate board effectiveness in the mutual fund industry are Tufano and Sevick (1997), Khorana, Tufano, and Wedge (2007), Ferris and Yan (2007), Adams, Mansi, and Nishikawa (2010), and Ding and Wermers (2012). Khorana, Servaes, and Wedge (2007) and Evans (2008) study the relation between fund manager ownership and performance. Some examples of studies that examine board directors’ or fund managers’ incentives are Chen, Goldstein, and Jiang (2008), Cremers, et al. (2009), and Ma,
directly reflected in fund returns. In our analyses, we focus on single managed U.S. equity funds since the link between a fund manager’s role as chairman of the board and her task to manage the portfolio are most clearly connected if the fund is single-managed. In this case, the fund manager has higher managerial discretion: She decides on the investments of the fund and, at the same time, sets the agenda for the board meetings and potentially replacing her.
Consistent with the aforementioned argumentation, we expect that duality managers are aware of the lower risk of replacement and follow more risky investment strategies than non-duality managers. This strategy is highly sensible since their compensation scheme tends to be more option-based as that of non-duality managers. They benefit from good investment decisions in the same way as non-duality managers without bearing a high replacement risk in case their investment decisions are not successful. We conjecture that it is unfavorable to let the manager of the fund also serve as the board of directors’ chairman from an investor’s point of view. In particular, duality managers may use their higher discretion in their own interest and spend less effort on their work translating into worse performance compared to non-duality managers. Finally, we expect that the effects of manager duality on investment behavior and performance can be mitigated by a more independent board, i.e., if the manager is only an ordinary board member but not the chairman of the board or if there are many independent directors on the board and if they have invested own money in the fund.
Our main results confirm our expectations about the behavior of duality managers. They make more risky investment decisions than non-duality managers. In particular, duality managers take risk that they could easily avoid, deviate more from their benchmarks, make more extreme decisions, and, consequently, deliver more extreme performance outcomes.
Consistently, we document that duality managers significantly underperform non-duality managers by up to 2.5 percent per year. We rule out several alternative explanations and show that our results are not driven by an endogeneity problem, by fewer investment restrictions for duality managers, by the financial crisis, or by a family size effect. Finally, our results support the idea that the effect on investment behavior and performance depends on the extent to which the manager dominates the board. The effect on investment behavior and performance is much weaker if the manager is only an ordinary member of the board and if there are many independent members on the board who invest their own money in the fund.
The findings from the first essay suggest that it is detrimental for shareholders if the
manager also serves as the chairman of the board. The most important consequence from the
investor’s point of view is that duality managers make more risky investment decisions.
A more powerful board consisting of more independent directors seems to be crucial to moderate this agency problem. Another way to better align the manager’s interests with those of shareholders can be managerial ownership, given that managers share the downside risk of their own actions with shareholders when they invest their personal wealth in their funds. In this spirit, several well-known mutual fund companies, such as Franklin Templeton Investments, have started requiring their managers to invest in the funds they manage.
5Therefore, the second essay (Martin and Sonnenburg (2015)) is concerned with the relation between managerial ownership and fund performance. In particular, we analyze the impact of changes in managerial ownership on changes in future performance. Earlier studies show that the level of ownership predicts future performance in the cross-section (see, e.g, Khorana, Servaes, and Wedge (2007)). Looking at changes in ownership to predict changes in performance has two advantages. First, ownership levels might be correlated with unobserved fund characteristics that also affect performance such as restrictions on fund managers’
actions like short-selling constraints. As a consequence, the observed relationship between managerial ownership and performance might be spurious. Second and more important, previous studies cannot investigate the economic mechanism through which managerial ownership may be related to future performance. This relation could be driven by two distinct economic mechanisms. On the one hand, managers may have superior information on future fund performance. If so, managers would very likely invest in those funds they expect to perform well. On the other hand, the incentive alignment hypotheses states that managerial ownership aligns manager’s interests with those of fund shareholders leading to better (i.e., more shareholder-oriented) investment decisions or more effort. This is expected to translate into better fund performance.
To disentangle both hypotheses, we use the adoption of fund family policies requiring managers to hold some ownership in all funds they manage. The idea is that these changes are unlikely to reflect the manager’s information. If the superior information hypothesis holds, we do not expect that ownership changes which are mandated by the fund family increase fund performance. If the incentive alignment hypothesis holds, ownership leads to aligned incentives regardless if the change in ownership is mandatory or voluntary. Therefore, we expect that mandatory and voluntary ownership changes to be positively related to future changes in performance. Our analyses yield the following results. Ownership changes positively predict changes in future risk-adjusted fund performance. A one-standard-deviation increase in ownership predicts a 1.6 percent increase in alpha in the following year. This
5 See “Another Way to Assess a Mutual Fund” in The Wall Street Journal MarketWatch (26/07/2006) and
result stands several robustness tests. Furthermore, fund managers who are required to increase their ownership by fund family policy show the strongest increase in alpha. In additional analysis, we find that managers who increase ownership simultaneously to the adoption of a family wide ownership requirement increase their active share, turnover, unobserved actions and their equity holdings and decrease their cash holdings. This implies that higher ownership aligns managers’ interests with shareholders and induces higher managerial effort.
The first two essays illustrate that board independence and managerial ownership can help to improve fund governance. Besides providing managers with optimal compensation contracts and monitoring them, one of the most important tasks of the board of directors is to hire and fire managers (see, e.g., Adams, Hermalin, and Weisbach (2010)).
6Thus, directors play a crucial role in selecting managers. In this context, the question arises which personal characteristics matter for performance. More recently, a growing literature deals with this question.
7The third essay (Limbach and Sonnenburg (2015)) contributes to this literature. It is related to the first two essays as it investigates the impact of managers’ characteristics on performance. In particular, we use hand-collected data on U.S. marathons to study the impact of CEO’s fitness on firm value. We classify CEOs as fit if they finish a marathon in a given year.
8Previous studies from the fields of biology, medicine, psychology and sports document that physical activity and fitness have moderating effects on stress (see, e.g., Gal and Lazarus (1975)) and positive effects on cognitive functions and executive-control processes (see, e.g., Colcombe and Kramer (2003)), and on academic and job performance (see, e.g., Coe, et al.
(2006), and Rhea, Alvar, and Gray (2004)). Therefore, fitness should play an important role for CEOs as their jobs are characterized by frequently changing tasks and demands, far-reaching decisions, and high stress. We expect that fit CEOs can better cope with the high
6 In this context, the literature mainly focuses on the effects of management turnover on performance. Among them are Hotchkiss (1995), Denis and Denis (1995), Khorana (2001), and Jenter and Kanaan (2015).
7 Examples of studies that analyze the relation between manager characteristics and firm outcomes are Bertrand and Schoar (2003), Malmendier, Tate, and Yan (2011), Schoar and Zuo (2015), Kaplan, Klebanov, and Sorensen (2012), Custódio, Ferreira, and Matos (2013), Custódio and Metzger (2013), Benmelech and Frydman (2015), and Custódio and Metzger (2014). Examples of studies that look at the relationship between fund manager characteristics and fund performance are Golec (1996), Chevalier and Ellison (1999a), Gottesman and Morey (2006), and Fang, Kempf, and Trapp (2014).
8 We focus on regular corporations to examine the impact of managers` fitness on performance because mutual fund manager ages are not reported in commonly used mutual fund databases. However, managers` age is necessary for an accurately match with our data on marathon finishers. In contrast, the Corporate Library’s Board Analyst database provides detailed information about CEOs` names and age. Nevertheless, we believe that our results are transferable to other top executives such as fund managers.
stress of their jobs and should be associated with better performance.
9We test this hypothesis using a panel of S&P 1500 companies.
Consistent with our hypothesis, we find a positive impact of CEO fitness on firm value.
Tobin’s Q is found to be almost 5% larger for firms managed by a fit CEO. To gain a better understanding how fitness translates into firm value, we study firm profitability. We find that fit CEOs are associated with higher return on assets and higher free cash flow to total assets.
We further document that fit CEOs are associated with higher abnormal announcements returns of merger & acquisitions (M&A), especially if these M&As involve large and public targets. We interpret this result as further support for our hypothesis as these M&As are typically very stressful and work-intensive for the CEO due to considerable media scrutiny and pressure to perform. Furthermore, we find the strongest effects on firm value in subsamples where fitness is most important, i.e., for CEOs with high workload, above median age, and above median tenure. This is consistent with the literature and the view that fitness moderates stress and positively affects cognitive functions and performance. Our results are robust to various tests for endogeneity, including CEO-firm fixed effects, time-varying firm and industry effects, permutation tests, reverse causality and sudden deaths. Overall, the results from the third essay provide an explanation for the growing importance of fitness in the managerial labor market.
Taken together, the three essays provide new insights into mutual fund and corporate governance. First, duality managers tend to make more risky investment decisions than non-duality managers. These effects are stronger if managers have more power in the board of directors. Second, managerial ownership is found to positively affect performance. This positive relationship is likely to be the result of better alignment between managers’ and shareholders’ interests. Finally, managers’ physical fitness is associated with better firm performance and seems to be an important attribute which boards should take into account when selecting a new CEO.
9 In line with this argumentation, there is a growing trend among CEOs to run marathons, see „Executive endurance” in The Wall Street Journal MarketWatch (04/10/2007). Examples of running CEOs include Robert
Chapter 2
2 The Impact of Duality on Managerial Decisions and Performance: Evidence from the Mutual Fund Industry *
2.1 Introduction
Agency problems are imminent when the decision makers do not bear the wealth effects of their decisions. Therefore, companies typically separate decision making from decision control. The board of directors’ role is to control the decisions of the managers and – as the last resort – to fire poor performing managers (see, e.g., Fama and Jensen (1983)). A natural conflict of interest arises if a manager is also member of the board of directors and, thus, controlling herself. This problem is particularly severe if the manager of a company is also chairing the board. Although advocates of such a duality structure emphasize the advantage of ensuring clear responsibilities for the success of the company, empirical evidence suggests that manager duality often leads to poor company performance (see, e.g., Rechner and Dalton
* This chapter is based on Kempf, Puetz, and Sonnenburg (2013). A previous version of this paper was titled
“Fund Manager Duality: Impact on Performance and Investment Behavior”. We thank Vikas Agarwal, Nihat Aktas, Erik de Bodt, Gjergji Cici, Rüdiger Fahlenbrach, Richard Fu, Dieter Hess, Olaf Korn, Peter Limbach, Ernst Maug, Daniel Metzger, Alexandra Niessen-Ruenzi, Alexander Wagner, Russ Wermers, and our discussants and other participants at our presentations at the 2013 EFMA Annual Meeting in Reading, 2013 FMA Annual Meeting in Chicago, 2013 Annual Meeting of the German Finance Association (DGF) in Wuppertal, and SKEMA Business School for their helpful comments.
(1991)) and makes it difficult for the board to remove poorly performing duality managers (see, e.g., Goyal and Park (2002)).
This paper is the first to analyze the consequences of manager duality on the decisions they take. We use the fund industry as our laboratory to explore this issue since managerial decisions in the fund industry are more prescribed and more precisely observed than in other industries. This makes the fund industry attractive for exploring issues of general interest in corporate finance (see, e.g., Almazan, et al. (2004)).
10We hypothesize that the reduced level of control and replacement risk of duality managers has two main consequences. First, duality managers take more risky decisions since their compensation scheme is more option-like as compared to non-duality managers. Like all managers, they benefit from good outcomes (e.g., by receiving bonus packages) but they bear a lower risk of being fired if the outcomes are bad. Second, duality managers use their flexibility in their own interest, spend less effort on their work, and eventually deliver a worse performance than non-duality managers. Furthermore, we hypothesize that the consequences for managerial decisions and performance are stronger, the more the duality manager dominates the board. Our empirical results strongly support all three hypotheses.
In our first set of tests we find strong support for the hypothesis that duality managers take more risky decisions than non-duality managers. They hold less diversified portfolios, deviate more from their benchmarks, take more unsystematic risk, and follow more extreme investment styles. For example, less than 20% of the non-duality managers take as extreme market bets as the average duality manager.
In our second set of tests, we look at the performance consequences of manager duality.
With respect to the average performance consequences, we find that funds run by duality managers (duality funds) significantly underperform funds run by non-duality managers (non-duality funds). This result holds no matter how we measure performance. In a standard multivariate regression approach we find an underperformance of up to 2.5 percent per year and in a matched-sample analysis the underperformance goes up to 3.4 percent per year. All these numbers are based on gross returns, i.e., they do not reflect the funds’ expense ratios.
Looking at net returns makes the underperformance of duality funds even stronger since they charge significantly higher total expense ratios (1.7 percent versus 1.3 percent).
10 Besides that, looking at the consequences of manager duality in the fund management industry is important in itself since the decisions in the mutual fund industry are highly relevant for millions of investors using mutual funds to save for retirement. According to ICI (2013) more than 2.1 trillion USD are held in mutual funds just through 401(k) plans at the year-end 2012. The huge amount of money being in danger makes it important to
Furthermore, consistent with their risky decisions, we find that duality managers achieve more extreme performance outcomes than non-duality managers.
We rule out various alternative explanations for our findings. We adopt an instrumental variable approach to rule out endogeneity issues. We show that the more risky decisions of duality managers do not arise because duality managers face fewer investment restrictions. In contrast, they take more risk even though they are less frequently allowed to use leverage, options, or illiquid assets in their portfolios. We also rule out the possibility that the poor performance of the duality managers is caused by the recent financial crisis, which overlaps with our sample period. One might suspect that their high risk taking might have led to poor performance only during the financial crisis, but this is not true. Our results are the same for the period before and during the financial crisis. Finally, we rule out the possibility that the performance effect is driven by a family size effect (duality funds might be more prevalent in small fund families and, as suggested by Chen, et al. (2004), small fund families might have disadvantages associated with trading commissions and lending fees leading to worse average performance in small families).
In our third set of tests, we analyze whether the strength of the duality effect on managerial decisions and performance depends on the extent the manager dominates the board. We show that the consequences are much weaker if the manager is only an ordinary member of the board but not chairing it; the effect almost disappears. Furthermore, the effect of duality on managerial decision taking and performance is smaller when independent board members gain importance. This is the case when there are more independent directors on the board and when they have a stronger incentive to monitor the fund (proxied by the amount of their own money they have invested in the fund). These findings suggest that the consequences of duality on managerial decisions and performance can be mitigated by reducing the manager’s power on the board.
Our paper contributes to three strands of the literature. First, it is related to the corporate finance literature that examines the impact of manager duality on firm performance (see, e.g., Brickley, Coles, and Jarrell (1997), and Rechner and Dalton (1991)). The main contribution to this literature is that our paper is, to our knowledge, the first to look at the consequences of duality on the managerial decisions, not just the average performance outcome.
Second, our paper contributes to the growing literature on the impact of managerial
power on managerial behavior and firm performance. Adams, Almeida, and Ferreira (2005)
show that firms whose CEOs have more decision-making power experience more variability
in performance. In a similar vein, Tang, Crossan, and Rowe (2011) show that dominant CEOs
tend to have a strategy that deviates from the industry central tendency and thus extreme performance outcomes. Bebchuk, Cremers, and Peyer (2011) show that firms run by dominant CEOs deliver worse performance. We add to this literature by first showing that duality managers (which obviously have more power than non-duality managers) tend to take more risky decisions and deliver worse and more extreme performance outcomes.
Furthermore, we show that these effects are the more pronounced, the more power the duality manager has relative to other board members.
Finally, our paper contributes to the literature on mutual fund governance which highlights the importance of independent board members for fund performance and manager replacement (see, e.g., Tufano and Sevick (1997), Khorana, Tufano, and Wedge (2007), Ferris and Yan (2007), Fu and Wedge (2011), and Ding and Wermers (2012)). We add to this literature in two ways: To begin with, we are the first to study the consequences of poor governance due to manager duality in the fund industry. Besides that, we are the first who look at the consequences of fund governance on the investment decisions of fund managers.
The remainder of this paper is organized as follows. In Section 2.2, we describe the data and provide fund and manager characteristics for duality and non-duality funds. In Section 2.3, we test our first main hypothesis by analyzing differences in the decisions taken by duality and non-duality managers. Section 2.4 is dedicated to tests of our second main hypothesis. Here we study performance differences between both groups. In Section 2.5 we show that our tests are not flawed by an endogeneity problem and rule out various alternative explanations for our findings. In Section 2.6 we test our third hypothesis by analyzing how the consequences of duality for managerial decisions and performance depend on the extent the manager dominates the board. Section 2.7 concludes.
2.2 Data
For our empirical analysis we use various data sources. From the CRSP Survivor-Bias Free Mutual Fund Database we gather information on mutual funds’ monthly returns, total net assets, and other fund characteristics.
11We focus on actively managed, U.S. domestic equity funds and exclude bond funds as well as index funds. We use the Lipper objective code to define a fund’s investment objective. We aggregate the Lipper segments into seven broad categories: Aggressive Growth, Growth and Income, Income, Growth, Sector Funds, Utility Funds, and Mid-Cap Funds. If a fund offers multiple share classes, we aggregate them at the
11 Source: CRSP, Center for Research in Security Prices. Graduate School of Business, The University of
fund level to avoid multiple counting. We concentrate on single managed funds since we conjecture that the duality effect is most pronounced if the manager has the full power to make the investment decisions. We exclude fund-year observations for which less than 12 months of return data are available. To calculate the characteristic selectivity performance measure of Daniel, et al. (1997) we link the CRSP funds to the Thomson Financial Mutual Fund Holdings Database and match the stock returns from the CRSP Monthly Stock Database to the holdings data.
Furthermore, we match the CRSP funds to the funds in the Morningstar Principia Database using fund ticker, fund name, and manager name. The Morningstar database provides detailed information on a manager’s biography that includes data on the manager’s educational background, e.g., whether she holds an MBA, a PhD, or a Chartered Financial Analysts (CFA) designation, and the date that a manager was first assigned to a fund. We calculate a manager’s industry tenure as the number of years since the year that Morningstar reports to be her first year managing a fund in the Morningstar database. We determine the manager's gender by comparing the manager's first name to a list published by the United States Social Security Administration (SSA) that contains the most popular first names by gender.
The final data source is the Statement of Additional Information (SAI), which is Part B of the mutual fund’s prospectus. It includes detailed information on each board member. The SAI is contained in the SEC filings 485APOS and 485BPOS which can be downloaded as text files from SEC EDGAR. We match these files with the CRSP funds using the fund’s name. For each fund we manually collect the following information for each board member from the SEC files: Name; whether she is interested or independent as defined by the Investment Company Act (ICA); board member’s ownership in the fund. The ownership is reported in five ranges: None; $1–$10,000; $10,001–$50,000; $50,001–$100,000;
over $100,000.
Our final sample consists of 1,901 fund-year observations covering the period 2005 - 2009. Table 2.1 reports summary statistics for the number of funds in the sample, their size (measured as total net assets), their expense ratio, age, and turnover ratio. Overall, our sample covers a total of 634 distinct funds. The average fund size is around 1.7 billion USD.
Its evolution over time clearly reflects the effect of the subprime crisis. The average expense
ratio in our sample decreases from 1.45 percent in 2005 to 1.24 percent in 2009.
Table 2.1: Descriptive statistics
Year Number Fund Size Expense ratio Fund age Turnover
2005 392 1,784 1.45 16.35 85.27
2006 423 1,814 1.36 15.60 94.62
2007 431 1,995 1.29 16.19 85.69
2008 346 1,164 1.22 17.67 100.20
2009 309 1,534 1.24 18.49 101.51
Total sample 634 1,685 1.32 16.74 92.80
Notes: This table reports summary statistics for our sample of actively single-managed U.S. equity mutual funds between 2005 and 2009. The funds belong to the market segments Aggressive Growth, Growth and Income, Income, Growth, Sector Funds, Utility Funds, and Mid-Cap Funds. For each sample year as well as the total sample, we report the number of funds in the sample, the average funds’ size measured as total net assets (TNA) in million US Dollar, the average funds’ expense ratio (in %), the average funds’ age in years, and the average funds’ turnover ratio (in %).
The average fund in our sample is about 17 years old and turns over about 93 percent of its portfolio per year. Over the sample period, the turnover ratio increases from 85 percent to 102 percent.
In Table 2.2 we report characteristics for duality and non-duality funds and managers. As shown in Panel A, for about 14 percent of all fund-year observations (covering 84 distinct funds), the manager also acts as chair of the fund’s board. Duality funds are much smaller than non-duality funds. The mean duality fund is only about half the size of the mean non-duality fund. Furthermore, duality funds charge significantly higher expense ratios.
Regarding a fund’s age and turnover, we do not find a significant difference between duality and non-duality funds.
Panel B reports the distribution of funds across market segments, separately for duality and non-duality funds. Duality funds are observed in all market segments. They are overrepresented in the growth segment and underrepresented among the sector funds.
In Panel C we look at the characteristics of the managers in our sample. The numbers in
this panel are calculated at the manager level and refer to a total of 559 managers from which
54 managers also chair their fund’s boards. We find that almost none of these duality
managers are female. The percentage is lower than the percentage of female managers in
non-duality funds. Furthermore, duality managers differ from non-duality managers with
respect to their education and experience: Duality managers hold a PhD more often and have
more industry experience.
Table 2.2: Descriptive statistics for duality and non-duality funds
Panel A: Fund characteristics
Duality Non-duality Difference
Funds managed 13.73 86.27
Fund size 894 1,811 -917 ***
Expense ratio 1.70 1.26 0.44 ***
Fund age 16.41 16.79 -0.38
Turnover 92.07 92.92 -0.85
Panel B: Market segments
Duality Non-duality Difference
Aggressive Growth 24.52 22.68 1.84
Growth and Income 16.86 13.29 3.57
Income 6.51 3.54 2.97 **
Growth 42.15 32.87 9.28 ***
Sector 4.60 16.28 -11.68 ***
Utility 0.77 2.13 -1.36
Mid Cap 4.60 9.21 -4.62 **
Total 100.00 100.00
Panel C: Manager characteristics
Duality Non-duality Difference
Female 1.85 8.71 -6.86 *
MBA 40.74 34.26 6.48
CFA 38.89 50.50 -11.61
PhD 3.70 1.00 2.70 *
Industry tenure 17.85 10.54 7.31 ***
Notes: This table reports summary statistics for funds whose managers also serve as the chair of the board of directors (duality) and for funds whose managers do not (Non-duality). In Panel A, we report the fraction of funds managed (in %), the average fund size as measured by the total net assets in million USD, the average expense ratio (in %), the average fund age in years, and the average fund turnover (in %). Panel B reports the percentage of duality and non-duality funds in the various market segments. Panel C reports the fraction of female managers (in %), the fraction of managers with an MBA (in %), the fraction of managers with a CFA (in
%), and the fraction of managers with a PhD (in %). The manager’s gender is determined by comparing the manager’s first name to a list published by the United States Social Security Administration (SSA) that contains the most popular first names by gender for the last 10 decades. Additionally, we identify the gender of managers with ambiguous first names from several internet sources like the fund prospectus, press releases, or photographs that reveal their gender. We also report the average managers’ industry tenure measured in years. To come up with an average industry tenure we first calculate the tenure for each manager. As her starting date in the industry, we take the first year the manager appears in the Morningstar database and as her ending date the last year the manager is in our sample. Thus, we have a single tenure number per manager which we then average to come up with the average value provided in the table. The last column of the table reports the difference in fund and manager characteristics between duality and non-duality funds. ***, **, and * denote statistical significance for the difference in means between both groups at the 1%-, 5%-, and 10%-level, respectively.
2.3 Impact of duality on managerial decisions
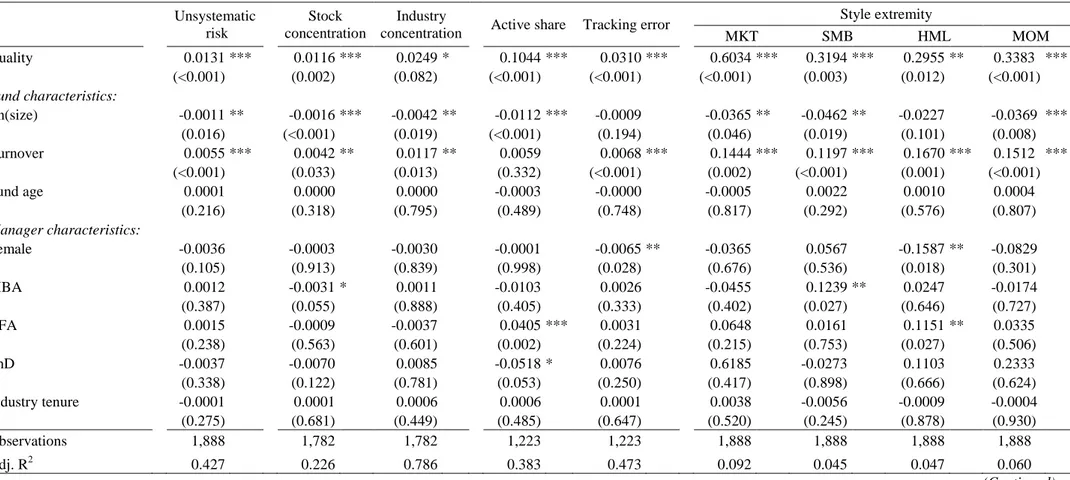
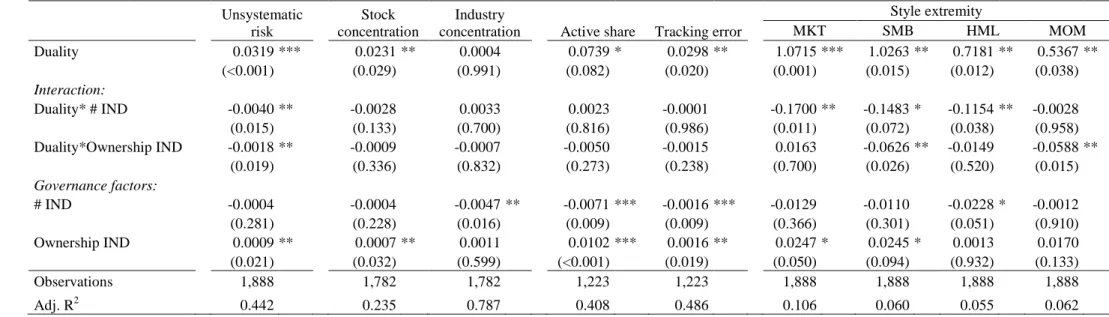
In this section, we test our first main hypothesis: Duality managers take more risky decisions than non-duality managers. We use several measures to capture different ways duality managers can take risk: First, we use unsystematic risk as a general measure of risk that could be avoided by diversification. Second, we adopt two measures (stock concentration, industry concentration) to capture the risk coming from taking large bets on specific stocks or industries. The next two measures (active share, tracking error) capture to what degree managers deviate from their benchmark. Finally, we examine whether managers take large bets on specific investment styles.
We calculate the unsystematic risk based on Carhart (1997)’s four-factor model. In each calendar year we regress a fund’s excess return on the four factor-mimicking portfolio returns using the twelve monthly return observations of the respective year.
12The annualized standard deviation of the residual is our measure of unsystematic risk.
We compute the stock concentration as the sum of the squared portfolio weights for all stocks. We do so for each quarter and then average the quarterly stock concentrations to come up with a yearly measure. To calculate the industry concentration we use the same approach but now based on the industry weights. We first sort all stocks into ten industries, as in Kacperczyk, Sialm, and Zheng (2005), and then calculate the weight for a specific industry in a portfolio by summing up the portfolio weights of all stocks belonging to that industry. The sum of the squared industry weights (averaged across the quarters of a year) is our measure of industry concentration.
To measure how a manager deviates from her benchmark, we use the active share and tracking error measures of Cremers and Petajisto (2009) and Petajisto (2013).
13The active share is calculated as the absolute difference between the portfolio weight of a stock and the stock’s weight in the respective benchmark, summed over all positions of the stock universe and divided by two. The tracking error is defined as the residual standard deviation from a regression of excess fund returns on excess benchmark returns.
To measure the extremity of a fund manager’s investment style, we again estimate the Carhart (1997) four-factor model for each fund i in each year t as we did for the unsystematic risk. From this model, we use the sensitivities (beta exposures) regarding the four factors (market factor (MKT), size factor (SMB), value factor (HML), momentum factor (MOM)) to
12 We downloaded the factor-mimicking portfolio returns for the four-factor model and the risk-free rate from Kenneth French's website at http://mba.tuck.dartmouth.edu/pages/faculty/ken.french/data_library.html.
13 We downloaded the active share and tracking error data from Antti Petajisto’s website at
capture the fund’s investment style. We follow Bär, Kempf, and Ruenzi (2011) and construct extremity measures for a manager’s factor sensitivities as:
S represents the investment style analyzed (MKT, SMB, HML, and MOM, respectively) and N
kgives the number of funds in a specific market segment k in a given year t. EM
i tS,shows high values for funds that strongly deviate in their exposure to a specific style (
i tS,) from the average exposure of their market segment (
k tS,) in absolute terms. We divide the absolute deviation by the average absolute deviation in the corresponding market segment and respective year to make our style extremity measure comparable across styles, segments, and time. It equals one for the average fund.
We run pooled OLS-regressions and use the respective risk measure as dependent variable:
, , 1 , 1 2 , 3 ,
1 , 2 , 3 , 4 , 5 , ,
ln( )
.
Duality
i t i t i t i t i t
Female MBA CFA PhD
i t i t i t i t i t i t
Risk D Size TO FA
D D D D Tenure
(2.2)
Our main independent variable is the duality dummy which equals one if the manager of a fund also serves as the chair of the board of directors of that fund in the respective year and zero otherwise. We add further variables to control for fund and manager characteristics. At the fund level, we use the logarithm of the fund’s lagged size, the fund’s yearly turnover ratio (TO), and the fund’s age (FA) as control variables in the regression. At the manager level, we use dummies to control for the manager’s gender and her educational degrees (MBA, CFA, and PhD). In addition, we use the manager’s industry tenure (measured in years) as a control variable. To control for any unobservable time or segment effects that could equally affect all funds in a given year or a particular market segment, respectively, we also include time and segment fixed effects in the regressions. Standard errors are clustered at the fund level.
Results are reported in Table 2.3.
Our results clearly support our first main hypothesis: Duality managers take much more risk than non-duality managers. The unsystematic risk of their portfolios is significantly (at 1%-level) higher. The difference of more than 1.3 percentage points is huge given that the total unsystematic risk of non-duality funds is only 3.9 percent (calculated in unreported analysis).
, , ,
, ,
1
| |
1 .
| |
k
S S
i t k t
S
i t N S S
j t k t
k j
EM N
(2.1)
Table 2.3: Managerial decisions
Unsystematic
risk
Stock concentration
Industry concentration
Active share Tracking error Style extremity
MKT SMB HML MOM
Duality 0.0131 *** 0.0116 *** 0.0249 * 0.1044 *** 0.0310 *** 0.6034 *** 0.3194 *** 0.2955 ** 0.3383 ***
(<0.001) (0.002) (0.082) (<0.001) (<0.001) (<0.001) (0.003) (0.012) (<0.001) Fund characteristics:
Ln(size) -0.0011 ** -0.0016 *** -0.0042 ** -0.0112 *** -0.0009 -0.0365 ** -0.0462 ** -0.0227 -0.0369 ***
(0.016) (<0.001) (0.019) (<0.001) (0.194) (0.046) (0.019) (0.101) (0.008)
Turnover 0.0055 *** 0.0042 ** 0.0117 ** 0.0059 0.0068 *** 0.1444 *** 0.1197 *** 0.1670 *** 0.1512 ***
(<0.001) (0.033) (0.013) (0.332) (<0.001) (0.002) (<0.001) (0.001) (<0.001)
Fund age 0.0001 0.0000 0.0000 -0.0003 -0.0000 -0.0005 0.0022 0.0010 0.0004
(0.216) (0.318) (0.795) (0.489) (0.748) (0.817) (0.292) (0.576) (0.807)
Manager characteristics:
Female -0.0036 -0.0003 -0.0030 -0.0001 -0.0065 ** -0.0365 0.0567 -0.1587 ** -0.0829
(0.105) (0.913) (0.839) (0.998) (0.028) (0.676) (0.536) (0.018) (0.301)
MBA 0.0012 -0.0031 * 0.0011 -0.0103 0.0026 -0.0455 0.1239 ** 0.0247 -0.0174
(0.387) (0.055) (0.888) (0.405) (0.333) (0.402) (0.027) (0.646) (0.727)
CFA 0.0015 -0.0009 -0.0037 0.0405 *** 0.0031 0.0648 0.0161 0.1151 ** 0.0335
(0.238) (0.563) (0.601) (0.002) (0.224) (0.215) (0.753) (0.027) (0.506)
PhD -0.0037 -0.0070 0.0085 -0.0518 * 0.0076 0.6185 -0.0273 0.1103 0.2333
(0.338) (0.122) (0.781) (0.053) (0.250) (0.417) (0.898) (0.666) (0.624)
Industry tenure -0.0001 0.0001 0.0006 0.0006 0.0001 0.0038 -0.0056 -0.0009 -0.0004
(0.275) (0.681) (0.449) (0.485) (0.647) (0.520) (0.245) (0.878) (0.930)
Observations 1,888 1,782 1,782 1,223 1,223 1,888 1,888 1,888 1,888
Adj. R2 0.427 0.226 0.786 0.383 0.473 0.092 0.045 0.047 0.060
(Continued)
Table 2.3: Continued
Notes: This table presents results from pooled OLS regressions based on model (2). In the various columns we use unsystematic risk, stock concentration, industry concentration, active share, tracking error, and style extremity as the dependent variable: (1) To measure the fund’s unsystematic risk, we first estimate for each fund in each year the Carhart (1997) four-factor model. We then compute the unsystematic risk as the standard deviation of the residuals from the regressions. (2) The stock concentration is measured as the sum of the squared portfolio weights for all stocks in each quarter. We then average the quarterly stock concentrations to come up with a yearly measure. (3) To measure the industry concentration, we follow Kacperczyk, Sialm, and Zheng (2005) and sort all stocks into ten industries and calculate the weight for a specific industry in a portfolio by summing up the portfolio weights of all stocks belonging to that industry. The sum of the squared industry weights (averaged across the quarters of a year) is our measure of industry concentration. (4) We use the active share und tracking error measures of Cremers and Petajisto (2009) and Petajisto (2013). (5) To quantify the style extremity we use the sensitivities (beta exposures) from the Carhart (1997) model regarding the four factors (market factor (MKT), size factor (SMB), value factor (HML), momentum factor (MOM)) to capture the fund’s investment style. We then follow the approach of Bär, Kempf, and Ruenzi (2011) and calculate an extremity measure in each year:
, ,
,
, ,
1
| |
1 | |
k
S S
i t k t
S
i t N S S
j t k t
k j
EM N
where S represents the investment style analyzed (MKT, SMB, HML, and MOM, respectively) and Nkgives the number of funds in a specific market segment k in a given year t.
To normalize the extremity measure, we divide it by the average style deviation in the corresponding market segment and respective year. Our main independent variable is the duality dummy which equals one if the fund’s manager also serves as the chair of the fund’s board of directors and zero otherwise. As fund control variables we use the logarithm of the fund’s lagged size (measured in millions USD), the fund’s yearly turnover ratio, and the fund’s age (measured in years). As manager control variables we use dummies to control for the manager’s gender and her educational degrees (MBA, CFA, and PhD) as well as the manager’s industry tenure (measured in years). In all regressions we include time fixed effects and segment fixed effects. Robust p-values of the regression coefficients in parentheses are based on standard errors clustered by fund. ***, **, and * denote statistical significance at the 1%-, 5%-, and 10%-level, respectively.
Duality managers take this risk by holding more concentrated portfolios, i.e., they take more bets on specific stocks and industries. The difference in stock (industry) concentration is significant at the 1% (10%)-level. Comparing the coefficient of the duality dummy (0.0116) with the average stock concentration measure for non-duality funds (0.0250) shows that the stock concentration of duality funds is almost 50 percent larger than the stock concentration of non-duality funds. The economic dimension can be illustrated with the following example:
A non-duality manager would achieve a stock concentration measure of 0.025 if she holds an equally weighted portfolio of 40 stocks. In contrast, the duality manager would have to hold only 27 stocks in her equally weighted portfolio to achieve the concentration measure of 0.037 ( 0.025 0.0116 ). The difference in industry concentration is less pronounced, but still economically significant. The average value for non-duality funds is 0.2790, meaning that the industry concentration of duality funds is about 10 percent larger than the industry concentration of non-duality funds.
Duality managers also deviate more from their benchmarks than non-duality managers.
They take higher active shares and tracking errors. Both differences are statistically significant at the 1%-level, but they are also very significant from an economic point of view.
Given the average level of active share (78.55%) and tracking error (5.84%) for non-duality funds, the coefficients for the duality dummy mean that the active share of duality funds is about 13% and the tracking error about 50% larger.
Finally, the results confirm that duality managers follow much more extreme investment styles than non-duality managers. The duality dummy is positive and significant at the 1%-level for three out of four styles (and at the 5%-level for HML). The size of the coefficient is also economically significant. This becomes clear when comparing the coefficients for the duality dummies with the average extremity measures for the non-duality group. The respective numbers are 0.91 for MKT, 0.95 for SMB, 0.96 for HML, and 0.95 for MOM. Thus, the extremity measure is more than 60 percent larger for duality funds than for non-duality funds when looking at the market factor MKT. Putting it differently, only 17%
percent of the non-duality managers take as extreme market risk as the average duality
manager (calculated in an unreported analysis). The differences are smaller for the other style
factors, but still remarkably high: The extremity measures are more than 30 percent larger for
duality funds than for non-duality funds when looking at the SMB, HML, and MOM factor,
respectively. Since the average style exposure hardly differs between duality and non-duality
funds (calculated in an unreported analysis), our results imply that duality managers take
extreme style bets in both directions. This means, for example, that some duality managers
take a huge amount of market risk while others avoid taking market risk. Some duality managers follow a pure momentum strategy by buying past winners while others do exactly the opposite and follow a contrarian strategy.
14Regarding the control variables, we find that a fund’s turnover ratio is positively related to a fund’s risk and fund size is negatively related to it, consistent with Chevalier and Ellison (1999b) and Bär, Kempf, and Ruenzi (2011). The other fund characteristics and all manager characteristics usually have no significant impact on the risk taking of fund managers.
Overall, the results of our analysis clearly support our first main hypothesis: Duality managers follow much more risky strategies than non-duality managers. They diversify to a lesser degree, are more willing to deviate from their benchmark, and follow more extreme strategies. Such a behavior is highly sensible since it allows duality managers to benefit from good outcomes by receiving bonus packages without bearing a high risk of being fired if the outcomes are bad.
2.4 Impact of duality on manager performance
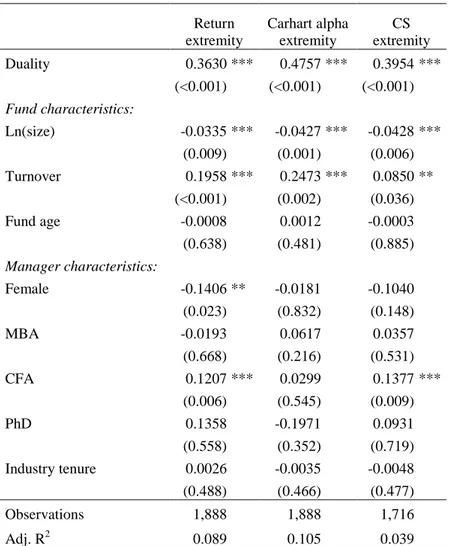
In this section, we analyze the effect of duality on the performance of managers. In Section 2.4.1 we test the second main hypothesis of our paper: Duality managers deliver worse performance than non-duality managers. Furthermore, we study an implication arising from our results in Table 2.3: Since duality managers follow more extreme investment styles, we expect them to deliver more extreme performance outcomes. We test this hypothesis in Section 2.4.2.
2.4.1 Level of performance
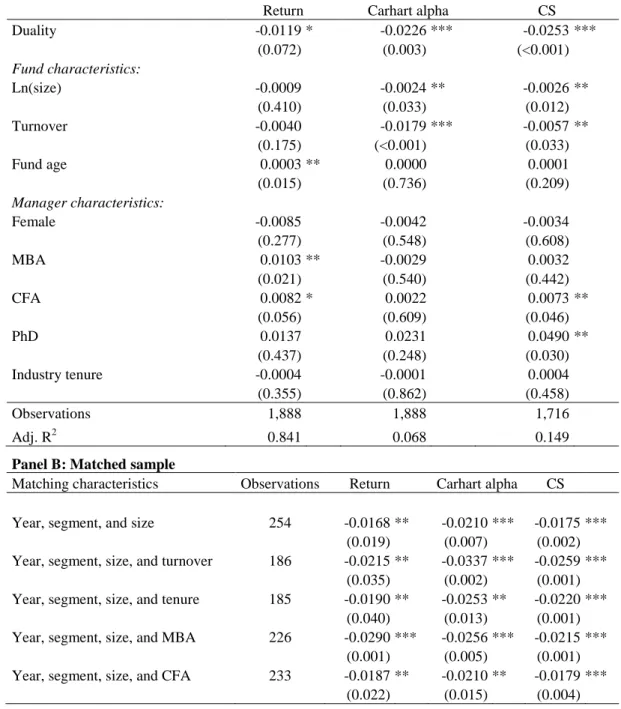
In this section we test our second main hypothesis: Duality funds perform worse than non-duality funds. We use three performance measures: (i) fund return, (ii) Carhart (1997) four-factor alpha, and (iii) the characteristic selectivity measure of Daniel, et al. (1997) which measures performance using holdings data of the fund.
15We compute the performance measures (i) and (ii) based on gross fund returns since gross returns measure better the quality of the investment decisions of the fund manager. To calculate a fund’s gross returns, we divide a fund’s yearly expense ratio by twelve and add it back to the fund’s monthly net return observations. By construction, the characteristic
14 Only the exposure to the size factor is significantly (at the 10%-level) larger for duality funds.
15The data on the characteristic benchmarks are taken from Russ Wermer’s website, http://www.rhsmith.umd.edu/faculty/rwermers/ftpsite/Dgtw/coverpage.htm.
selectivity measure (iii) is not influenced by a fund’s expense ratio and, thus, also measures the quality of the investment decisions of the manager.
The three performance measures differ with respect to their risk adjustment. The return measure is not adjusted for fund risk at all. The Carhart (1997) four-factor model is adjusted for risk using a linear factor structure, and the characteristic selectivity (CS) measure captures risk by benchmarking the fund with a characteristic-matched portfolio of stocks.
The Carhart (1997) alpha is the constant from the four-factor model, estimated as in Section 2.3. In our regressions, we use the annualized alpha. The CS measure for a fund in month is calculated as:
, 1 , ,
1
.
N
b
j j j
j
CS
w
r
r
(2.3)
, 1