Original Paper
Indoor and Built uilt
Environment
Indoor Built Environ 2013;22;4:669–677 Accepted: July 6, 2012Long-Term Trend of Indoor Volatile Organic Compounds – a 15-Year Follow-Up
Considering Real Living Conditions
Olf Herbarth
aSilke Matysik
baUniversity Leipzig, Faculty of Medicine, Environmental Medicine and Hygiene, Leipzig, Germany
bUniversity Hospital Regensburg, Institute of Clinical Chemistry and Laboratory Medicine, Regensburg, Germany
Key Words
Environmental medicineE HygieneEIndoor exposure ELong-term trendE VOCs
Abstract
Indoor volatile organic compounds (VOCs) may be associated with adverse health effects. The aim of this study was to investigate whether the indoor VOCs exposure burden has undergone changes during a past 15-year period, exemplarily in a German city. The study was limited to homes with families. To avoid possible regional-specific confounder effects, this assessment was conducted for this urban centre with a sufficiently long and continuous time series (1994–2008).
VOCs were determined using passive sampling over 4 weeks followed by liquid extraction and analysis with gas chromatography-mass spectrometry. All measure- ment periods were equally distributed over the seasons and years.
A substantial reduction in the total sum of VOCs and aromatics could be demonstrated as well as a trend of
decrease concentrations for alkanes. No such changes could be observed for cycloalkanes, chlorinated hydro- carbons and terpenes group.
Possible reasons for the reduction of indoor VOCs exposure are most likely due to the applied regulations/
guidelines for the VOCs reduction in indoor-relevant products. Problems are, however, regarding the slight increase in terpene exposure. These chemicals have been found to be associated with quite specific health effects. Therefore, future emphasis should be directed not only towards the general reduction of anthropo- genically generated VOC exposures in the outdoor environment but also on the reduction of health- relevant VOCs, especially indoors.
Introduction
During the last 20 years, epidemiologic investigations have shown associations between indoor exposure to volatile organic compounds (VOCs) and signs and symptoms of ill health [1–8]. Even cell experiments have
demonstrated effects of VOCs on cellular processes showing (pre)-pathologic propensities [9]. For this reason, VOCs have incurred a special importance in the regulation of indoor air quality.
The WHO, the EU as well as individual countries have already initiated steps to reduce the VOCs burden in populations (see among others References [10–13]).
Over the years, the associations of VOCs to ill health have been controversially discussed [14,15]; however, data are accumulating, showing that even small dosages may already account for these observed health effects [2,4,8].
The question is, therefore, has the VOCs indoor burden changed in any way, with regards to its concentration as well as in the proportion of its components compared to the total exposure. It is possible that any changes in the VOCs component profile could influence, in terms of positive or negative trends, the health relevance of the mixture. Furthermore, changes observed over longer periods of time indicate that components, possibly originating from products associated with the indoor burden, can be removed and replaced by others in the indoor environment. This may have implications for Public Health services, which would require surveillance programmes or to request product changes for building applications.
This paper presents the evaluation based on the VOCsum concentration. The VOCsum index is ideal for diverse regulatory sectors, especially as a general indicator for total VOCs in enclosed areas. The main importance of the index though is that it is derived from the average (and obviously reached) concentrations, exceedance of the index value would reveal evidence of an existing source.
However, this is critical in regards to the sampling and the analytical techniques. According to the European Working Group [16], the definition of the VOCs sum relates to those VOCs that are detected within one chromatographical window. These concepts are definitely applied sensibly in intervention studies or quality controls for product emissions. If VOCs are selectively measured and summed up, the proportion of individual constituents, contributing towards the VOCsum total concentration, could still vary. This is critical for the assessment of indoor environments, in case that the proportion of health relevant chemicals has increased over time.
On the one hand the assessment of the VOCsum is problematic. Those substances which are difficult to sample with conventional sampling techniques like reac- tive organic compounds, e.g., aldehydes or intermediary reaction products, are not covered. On the other hand long-term trend studies are useful in the assessment of the
indoor VOCs burden to produce an overview about the time trend of a single VOC which contribute predomi- nantly to VOCsum. This fact is of importance especially for those components that are covered in routine analyses being carried out by local health departments. To reveal contributions of indoor VOCs to health disorders, investigations were directed to assess indoor air exposure by means of measurement of a standard mixture of VOCs.
This standard mixture is based on a mixture proposed by Molhave, Bach, and Pedersen [17] to control the indoor air environment. It has to be assumed that a single VOC as a part of this mixture can change their proportion over several years.
Considering these facts, the aim of this study was to find out whether the absolute concentration of different VOC groups and the relative ratio between VOC groups have undergone changes over a past 15-year period.
It should be pointed out explicitly that the presented paper only deals with the description of the VOCs exposure and not with resulting health effects. Because of the complexity it is necessary to deal with the health association in a separate paper.
Materials and Methods
Design
As a part of several epidemiologic studies (studies described for example in References [18–20]), among other investigations, VOCs were measured in the participants’
residences in order to clarify association issues between exposure and ill health.
The studies were approved by the ethics committee of the University of Leipzig.
For the here presented analyses, only measurements were considered which pertain to the study population and their residences in the city of Leipzig. There were 4725 participants involved in the study. From this population in total, 2679 individual measurements were performed over a time span of 15 years, starting 1994 to 2008.
The basis for the here presented data are these different longitudinal epidemiological cohort studies starting with the participants births. As mentioned, one of the aims of these studies was to find out whether the indoor environment can contribute to ‘‘negative’’ health out- comes. Within the spectra of the investigated indoor load, VOCs were determined.
The participants respectively the parents of the parti- cipating children received a passive sampler, which was exposed in the room of the apartment/house in which the
participant spent most of their time during a day. As a rule, this room should be the children’s bedroom or the living room of the family (the parents provided the information regarding the room in the epidemiological questionnaire). The passive sampling system was exposed at the first time around the birth and in the following years (with interruptions – not every year) around the birthday of the children. The children were recruited at the beginning of their birth. The time of recruitment was, dependent on the study, 1 or 2 years. Since the birthdays are equally distributed over the year, the measurement times were also equally distributed over the year. That means, no season would be over-represented.
Furthermore, since the exposure time was 4 weeks, peak loads would not be of significance.
The number of samples per home was different and depended on the participation duration in the study. As a rule, one to three samples per apartment/house were obtained during any sampling occasion over the investiga- tion period.
Table 1 presents the number of measurements taken in each corresponding year. These indoor measurements were taken randomly among the participating families.
Since the number of study participants was different for the different studies and since in some periods two studies have been overlapped, the total sample size per year was different.
Sampling
All measurements were taken using passive samplers [21]. The passive sampling method has the advantage to record a mean load over a sampling period of 28 days and from that point of view this method avoids short-time peaks (spikes). This is an advantage since short-time measurements would assess the VOC exposure in a very small time window and are therefore not as representative as long-term passive measurements. The applicability of passive air sampling for VOCs assessment has been validated sufficiently in the literature [22–26].
The passive samplers were deposited for 4 weeks in the participants’ residences in those rooms in which the family spent most of its time. As a rule, one sampler per family home was installed.
The passive sampling of a longer time span (4 weeks) would give a more representative overview about the indoor air VOCs composition as compared to the short- time active measurement which could be affected by specific activities during the time of measurements.
Based on previous experiments of measuring maximal concentrations, saturation of the samplers by the passive sampling could be ruled out. All sampling periods were distributed equally over the months of all years.
The reproducibility, linearity, ranges and sensitivity of passive sampling up to 12 weeks followed by liquid extraction has been positively evaluated by Shields and Weschler [27]. Our studies also show evidence that passive sampling is applicable at ambient concentrations [25,26].
The focus of this paper is based on the time trend over the years. The design of the epidemiological studies on which the presented data are based should ensure that all types of houses or flats are similarly distributed, which means that the resulting mean or quartile for each random sample would not be influenced by the composition of the sample in any different way.
Again, the main aim of the study was to show the general trend of the measured VOCs independently from types of houses, interiors, activities etc. This is possible because of the very large number of measurements.
Analysis
Briefly, the VOC-coated active charcoal layer of the 3 M passive sampler was extracted with 1.5 mL carbon disulphide (for details see References [25,26,28]). The 30- min extraction time was followed by a quantitative VOC analysis using the capillary gas chromatography (Autosystem-Gas Chromatography, Perkin Elmer, Flame ionisation detector (FID)/Electron capture detector (ECD)):
– capillary columns Polyphenylmethylsiloxane (PVMS/
54), Dimethylsiloxane (DMS), 50 m, ID (internal diameter)¼0.32 mm, layer thickness 1 m
– carrier gas nitrogen, 14.5 psi – injection volume 2 L, split 1:10
– temperature 408C (program 2 K min1to 1508C) A five-point calibration function was determined for several identified components based on the integrated FID
Table 1. Number of measurements for each measurement year
Year 1994 1995 1997 1998 1999 2000 2001 2004 2007 2008
N 88 266 158 286 287 100 556 377 312 249
N: As a rule every number stands for one home.
signal area. This calibration function was used to determine the VOC mass adsorbed on the charcoal layer.
The average concentration over the sampling interval was then calculated for each component (in mg m3) in accordance with equation (1) adopted from the 3 M Application Bulletin [21].
c¼mA
tr ð1Þ
where m¼the absolute mass amount of the adsorbed component (in mg), t¼the sampling interval (in min), r¼the recovery coefficient andA¼a constant.
‘‘A’’ includes the diffusion coefficient of the com- ponent, the diffusion area of the charcoal pad and the diffusion distance inside the sampler. For some com- ponents, the constant A was adopted from a list published in the 3 M Application Bulletin [21]. For any not listed compound, the diffusion constants were calculated according to a procedure proposed by Pannwitz [29].
0 50 100 150 200 250 300 350
1994 1995 1996 1997 1998 1999 2000 2001 2002 2003 2004 2005 2006 2007 2008
c [µg/m³]
Fig. 1.Temporal course of the VOCsum – concentration 1994–2008 (þ/95% CI SEM) (SEM – standard error of mean).
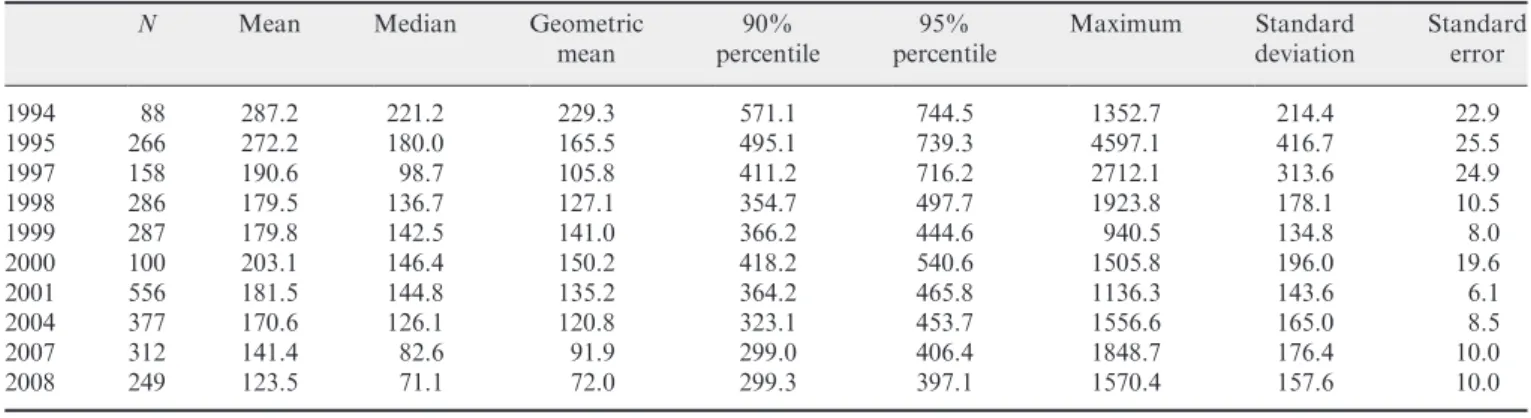
Table 3. Sum concentrations of all VOCs (VOCsum) (mg m3)
N Mean Median Geometric
mean
90%
percentile
95%
percentile
Maximum Standard deviation
Standard error
1994 88 287.2 221.2 229.3 571.1 744.5 1352.7 214.4 22.9
1995 266 272.2 180.0 165.5 495.1 739.3 4597.1 416.7 25.5
1997 158 190.6 98.7 105.8 411.2 716.2 2712.1 313.6 24.9
1998 286 179.5 136.7 127.1 354.7 497.7 1923.8 178.1 10.5
1999 287 179.8 142.5 141.0 366.2 444.6 940.5 134.8 8.0
2000 100 203.1 146.4 150.2 418.2 540.6 1505.8 196.0 19.6
2001 556 181.5 144.8 135.2 364.2 465.8 1136.3 143.6 6.1
2004 377 170.6 126.1 120.8 323.1 453.7 1556.6 165.0 8.5
2007 312 141.4 82.6 91.9 299.0 406.4 1848.7 176.4 10.0
2008 249 123.5 71.1 72.0 299.3 397.1 1570.4 157.6 10.0
VOCs: volatile organic compounds.
Table 2. Volatile organic compounds measured in all measurement campaigns
Alkanes Heptane, octane, nonane, decane, undecane, dodecane, tridecane Cycloalkanes Methylcyclopentane, cyclohexane, methylcyclohexane
Aromatics Benzene, toluene, ethylbenzene, mþp-, o-xylene, styrene, 2-, 3-, 4-ethyltoluene Chlorinated hydrocarbons Chlorbenzene, trichlorethylene, tetrachlorethylene
Terpenes a- andb-pinene, 2- and 3-carene, limonene
The detection limit of the investigated components was between 0.1 and 1mg m3.
Depending on the respective measurement campaign, a varied number of VOC components were measured. At present, a total of 87 individual components can definitely be determined. For the here presented assessment and for reason of comparability, only those 26 components are included in the analyses, which were measured in every campaign and for which a complete set of data was available (Table 2).
Statistical Analyses
The statistical analyses were conducted using Statistica [30] and Excel [31].
Descriptive statistics are presented as (arithmetic) means and standard deviations and absolute numbers (sample sizes) and (relative) frequencies.
The trend was calculated using the Mann-Kendall- test. This test is a non-parametric test and examines the signs of pair-wise differences of the VOC time series.
0 40 80 120
1994 1995 1996 1997 1998 1999 2000 2001 2002 2003 2004 2005 2006 2007 2008 1994 1995 1996 1997 1998 1999 2000 2001 2002 2003 2004 2005 2006 2007 2008 1994 1995 1996 1997 1998 1999 2000 2001 2002 2003 2004 2005 2006 2007 2008 1994 1995 1996 1997 1998 1999 2000 2001 2002 2003 2004 2005 2006 2007 2008 1994 1995 1996 1997 1998 1999 2000 2001 2002 2003 2004 2005 2006 2007 2008
terpenes chlorinated hydrocarbons
aromatics cycloalkanes
alkanes
c [µg/m³]
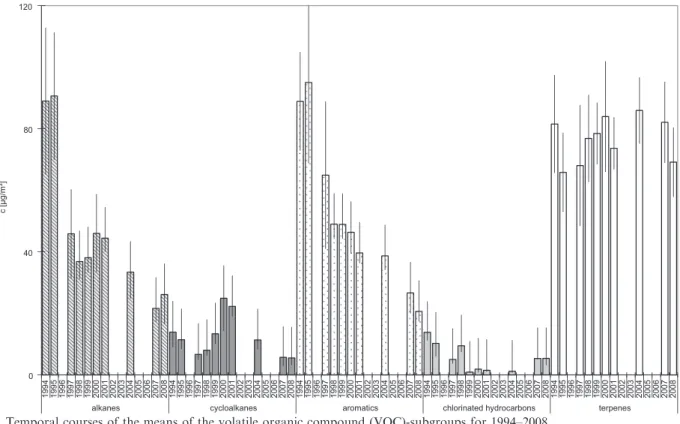
Fig. 2. Temporal courses of the means of the volatile organic compound (VOC)-subgroups for 1994–2008.
Table 4. Thep-values for the temporal trend of the individual VOC components (bold: significantp50.05; bold in italics: trend significant p50.10; Mann-Kendall trend test)
Alkanes p Cycloalkanes p Terpenes p Aromatics p
Hexane 0.22 Methylcyclopentane 0.58 a-pinene 0.79 Benzene 0.06
Heptane 0.31 Cyclohexane 0.31 b-pinene 0.32 Toluene 0.02
Octane 0.06 Methylcyclohexane 0.31 2-carene 0.46 Ethylbenzene 0.09
Nonane 0.06 3-carene 0.69 mþp-xylene 0.06
Decane 0.08 Chlorinated HC limonene 0.11 o-xylene 0.03
Undecane 0.06 Chlorbenzene 0.54 Styrene 0.20
Dodecane 0.16 Trichlorethylene 0.06 2-ethyltoluene 0.16
Tridecane 0.11 Tetrachlorethylene 0.03 3-ethyltoluene 0.03
4-ethyltoluene 0.13 VOCs: volatile organic compounds; HC: hydrocarbons.
Results
Concentration Trends (Absolute)
Using the measured concentration data obtained in the different years, the sum concentrations (VOCsum) of all VOCs (listed in Table 2) were calculated and are presented in Table 3. The bases for the calculations are the detected sum concentrations of each individual residence for each measurement year. Figure 1 depicts the temporal course of the VOCsum concentration during the years 1994 to 2008.
The time trend was tested using the Mann-Kendall trend test. A significant trend seems to exist if thep50.05.
The Mann-Kendall trend test shows the temporal changes of the decrease for all VOCs (VOCsum) (p¼0.05) and the group of aromatics (p¼0.02), as well as a demonstrable trend of a reduction for the group of alkanes (p¼0.08).
The group of cycloalkanes, chlorinated hydrocarbons and terpenes do not indicate any time-dependent trend change (Figure 2). Figure 2 shows the temporal course of those listed VOC groups presented in Table 2. Table 4 shows the p-values of the individual VOCs.
Additional to the trend of VOCsum within the groups of VOCs such as alkanes, aromatics etc., the individual substances were differentiated to show contribution to the respective chemical groups. Table 4 shows for which single compounds within the groups of VOCs, a time trend can be observed. The trend was calculated using the Mann- Kendall trend test. If the p-value is lower than 0.05, it can
be assumed that the single VOC would show a time trend which is significant over the years.
Trends of the Concentrations of the Proportional Compounds (Relative)
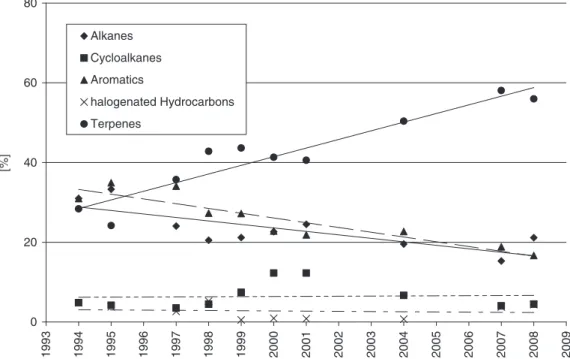
With a generally decreasing exposure burden in the temporal course, the proportion of individual substances on the total burden shows a clear shift. While the proportions of the alkanes and aromatics appear to decrease, the terpenes’ proportion on this burden showed an increasing trend (Figure 3).
Assuming simplistically a linear function course, the decrease of the alkane group would amount to about 4.1mg m3, for the cycloalkanes 0.4mg m3, the aro- matics about 4.7mg m3 and the chlorinated hydrocar- bons around0.5mg m3per year, whereas an increase of þ0.3mg m3 per year was found for the terpenes.
Assuming a significance of p¼0.05 with a correlation coefficient differing from 0, only the given trends for the alkanes and aromatics were found to be significant.
Discussion and Conclusion
Indoor-VOCs can play an important role in the assessment of potential health effects associated with an indoor air pollution burden. For this reason, it is essential to be aware of any changes in VOC profiles and to follow their trend analyses and assess the percentages of the 0
20 40 60 80
1993 1994 1995 1996 1997 1998 1999 2000 2001 2002 2003 2004 2005 2006 2007 2008 2009
[%]
Alkanes Cycloalkanes Aromatics
halogenated Hydrocarbons Terpenes
Fig. 3.Changes in the proportion (%) of constituents on the sum VOC-burden for the years 1994–2008.
individual compounds. These steps would allow regula- tion, setting of standards and implementations of pre- ventive measures.
This study indicates that over the past 15 years (1994 to 2008), clear trends could be observed towards changes in the portion of 26 VOCs under investigation within these chemical ‘‘mixtures.’’ Judging from that, one can assume that variations in the composition may derive different symptoms and also a difference in the prevalence of symptoms.
The presented results show a clear reduction in the sum of all VOCs, the alkanes and aromatics, while the burden of cyclo-alkanes and chlorinated hydrocarbons remained constant and that of the terpenes increased slightly (not significantly). In 2008, the sum concentration was only half of the 1994 concentration. This reduction was caused by a decrease in alkanes and aromatics concentrations. In fact, the sum reduction corresponded almost exactly with the balance change of the VOC sum. The reduction in the VOCsum concentration and the almost constant concen- tration of terpenes had led to a higher proportion of terpenes.
What are the potential reasons for these changes especially of the decreasing trend of VOCsum respectively for the VOC mixtures?
. All in all, contributing clearly to the reduction is the growing utilization of indoor materials with low VOCs content. Beginning in the mid-1990, solvents with a low boiling point generally used in the commercial/indus- trial production of lacquers and paints, were replaced by glycols and higher alkanes, which do not fall under the definition of solvents (boiling point52008C). What we see clearly is a decline of ‘‘classical’’ solvents.
Possibly also due to other regulations, recommenda- tions and voluntary limitations by the industry have also contributed to the observed effects.
The appearance of other chemical substances in indoor air exposure, e.g., long chain alkanes, branched alkanes or glycols, was not investigated. There are hints in the integrated chromatograms of higher amounts of C14- C16 alkanes. This remains a speculation until a broad epidemiological study has been carried out.
. Taking the individual constituents into consideration, the greatest contribution stems from toluene and the higher alkanes. A regulation for toluene was established in Germany, in 1996 [32]. Following that in 1997, toluene showed an immediate reduction by 60mg m3 down to 23mg m3 as compared to 1995/96. The subsequent decrease of 8mg m3 (from 23mg m3 to
15mg m3; the mean between 1999 and 2008) was much less spectacular.
. Moreover, it may be assumed that the additives to the solvents for indoor paints and lacquers including glues (e.g., floor coverings) have undergone changes in their composition.
. It is also possible that the various epidemiological studies, which have drawn the attention to the VOC- associated adverse health effects, and the subsequent information dissemination to the parents of the children who participated in these studies, contributed to a more careful handling in the use of VOC-containing prod- ucts. The first of these information events for parents took place in 1996, following the partial analysis of the first study [18]
While ‘‘classical’’ solvents based on their high volatility contributed not longer than a few days or weeks to the indoor VOC exposure burden [28], products, labelled as solvent-free, which contain compounds with a higher boiling point (42008C), can possibly emit these into the indoor air for months or even years. For this reason, critical inspection is required and the profile of the indoor exposure burden would need to be looked upon analyti- cally and methodologically in a new and more detailed way. Moreover, based on these presented data, it is suggested that there is a definite need for standards to be set and processes to be developed, which enable an assessment of the building materials as well, in order to detect the sources of VOC emittants with health consequences.
Some limitations of the study are:
– It cannot be excluded that other than the measured VOCs could show a different trend. The selection was based on the requirement to be comparable with other studies that focussed on the same or similar selection of VOCs [25,26]. Furthermore, the complete time series could only be generated for the considered 26 VOCs;
– The different sample size per year during the study period. This may lead to different levels of signifi- cance but can be neglected since the sample size in all cases was higher than 100 except 1994 (see Table 1).
The variation in the sample size was unavoidable since the number of measurements was dependent on different epidemiological studies with different designs;
– It is impossible to control the resulting bias regarding the influence of the dissemination of study results in
the past. A main aim of the epidemiological studies in the past was to communicate to the health offices and to the public in order to prevent allergies: Which activities should the parents avoid? It can be assumed that some parents applied the imparted recommenda- tions. This may have affected the overall VOCs assessment in later years. Important information in this context is to avoid renovation activities during pregnancy and in the first years of life.
The main advantages of the presented investigations are:
– Compared with other studies, this study includes a very large number of measurements over a time period of 15 years. No time of year and/or type of apartment/house would be over represented due to the applied study design.
– The chosen measurement method – passive sampling over 4 weeks – ensures that activities and peak
concentrations generated by short-time emissions (e.g., of smoking, life style events such as burning of incense, etc.) would not influence the results in a significant way (short-term influence vs. long-term average).
To what extent the results may be transferable to other regions should be addressed by further studies.
Acknowledgements
Some parts of the studies were supported by the SMWK (Ministry of Science and Art of Saxony; grant-no 4-7531.50-03- UFZ/01 and 4-7541.83-UFZ/404 c).
The authors thank Ms. M. Rehwagen and Dr. T. Kohajda for their contribution to the experimental part of the study and the professional assistance rendered, as well as Ms. Winkler and Ms.
Fink for their technical help.
References
1 Mendell MJ: Indoor residential chemical emis- sions as risk factors for respiratory and allergic effects in children: a review: Indoor Air 2007;17(4):259–277.
2 Herbarth O, Fritz GJ, Rehwagen M, Richter M, Roeder S, Schlink U: Association between indoor renovation activities and eczema in early childhood: Int J Hyg Environ Health 2006;209:241–247.
3 Weschler CJ, Wells JR, Poppendieck D, Hubbard H, Pearce TA: Workgroup report:
indoor chemistry and health: Environ Health Perspect 2006;114(3):442–446.
4 Sherriff A, Farrow A, Golding J, Henderson J:
Frequent use of chemical household products is associated with persistent wheezing in pre- school age children: Thorax 2005;60(1):45–49.
5 Jaakkola JJ, Parise H, Kislitsin V, Lebedeva NI, Spengler JD: Asthma, wheezing, and allergies in Russian schoolchildren in relation to new sur- face materials in the home: Am J Public Health 2004;94(4):560–562.
6 Rumchev K, Spickett J, Bulsara M, Phillips M, Stick S: Association of domestic exposure to volatile organic compounds with asthma in young children: Thorax 2004;59(9):746–751.
7 Wolkoff P, Nielsen GD: Organic chemicals in indoor air – their relevance for indoor air quality: Atmos Environ 2001;35:4404–4417.
8 Andersson K, Bakke JV, Bjorseth O, Bornehag CG, Clausen G, Hongslo JK, Kjellmann M, Kjaergaard S, Levy F, Molhave L, Skerfving S, Sundell J: TVOC and health in non- industrial indoor environments: Indoor Air 1997;7:78–91.
9 Wichmann G, Mu¨hlenberg J, Fischa¨der G, Kulla C, Rehwagen M, Herbarth O, Lehmann I: An experimental model for the determination of immunomodulating effects by volatile com- pounds: Toxicol In Vitro 2005;19:685–693.
10 WHO Media centre: Indoor air pollution and health, Fact sheet No 292, 2011. Available at:
http://www.who.int/mediacentre/factsheets/
fs292/en/index.html (accessed July 24, 2012).
11 WHO: WHO Guidelines for Indoor Air Quality: Selected Pollutants. Geneva, WHO Regional Office for Europe, 2010.
12 Scientific Committee on Health and Environmental Risks, SCHER: Opinion on risk assessment on indoor air quality.
European Commission, Health & Protection Directorate-General, 17th plenary, May 29, 2007. Available at: http://ec.europa.eu/health/
archive/ph_risk/committees/04_scher/docs/
scher_o_055.pdf (accessed July 24, 2012).
13 Wolkoff P: Trends in Europe to reduce the indoor air pollution of VOCs: Indoor Air 2003;13(Suppl. 6):5–11.
14 Nielsen GD, Larsen ST, Olsen O, Løvik M, Poulsen LK, Glue C, Wolkoff P: Do indoor chemicals promote development of airway allergy? Indoor Air 2007;17:236–255.
15 Wolkoff P, Clausen PA, Jensen B, Nielsen GD, Wilkins CK: Are we measuring the relevant indoor pollutants? Indoor Air 1997;7:92–106.
16 European Collaborative Action (ECA-IAQ):
Total Volatile Organic Compounds (TVOC) in Indoor Air Quality Investigations. Brussels, Report No.19, EUR 17675 EN, European Commission, Joint Research Centre, Environment Institute, 1997.
17 Molhave L, Bach B, Pedersen OF: Human reactions to low concentrations of volatile organic compounds: Environ Int 1986;12:167–175.
18 Herbarth O, Fritz GJ, Behler JC, Rehwagen M, Puliafito JL, Richter M, Schlink U, Sernaglia J, Puliafito E, Puliafito C, Schilde M, Wildfu¨hr W: Epidemiologic risk analysis of environmentally attributed exposure on air
way diseases and allergies in children: Centre Eur J Public Health 1999;7(2):72–76.
19 Diez U, Kroessner T, Rehwagen M, Richter M, Wetzig H, Schulz R, Borte M, Metzner G, Krumbiegel P, Herbarth O: Effect of indoor painting and smoking on airway symptoms in atopy risk children in the first year of life – results of the LARS-study: Int J Hyg Environ Health 2000;203:23–28.
20 Herbarth O: Allergien im Kindesalter/
Epidemiology of air pollution associated aller- gies in children: Bundesgesundheitsbl 2003;46:732–738.
21 3M Technical Data Bulletin: Organic vapor monitor, sampling and analysis guide: 3 M diffusion monitors 500/3510/3520/3530 storage and recovery. Occupat Health Environ Safety Div (OH & ESD) 1996;1028:1–11.
22 Bates M, Gonzalez-Flesca N, Cocheo V, Sokhi R: Ambient volatile organic compounds mon- itoring by diffusive sampling. Compatibility of high uptake rate samplers with thermal deso- rption: Analyst 1997;122:1481–1484.
23 Kot-Wasik A, Zabiegala B, Urbanowicz M, Dominiak E, Wasik A, Namiesnik J: Advances in passive sampling in environmental studies:
Anal Chim Acta 2007;602:141–163.
24 Minoia C, Meroni G, Aprea C, Oppezzo MC, Magnaghi S, Sciarra G, Barisano A, Fiorentino ML, Berri A, Bellinzona M, Robustelli della Cuna FS, Frigerio F, Schiavi A, Di Gregorio L: Environmental and urinary reference values as markers of exposure to hydrocarbons in urban areas: Sci Total Environ 1996;192:163–182.
25 Rehwagen M, Schlink U, Herbarth O:
Seasonal cycle of VOCs in apartments:
Indoor Air 2003;13:283–291.
26 Schlink U, Rehwagen M, Damm M, Richter M, Borte M, Herbarth O: Seasonal cycle of
indoor-VOCs: comparison of apartments and cities: Atmos Environ 2004;38:1181–1190.
27 Shields HC, Weschler CJ: Analysis of ambient concentrations of organic vapors with a passive sampler: J Air Pollution Control Assoc 1987;37:1039–1045.
28 Herbarth O, Matysik S: Decreasing concentra- tions of volatile organic compound (VOC) emitted following home renovations: Indoor Air 2010;20:141–146.
29 Pannwitz KH: Draeger Probenahmehandbuch.
Luebeck, Draeger AG, 1991.
30 StatSoft Inc.: STATISTICA fu¨r Windows [Software-System fu¨r Datenanalyse] Version 7.1., 2005. Available at: www.statsoft.com (accessed July 24, 2012).
31 MicrosoftÕ Office Excel 2003. Microsoft Corporation Edition 2003
32 Ad-hoc-AG: Ad-hoc-Arbeitsgruppe der Innenraumlufthygiene-Kommission des
Umweltbundesamtes und der Obersten Landesgesundheitsbeho¨rden: Beurteilung von Innenraumluftkontaminationen mittels Referenz- und Richtwerten. Evaluation of indoor air contaminants by means of reference and guideline values. Bundesgesundheitsbl 2007;50:990–1005. Doi 10.1007/s00103-007- 0290-y.