eas and academic debate. orking Papers series does not constitute publication and should not limit publication in any other venue. Copyright remains with the authors.
GIGA Research Programme:
Socio-Economic Challenges in the Context of Globalisation
__________________________
Resource Scarcity, Spite and Cooperation
Sebastian Prediger, Björn Vollan and Benedikt Herrmann
No 227 June 2013
Edited by the
GIGA German Institute of Global and Area Studies Leibniz‐Institut für Globale und Regionale Studien
The GIGA Working Papers series serves to disseminate the research results of work in progress prior to publication in order to encourage the exchange of ideas and academic debate. An objective of the series is to get the findings out quickly, even if the presenta‐
tions are less than fully polished. Inclusion of a paper in the GIGA Working Papers series does not constitute publication and should not limit publication in any other venue. Copy‐
right remains with the authors. When working papers are eventually accepted by or pub‐
lished in a journal or book, the correct citation reference and, if possible, the corresponding link will then be included on the GIGA Working Papers website at
<www.giga‐hamburg.de/workingpapers>.
GIGA Research Programme “Socio‐Economic Challenges in the Context of Globalisation”
Copyright for this issue: © Sebastian Prediger, Björn Vollan and Benedikt Herrmann WP Coordination and English‐language Copy Editing: Errol Bailey
Editorial Assistance and Production: Silvia Bücke
All GIGA Working Papers are available online and free of charge on the website
<www.giga‐hamburg.de/workingpapers>.
For any requests please contact:
E‐mail: <workingpapers@giga‐hamburg.de>
The GIGA German Institute of Global and Area Studies cannot be held responsible for errors or any consequences arising from the use of information contained in this Working Paper; the views and opinions expressed are solely those of the author or authors and do not necessarily reflect those of the Institute.
GIGA German Institute of Global and Area Studies Leibniz‐Institut für Globale und Regionale Studien Neuer Jungfernstieg 21
20354 Hamburg Germany
E‐mail: <info@giga‐hamburg.de>
Website: <www.giga‐hamburg.de>
Abstract
Using an experimental approach, this paper examines how scarcity of natural resources af‐
fects people’s readiness to cooperate or engage in antisocial behavior. The experiments were carried out with pastoralists from southern Namibia, whose livelihoods greatly de‐
pend on grazing availability on collectively used rangelands. We split the study region in‐
to two areas according to exogenous differences in biomass production (a high‐yield and a low‐yield area) and conducted a one‐shot public goods experiment and a joy‐of‐de‐
struction experiment with pastoralists from both areas. Results from the joy‐of‐destruction experiment reveal that a substantial proportion of people are willing to reduce another subject’s income, although this comes at a personal cost. We show that this kind of spiteful behavior occurs twice as often in the area where resources are scarcer and hence competi‐
tive pressure is higher. By contrast, levels of cooperation are very similar across areas. This indicates that scarcity does not hamper cooperation, at least as long as a subsurvival level has not been exceeded. Our data further reveal a coexistence of prosocial and antisocial behavior within individuals, suggesting that people’s motivations depend on the experi‐
mental environment they are acting in. One possible explanation is that subjects are ready to cooperate when substantial net gains can be realized, but turn into spiteful money burners when there is no scope for efficiency improvements and the risk of “falling be‐
hind” is particularly salient.
Keywords: competition, natural resource scarcity, antisocial behavior, cooperation, spite, Namibia, lab‐in‐the‐field experiment
JEL: C71, C72, C91, D03, H41, Q24
Dr. Sebastian Prediger
is a research fellow at the GIGA Institute of African Affairs. His main research deals with cooperation and social preferences, management of common‐pool resources, and the in‐
formal sector.
Contact: <sebastian.prediger@giga‐hamburg.de>
Website: <http://staff.en.giga‐hamburg.de/prediger>
Dr. Björn Vollan
is a researcher at the Department of Public Finance, Faculty of Economics and Statistics at the University of Innsbruck.
Contact: <bjoern.vollan@uibk.ac.at>
and Consumer Protection and is an external research fellow at the Centre for Decision Re‐
search and Experimental Economics (CeDEx) at the University of Nottingham.
Contact: <benedikt.herrmann@gmail.com>
Sebastian Prediger, Björn Vollan and Benedikt Herrmann
Article Outline 1 Introduction
2 Description of the Study Site
3 Experimental Design and Procedures 4 Conjectures
5 Results 6 Discussion 7 Conclusion References
1 Introduction
The depletion of natural resources is a key challenge of the twenty‐first century. An inescap‐
able consequence of increasing resource scarcity is the intensification of competition among affected resource users. Using the exogenous variation in real‐life resource scarcity as a proxy for differences in the intensity of competition, this paper1 investigates experimentally
1 We thank Richard Isaacks for his great field assistance and all participants for their time and hospitality. We are grateful to Celeste Espach (Namibian Ministry of Agriculture, Forestry and Water) for providing us with data and maps on seasonal biomass production in the study region and to Thimo Hangula (National Planning Commission, Namibia) for providing us with population data for the study region. Many thanks also go to Leon Lubbe, Anton Losper (both Namibian Ministry of Agriculture, Forestry and Water), Karl Eiseb and Six‐
tus Isaacks (both Rural Water Supply Keetmanshoop) for sharing their profound knowledge about the local socio‐economic and ecological condition with us. The paper greatly benefited from comments of Michael Baurmann, Esther Blanco, Carsten De Dreu, Sebastian Ferse, Renate Hartwig, Michael Kirk, Evelyn Korn, An‐
dreas Landmann, Alexander Libman, David Rand, Peter Richerson as well as participants of the 5th RGS Doc‐
toral Conference, PegNet Conference 2012, IMEBE Conference 2013, Exeter Workshop 2012, Innsbruck, Bre‐
men and Bielefeld. This research was part of the BIOTA Southern Africa Project funded by the German Feder‐
al Ministry of Education and Research (Commission number: 01 LC 0024A).
whether and how increased exposure to competition for scarce resources affects common‐
pool resource users’ behavior toward fellow resource users. In particular, our study aims to answer the following questions: Does resource scarcity trigger antisocial behavior? Does re‐
source scarcity undermine a subject’s willingness to engage in mutually beneficial coopera‐
tion? To address these questions, we conducted one‐shot experiments with pastoralists from southern Namibia, whose livelihoods greatly depend on grazing resources managed under common‐property regimes. Grazing resources are particularly interesting because they pro‐
duce a limited flow of resources, which creates rivalry for consumption, and thus illustrate the trade‐off between selfish profit maximization and mutual cooperation to sustain the re‐
source stock. Our study contributes to two related strands of literature that have so far either solely focused on the relationship between resource scarcity and cooperativeness, or on that between increased competition for scarce resources and antisocial or unethical behavior.2 The setup of our study is similar to that of Leibbrandt et al. (2011), who conducted a series of ex‐
periments with fishermen to investigate the effects of ecological peculiarities on behavior.
Resource scarcity implies competition. Economic theory typically considers competition as desirable. Competition facilitates the functioning of markets, improves efficiency and wel‐
fare, and may spur people to try harder. However, relatively little is known about the behav‐
ioral effects of competition. Recent studies demonstrate that competition may also motivate people to engage in inefficient, antisocial and/or unethical practices. Charness et al. (2011) and Balafoutas et al. (2012), for example, compare low competition with high competition and show that a more competitive environment can encourage people to sabotage the per‐
formance of others. Using the examples of – inter alia – excessive executive pay, employment of children and corruption, Shleifer (2004) illustrates that competition may undermine ethical behavior. Interestingly, censured behavior either reduces costs or raises revenues in all ex‐
amples he considers, and thus enhances economic efficiency. In his excellent study on witch killing in rural Tanzania, Miguel (2005) provides an extreme example of unethical (but again economically efficient) behavior in the face of increased resource scarcity and intrahousehold competition. He finds that natural disasters like floods or drought, resulting in crop failure and large income drops, lead to a significant increase in the murder of elderly (and less pro‐
ductive) women from poor households. Victims are accused of being witches and typically killed by relatives. Miguel (2005) points out that murderers in the Tanzanian study region do not have to fear social exclusion or stigmatization. Witch killing rather seems to be viewed as
2 While the link between resource scarcity and behavior at the micro level has so far received relatively little at‐
tention, there is a comprehensive body of literature on the relation between resource scarcity and violent con‐
flict at the macro level. Although plagued with problems of endogeneity, several studies have found a posi‐
tive relationship between scarcity and the onset of conflict (e.g. Brander and Taylor 1998; Homer‐Dixon 1999, 1991; Stalley 2003; Zhang et al. 2007, 2006).
a legitimate means to promote community welfare in times of extreme economic hardship.3 Similar to Miguel (2005), we also study the impact of increased competition for scarce re‐
sources on peoples’ readiness to engage in (a comparably innocuous kind of) antisocial be‐
havior. In contrast to his study, however, we propose a decontextualized experimental setup in which antisocial behavior cannot be driven by economic motives (such as personal materi‐
al gains or efficiency concerns) and is probably in conflict with social norms.
Our study further investigates the relationship between resource scarcity and cooperative behavior. There is no consensus among scholars regarding the impact of scarcity on coopera‐
tion. Some posit that collective action is more likely to emerge after resource users have ex‐
perienced substantial scarcity (Arnold, 1998; Ostrom et al., 1999), while others argue that scarcity may drive appropriative competition among users, leading to an even faster rate of exhaustion (Grossmann and Mendoza, 2003; Varghese et al., 2013). Experimental studies ex‐
amining the effect of induced scarcity on appropriation behavior have obtained mixed re‐
sults. Osés‐Eraso and Viladrich‐Grau (2007) studied university students’ extraction decisions in a common‐pool resource experiment under different resource allocations using a between‐
subjects design. They reported lower extraction levels (and hence higher levels of cooperation) in the event of scarcity; Rutte et al. (1987) obtained similar results. By contrast, Blanco et al.
(2012) obtained reversed results in a framed common‐pool resource experiment. They con‐
fronted Colombian watershed users with different levels of resource availability and found a higher occurrence of uncooperative behavior in the face of strong scarcity shocks. Our work distinguishes from these studies as we examine whether differences in the exposure to real‐
life resource scarcity affects cooperation behavior of resource users.
We use two one‐shot experiments to measure subjects’ behavior. The first experiment is the joy‐of‐destruction game (Abbink and Herrmann, 2011), also known as the maximizing‐
difference game (e.g. Halevy et al., 2012). The experiment is similar to the money burning experiments employed by Zizzo and Oswald (2001) and Kebede and Zizzo (2011), but it re‐
moves inequity aversion or envy as potential motives for money burning. In this two‐player game, a subject can decide to sacrifice income in order to lower another persons’ payoff be‐
low one’s own. The design is tailor‐made to identify the existence of antisocial preferences, which we understand (in reference to Abbink et al. (2010)) as a willingness to lower another person’s payoff below one’s own in the absence of motives of negative (sequential) reciproci‐
ty even if this comes at a cost to oneself. We also refer to this kind of attitude as “spite.” The second experiment is a standard linear public goods game (e.g. Fehr and Gächter, 2000) that resembles a typical social dilemma situation. In experimental economics, the public goods game is the classic method for the study of cooperation. We find a high incidence of antiso‐
cial behavior: One‐third of all subjects are willing to reduce a fellow resource users’ income
3 In the anthropological literature, Turnbull (1972) describes extreme individualistic practices among the Ik people in Uganda during a severe famine when scarcity of resources exceeded a subsurvival limit and result‐
ed in a breakup of mutual help and humanity.
at their own cost. Interestingly, antisocial behavior is twice as high in areas where grazing re‐
sources are scarcer and hence competition probably more intense. Yet, people’s willingness to cooperate does not seem to suffer from exposure to scarcity. Levels of cooperation are found to be similar across both areas, being slightly (but insignificantly) higher in the area where resources are scarcer. A within‐subject comparison further shows that people who be‐
have spitefully in the joy‐of‐destruction setup tend to be more cooperative in the public goods experiment.
2 Description of the Study Site
Our study was carried out in the communal lands of the Berseba constituency in the Karas region of southern Namibia. This area is situated within a semiarid biome and is almost ex‐
clusively populated by the Nama people, an indigenous ethnic group with a long tradition of pastoralism on commonly managed rangelands. Rainfall varies spatially and temporally in the study area, ranging from 50 to 290 mm per annum (Kuiper and Meadows, 2002). The semiarid conditions are not suitable for agriculture, and the majority of residents subsist on extensive livestock production.
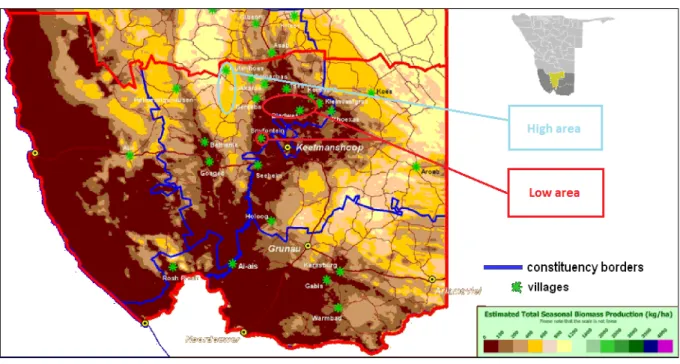
Figure 1: Map of estimated mean biomass production from 1985‐2007 in southern Namibia
The red line indicates the border of the Karas region. The blue lines mark constituency boundaries. The green stars are bigger settlements (e.g., Snyfontain); towns (e.g., Keetmanshoop) are marked by yellow circles.
Source: Based on Espach et al., Agro‐Ecological Zoning Programme, Ministry of Agriculture, Water and Forestry (MAWF), Windhoek (Namibia).
2.1 Measure for Resource Scarcity
Figure 1 shows the estimated average seasonal biomass production from 1985 to 2007 for the Karas region, measured in kilograms per hectare.4 The higher the biomass production, the more abundant are grazing resources. As depicted in Figure 1, biomass production varies spatially, ranging from less than 100 kg/ha up to 1,200 kg/ha. We split the study region into two areas according to their biomass production: (1) a high‐yield area of 400 kg/ha up to 800 kg/ha and (2) a low‐yield area of below 100 kg/ha. Locations situated in between (the light‐
brown area in Figure 1) were not considered in order to have a clear and considerable differ‐
ence regarding resource availability between the selected areas. Note that the biomass pro‐
duction figures reported in Figure 1 are averaged over the last 23 years. In cases of extreme climatic events, such as prolonged droughts, biomass production can deviate from that re‐
ported in Figure 1. Nevertheless, biomass production was always substantially higher in the high‐yield area than in the low‐yield area during the last 23 years. Moreover, in all but two seasons of serious drought (98/99 and 02/03), biomass production was well above 400 kg/ha in the high‐yield area and below 100 kg/ha in the low‐yield area. Devereux and Næraa (1996) calculated that during a severe drought in Namibia, 40 percent of small stock and 22 percent of cattle died. This resulted in a reduction of the median flock size of goats from 30 to 17 and of sheep from 26 to 18, thus leaving most flocks well below the considered minimum viabil‐
ity level of 30–35 head. Given less resource availability and smaller herd sizes in the low‐
yield area, farmers there are particularly vulnerable to droughts, which constitute a serious temporary threat to local livelihoods.
Of course, lower biomass production alone does not imply less resource availability per se: Resource availability also crucially depends on the number of users. According to our own calculations based on official census data conducted by the Namibian Planning Com‐
mission in 2001 (CBS, 2004), the population densities are 0.204 and 0.213 persons per km² in the high‐yield area and the low‐yield area, respectively.5 These figures show that per‐capita resource availability is indeed higher in the high‐yield area. This claim is substantiated by participants’ subjective perceptions about resource availability in their areas. As illustrated in Figure 2, 63 percent of the participants from the high‐yield area rate pasture quality and availability as either “good” or “very good.” This stands in stark contrast to the perceptions
4 The map was produced by Celeste Espach of the Ministry of Agriculture, Water and Forestry in Windhoek.
The seasonal biomass production was calculated from NOAA/AVHRR and SPOT/Vegetation satellite images, with the Satellite Monitoring of Arid Rangeland (SMAR) software based on the Monteith model.
5 For the calculations, we used the enumeration areas in which the locations we considered in our study were situated and divided the enumeration areas’ population by area size. Visited locations in the high‐yield area (low‐yield area) are scattered across an area of 4,235 (3,800) km² supporting a population of 868 (811) people.
We thank Thimo Hangula from the National Planning Commission for providing us with the data. For con‐
sistency checks, we consulted the local extension officers Anton Losper (Ministry of Agriculture, Water and Forestry), Karl Eiseb and Sixtus Isaacks (both Rural Water Supply Keetmanshoop) who operate in the study region. All of them guessed the population density to be lower in the high‐yield area.
of farmers from the low‐yield area, where only about 17 percent rate pasture quality as
“good” or “very good,” while more than half the sample was of the opinion that their pas‐
tures are of “poor” or “very poor” quality (Mann‐Whitney U test: Z = 5.59, p<.001, n=119).
Moreover, 46 percent of residents from the high‐yield area believe that the quality of their pastures is better than in most others in the communal lands of Berseba, while only 21 per‐
cent of residents from the low‐yield area were of this opinion – 52 percent said that the pas‐
ture quality is worse than in most other places (Z = 2.657, p < .01, n=100). To sum up, both ob‐
jective measures based on satellite images as well as resource users’ perceptions provide strong evidence that resources are much scarcer in the area we labeled as “low yield.”
Figure 2: Individual perceptions of pasture quality
The left‐hand and right‐hand side of Figure 2 illustrates the distribution of individual perceptions about pasture quality for low‐yield area and high‐yield area residents, respectively. N=119
Source: Author’s computation.
2.2 Exogeneity of Resource Scarcity in Our Study Area
It is crucial to establish an unambiguous direction of causality when studying the relation‐
ship between resource scarcity and behavior. One could reason that the differences in the availability of resources across areas are endogenous (i.e., the result of differences in the dis‐
tribution of “behavioral types”). In particular, one could assume that an adverse selection due to initial resource conditions or migration of behavioral types had taken place in the study area. For example, subjects with a higher inclination toward antisocial or selfish behav‐
ior may have settled in the low‐yield area, while more cooperative individuals may have set‐
tled in the high‐yield area. However, at least three aspects speak against this conjecture. First, the variation in biomass production between the areas can be attributed to different soil
0.1.2.3.4.5
very good good moderate poor very poor very good good moderate poor very poor
Low-yield area High-yield area
Fraction
types in the region and thus to geological peculiarities. For instance, biomass production is higher in the western part of the communal lands (the Swartrand terrain), which is character‐
ized by rocky grounds that ease water infiltration and plant growth. In contrast, the low‐
yield area east of Berseba (the beginning of the Witrand terrain) contains a different soil type that is seen to be less favorable for plant growth.6 Therefore, resource differences are not human made. Second, an adverse selection of preference types would have required substan‐
tial migratory movements between and within the areas in the past and present. However, there is no evidence of such movements. The communal rangelands have never been open‐
access resources, and although migration within the communal lands is generally possible, it largely depends on the affirmation of traditional authorities and (more recently) local water point associations (WPAs). The traditional authority has the customary right to allocate graz‐
ing lands to individuals (Republic of Namibia, 2000), while WPAs – which consist of local re‐
source users – have the formal right to grant or deny access to their water resources (Repub‐
lic of Namibia, 2004). Participants in our study confirm that migrants (mostly relatives of res‐
idents) have to ask permission before they can settle in a certain area. None of the places con‐
sidered in this study experienced migratory movements over the last ten years. Even in case of drought, farmers will continue to use their assigned grazing land and eventually sell some of their animals.7 Third, people in the high‐yield area possess more livestock. Therefore, if the resource stock were to react purely to grazing pressure, the high‐yield area would be quickly transformed to a low‐yield area. The higher average biomass production over the last 23 years clearly speaks against this conjecture. Hence, differences in resource availability must be assumed exogenous.
2.3 Socioeconomic Background
In social psychology and sociology, it is long established that personal identities emerge in society and are reflective of society (Stryker, 1980). Scholars in economics (e.g. Potetee et al., 2010; Vollan and Ostrom, 2010) have only recently begun to emphasize the relevance of mi‐
cro‐ and broader contextual factors for understanding behavioral differences across groups and individuals. In particular, it has been shown that culture‐specific norms resulting from different economic, political and social backgrounds can affect behavior in a systematic way
6 Pers. com. with Anton Losper, extension officer from the Ministry of Agriculture, Water and Forestry (5th Oc‐
tober 2009). This is also in line with the perception of our participants, of whom 69 percent were of the opinion that quality is better in the Swartrand terrain than in the Witrand area; only 9 percent were of the opposite opinion. The remainder thought there was no difference between the areas.
7 A questionnaire issued in the low‐yield area in 2006 exemplifies this. People were asked “Remember the last time when most of the fodder in your normal grazing area was already consumed. What did you do?” (multi‐
ple answers possible). The first choice for 11 out of 13 farmers was to continue in their assigned grazing area, while 2 farmers said that they would ask someone. Their second choices were to buy fodder (n=4), sell animals (n=4) or call a meeting (n=1). Nobody stated to move the animals elsewhere.
(e.g. Henrich et al. 2001; Herrmann et al. 2008; Ockenfels and Weimann 1999). Hence, in or‐
der to attribute potential differences in behavior between residents in the low‐yield and high‐yield areas to the variation in resource availability and competitive pressure, we had to ensure that other important contextual factors – such as cultural, institutional, political or re‐
ligious backgrounds – are very similar across both areas. The study region fulfills this pre‐
condition: All 120 participants are ethnic Nama, speak Nama, reside in the same constituency, and follow Christianity. Inter‐ and intragroup conflicts have not taken place in the study re‐
gion since the Nama uprising against German colonizers in 1904.
People in both areas are similarly dependent on the availability of natural resources.
Wage employment is rare in the whole Berseba constituency, and the large majority of inhab‐
itants makes a living from extensive livestock production on commonly managed pastures (CBS, 2004). Accordingly, about 81 percent of the residents in our sample cite livestock pro‐
duction as their most important source of income, and 95 percent possess livestock. (The sample characteristics are presented in Table A.1 in the Appendix.) Only 14 percent receive income from wage labor, among which about one‐fourth are employed as herders. Livestock is not only an important source of income and food, but also fulfills an insurance function and represents social status in the Nama culture (Klocke‐Daffa 2001). The average herd size of our sample, measured in terms of small stock units (SSU), is 119 SSU.8 As a consequence of better resource availability, people in the high‐yield area possess larger herds (mean=135 SSU, median=85 SSU) than those in the low‐yield area (mean=103 SSU, median=60 SSU).
Though the difference in herd sizes between the areas is not statistically significant (Z=0.48, p=0.63, n=120), it is economically very sizeable. Differences in grazing availability seem to al‐
so affect herd composition, as 67 percent of livestock owners in the high‐yield area keep cat‐
tle as compared to about 12 percent in the low‐yield area. Farmers in the high‐yield area also own significantly more sheep those in the low‐yield area. Cattle and sheep are more de‐
manding with respect to fodder requirements than goats and donkeys, both in terms of quantity and quality.9 Livestock is kept around water points, and people typically rotate their livestock in a radius of about six kilometers around their houses.
3 Experimental Design and Procedures
We carried out 20 experimental sessions in 15 locations, with 10 sessions being held in each (high‐yield and low‐yield) area. Each session consisted of 6 participants, resulting in a total
8 Examples for small stock include goats and sheep. Large stock – such as cattle, donkeys and horses – is con‐
verted into SSU at the common conversion rate of 1:6 (i.e., 1 cattle is equal to 6 SSU). Though donkeys and horses are mainly kept for transport, their meat is nevertheless a component of many people’s diet.
9 Personal communication with Leon Lubbe (Chief Agricultural Researcher at the Ministry of Agriculture, Wa‐
ter and Forestry, November 26th 2009) and Anton Losper (extension officer in the Karas region, Ministry of Agriculture, Water and Forestry, October 5th 2009).
sample size of 120. Participants were 42 years old on average and had attended school for about 7.4 years; two‐thirds were male. A session consists of four tasks:
1) a joy‐of‐destruction experiment, 2) a public goods experiment,
3) an individual follow‐up questionnaire and
4) a short group discussion on migration, internal conflicts and environmental problems at the very end of the session.
A session lasted 90 minutes on average, including the questionnaires and discussion. All ses‐
sions were conducted between November and December 2009. This period constitutes the end of the dry season in the study area, when pasture scarcity is most pronounced.
3.1 The Joy‐of‐Destruction Experiment
To investigate the differences in antisocial behavior across subjects and between areas, we used a one‐shot version of the joy‐of‐destruction (JoD) experiment (Abbink and Sadrieh 2009; Abbink and Herrmann 2011). The design of the JoD experiment offers a simple way to analyze spiteful attitudes. In the experiment, two subjects were randomly matched. Both re‐
ceived an initial endowment of N$10 (equivalent to PPP US$1.6) and had to decide whether or not to reduce (“burn”) the other player’s income by N$5 at a personal cost of N$1.10 Thus, destruction entails no material benefits for the destroying subject but a personal sacrifice. Be‐
cause it is played one‐shot and decisions are made anonymously, strategic aspects should not matter and “not burning” is the strictly dominant strategy of a rational self‐concerned player. The experiment has three possible outcomes, which are summarized in Table 1. First, both subjects decide not to reduce the other’s income. In that case, each subject remains with N$10. Second, each subject decides to destroy the other’s income, leaving both with N$4.
Third, one subject reduces the other’s return while the other does not, resulting in an une‐
qual payoff distribution of N$9 for the destroying party and N$5 for the victim of destruc‐
tion. After a subject had made a decision, the subject was asked to state his or her expectation about the interaction partner’s choice. The elicitation of expectations was not incentivized – that is, subjects were not rewarded for guessing correctly.
Table 1: Payoff table for the joy‐of‐destruction experiment
Source: Author’s illustration.
10 Subjects were asked “Do you want to pay one dollar to reduce your partner’s income by 5 dollars?” In the fol‐
lowing, however, we use the terms “burn”, “destroy” or “reduce” interchangeably.
Player B Player A
Burn not burn
burn 4/4 9/5
not burn 5/9 10/10
3.2 Design of the Public Goods Experiment
In a public goods (PG) experiment, cooperation is required to achieve socially optimal out‐
comes, while incentives for free riding are present. In the version applied here, participants were randomly and anonymously divided into two groups of three members. Each member was endowed with N$10 and had to decide how much to contribute to a public account (re‐
ferred to as project in our study) and how much to keep for him‐ or herself. Members could contribute any integer value between N$0 and N$10. The dollars kept constitute the private earnings, while those contributed determine earnings from the public good. For each N$1 contributed, each participant received N$0.5 from the public good, irrespective of whether he or she contributed anything. Because the marginal per‐capita return from the public good is lower than that from the private account, keeping all the money is the dominant strategy of a rational actor motivated by self‐interest. However, if nobody contributes, individual earnings are lower than in the socially optimal situation, where all contribute their entire endowment (N$10 compared to N$15). The gap between self and social interest captures the dilemma in‐
herent to public goods. The PG experiment is played one‐shot and decisions are made anon‐
ymously. After a player had decided on the contribution amount, the player was asked whether or not he or she believed that the other two group members had made a positive contribution.
3.3 Experimental Procedures
The standard procedures of economic experiments were applied, which meant that commu‐
nication among participants was strictly prohibited. All decisions were made anonymously and neither the group composition in the PG experiment nor the identity of the interaction partner in the JoD experiment was disclosed to the participants. We used uniform instruc‐
tions that were translated from English into Afrikaans and presented orally by a local field assistant. We employed the same field assistant for all 20 sessions. One coauthor was always present. The experiments were conducted by pen and paper.
The experiments were carried out consecutively without a break in between. We alternat‐
ed the sequence in which the experiments were held to control for order effects – half of all sessions started with the JoD experiment, half with the PG experiment. Both games were played for one single round, which allowed us to eliminate strategic aspects – such as reputa‐
tion building or the fear of retaliation – that may arise from repetition of the game (Cubitt et al. 2011). A potential drawback of one‐shot designs is that subjects cannot learn from experi‐
ence. To overcome this, we put special emphasis on detailed explanations and gave numer‐
ous examples (see Appendix) to ensure that all participants understood the mechanisms of the games. In addition, subjects were encouraged to pose questions that were asked and an‐
swered in private.
Subjects were paid individually and privately at the end of the entire session. They earned on average N$30.5 (PPP US$5), including a show‐up fee of N$10. In comparison, the daily salary of a wageworker in the study region amounts of about N$40.
3.4 Recruitment
Due to the very low population density in the study region, and the fact that settlements and livestock posts are far scattered within the large territory, recruitment was a challenging task.
Most locations are livestock posts that comprise four to eight houses. Logistically, it would have been extremely time‐consuming – and sometimes impossible – to bring together people from different locations. Because of this and the fact that we tried to avoid having more than one participant from the same household, we only considered livestock posts with six or more houses. Thirteen locations fulfilled this requirement and were used in this study. The remaining seven sessions were held in two settlements: four sessions in Kutenhoas (in the high‐yield area and comprised of 32 households) and three in Snyfontain (in the low‐yield area and comprised of 27 households).11 To minimize the confounding effects of cross talk in these two villages, participants were recruited immediately before the start of the session.
Results from Kruskal Wallis tests provided no evidence of cross‐talk or contagion effects.12 We invited one person per household to participate. Where there were more than 6 house‐
holds per location, we randomly determined which households could send a member for participation. In the two bigger settlements, the experiments were conducted in the kinder‐
garten and school; on livestock posts where these facilities were not available, open‐air ses‐
sions were held.
4 Conjectures
The central question addressed in this paper is whether certain economic behaviors emerge under different degrees of resource scarcity. A natural starting point for the formulation of conjectures is to draw on theoretical models. However, neither the homo economicus ap‐
proach nor models of other‐regarding preferences help to derive predictions regarding cross‐
area differences. Based on the assumption that people are rational and solely interested in maximizing their own payoffs, the homo economicus model would predict – for example – that nobody will burn money in the joy‐of‐destruction game and everybody will contribute
11 A Mann‐Whitney U test assessing whether the mean ranks of contributions in the PG experiment differ be‐
tween settlements and livestock posts cannot reject the null hypothesis of equal mean ranks, neither for the low‐yield area (p=0.17) nor for the high‐yield area (p=0.29). The same applies for burning decisions in the JoD experiment according to a Fisher’s exact test (p=0.37 in the high‐yield area p=0.39 in the low‐yield area).”
12 Kruskal Wallis tests performed to test for differences among the sessions held in Snyfontain (Kutenhoas) yield a p‐value of p=0.53 (p=0.74) for the PG experiment and p=0.20 (p=0.51) for the JoD experiment.
zero in the public goods game. This prediction holds irrespective of whether the subject re‐
sides in an area with plenty of resources or scarce resources. Although models of other‐
regarding preferences typically allow for heterogeneous preferences, the neglect of potential interactions between behavior and contextual factors, such as the exposure to resource scarci‐
ty, is also a common feature of them (e.g. Bolton and Ockenfels 2000; Fehr and Schmidt 1999). However, models in evolutionary biology postulate a positive relationship between resource scarcity and spite or competitiveness (e.g. Lehmann et al. 2009). Based on that and recent evidence from empirical studies in economics (e.g. Miguel 2005) and psychology (e.g.
Shah et al. 2012), we assume that resource scarcity does affect behavior. In particular, we ex‐
pect a higher incidence of antisocial behavior in the low‐yield area where resources are scarcer.
Predictions regarding the relationship between scarcity and cooperation are less clear.
Both, theoretical and empirical evidence is mixed in this regard. Several scholars emphasize the important cooperation‐enhancing effect that resource scarcity may have (e.g. Arnold 1998; Platteau 2000; Ostrom et al. 1999; Ostrom 1992). Ostrom (1992), for example, postulates that resource users need to be exposed to scarcity before cooperation strategies evolve. Oth‐
erwise, users face little incentive to engage in cooperation. Nonetheless, other authors argue that scarcity spurs appropriate competition and thus impedes cooperation (Grossman and Mendoza 2005; Varghese et al. 2013). Empirically, there are studies that have found a positive correlation between experimentally induced scarcity and cooperation (e.g, Rutte et al. 1987;
Osés‐Eraso et al. (2008)), while others have come to the opposite result (e.g. Blanco et al.
2012). Therefore, we do not have a clear hypothesis regarding cooperation behavior and ex‐
posure to real‐life resource scarcity.
5 Results
Our empirical analysis is separated into three parts. Section 5.1 and 5.2 examine individual behavior in the joy‐of‐destruction game and in the public goods game, respectively. In sec‐
tion 5.3, we exploit the within‐subject design to analyze subjects’ behavior across both games. Our main interest lies in behavioral differences between the low‐yield and the high‐
yield area.
5.1 Joy‐of‐Destruction Experiment and Resource Scarcity
Thirty‐two percent (38 out of 120) of subjects decided to reduce their partner’s income in the JoD experiment, although this came at a cost to themselves.13 This clearly contradicts the
13 Demand effects might affect the absolute frequency of antisocial behavior revealed in the JoD experiment.
However, the presence of demand effects should not drive differences in behavior between the high‐yield and low‐yield area on which this paper focuses.
predictions of the homo economicus model, but it is in line with results from related studies (e.g. Abbink and Sadrieh 2009; Abbink and Herrmann 2011; Zhang and Ortmann 2012). As illustrated in Figure 3, money burning happened more frequently in the low‐yield area.
There, 40 percent of all subjects destroyed their partner’s income, compared to 23.3 percent in the high‐yield area. A Fisher’s exact test rejects the null hypothesis that subjects from both areas are equally likely to destroy money against the one‐sided alternative (p=0.04).
Figure 3: Burning rates in the joy‐of‐destruction game, separated by area
The Figure shows the fraction of low‐yield area (left bar) and high‐yield area (right bar) residents that decided to reduce their partner’s income in the joy‐of‐destruction minigame.
Source: Author’s computation.
Table 2 displays the results of linear probability regressions where we regress subject’s burning decision (y=1 if subject burns money) on area of residence, beliefs and further covariates.14 In line with our conjecture and descriptive results, we find a statistically significant and economi‐
cally sizeable difference between areas in the incidence of antisocial behavior. In the first model of Table 2, the probability for destroying money increases by about 17 percentage points if the subject was from the low‐yield area. The area effect remains significant across all specifications.
Hence, we come to the following result for the joy‐of‐destruction game:
Result 1: Antisocial behavior occurs significantly more frequently in resource‐scarce areas.
Unsurprisingly, we further find individuals’ beliefs about the other player’s behavior to have very strong predictive power for burning decisions: The probability of choosing to destroy another person’s income increases by about 66 percentage points if the subject expected him‐
14 We qualitatively obtain the same results if we use probit models (see Table A.2 in the Appendix).
0.1.2.3.4Percentage of burning decisions
Low area High area
or herself to suffer a destruction of income.15 Twenty‐five percent of the sample had negative beliefs, and among them, 81 percent reduced the other’s income. This closely resembles the results of Abbink and Herrmann (2011), who report that 86 percent of the money burners had negative beliefs.16 In our sample, this kind of “conditional” or “preemptive” spite occurs more frequently in the low‐yield area, where 93 percent destroyed money when they ex‐
pected to become victims of destruction, compared to 69 percent in the high‐yield area. It is also worth analyzing the behavior of subjects who did not expect their counterparts to de‐
stroy their money. In the low‐yield area, 22 percent burned money nevertheless, compared to 7 percent in the high‐yield area. From estimation 3 in Table 2, it becomes visible that this dif‐
ference is significant between areas (t=1.93, p=0.06).17
By controlling for the number of friends and members of the extended family within the same group as well as for smoldering conflicts with other group members, we also account for the possibility that social relationships to other group members may affect decision making in the JoD game. The negative signs of number of friends and number of family member suggest that the more friends and family members in the same group, the lower the probability of destroy‐
ing another group member’s money – although the effects are not significant at conventional levels. The same applies for conflicts with other group members. Table 2 further reveals that neither the chronological sequence in which the two experiments were performed nor the amount contributed in the PG experiment has the explanatory power for burning decisions.
Sociodemographic characteristics do not seem to affect behavior in the JoD game either.
From regressions 4–7 in Table 2, it further becomes apparent that subjects whose main source of income is farming do not behave differently from wageworkers and pensioners, who constitute the reference category. We also explore whether differences in absolute and relative income affect burning decisions. As a proxy for income, we use subjects’ herd sizes, measured in terms of SSU. Regression 4 shows that people with larger herds tend to be less likely to de‐
stroy money, but the economic effect is small. Interestingly, there is no evidence for interaction effects between herd size and low‐yield area (estimation 5), suggesting that absolute herd size has similar effects in both areas. To examine the impact of a subject’s relative income position with‐
in his or her group, we divided groups according to herd size into tertiles. From model 6 in Ta‐
ble 2, we can see that subjects in the upper tertile are significantly less likely to burn money than those in the lower tertile, suggesting that positional concerns mattered indeed.
15 Because our estimates become more precise if we include beliefs, we keep it in all other models reported in Table 2. The difference between areas, however, remains significant if we exclude beliefs from the regressions (see Table A.3 in the Appendix).
16 Since the elicitation of subjects’ beliefs was not incentivized in our setup, we cannot rule out that at least some money burners pretended to have a negative expectation in order to justify spiteful acts. However, if we re‐
gress player i’s destruction decision on his or her belief and the frequency of destruction decisions of the other session members j=1…5, it turns out that the group variable is insignificant while individual expectation re‐
mains significant. This suggests that individual beliefs accurately described other people’s behavior.
17 Due to the inclusion of the interaction term between belief and area in model 3, there low‐yield area informs about differences between areas for subjects who did not have negative beliefs.
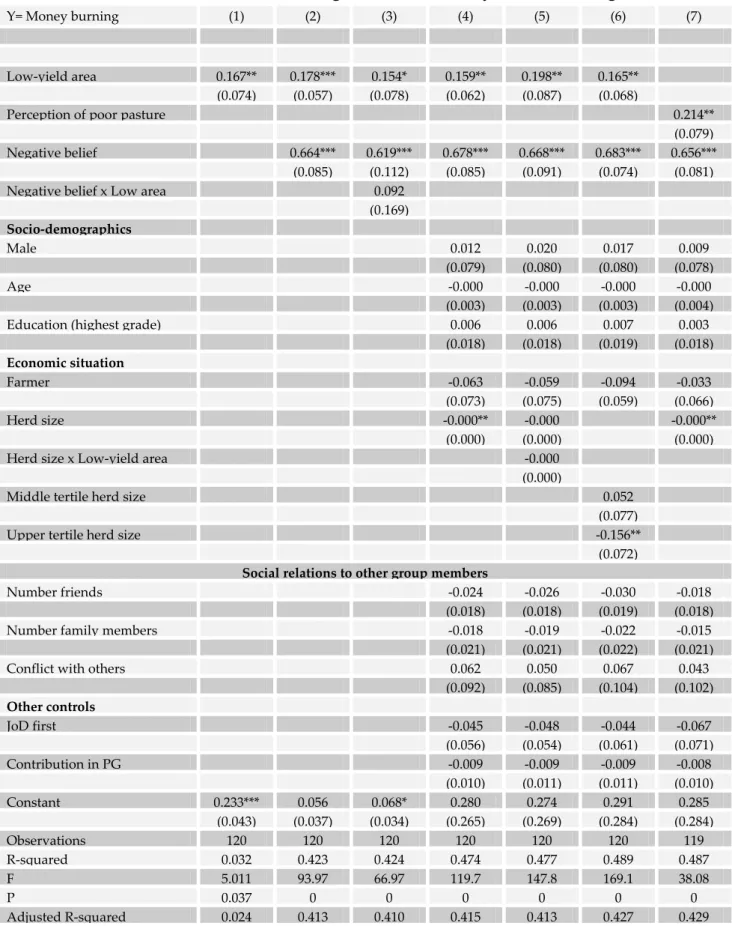
Table 2: Determinants of individual burning decisions in the Joy‐of‐destruction game
Y= Money burning (1) (2) (3) (4) (5) (6) (7)
Low‐yield area 0.167** 0.178*** 0.154* 0.159** 0.198** 0.165**
(0.074) (0.057) (0.078) (0.062) (0.087) (0.068)
Perception of poor pasture 0.214**
(0.079)
Negative belief 0.664*** 0.619*** 0.678*** 0.668*** 0.683*** 0.656***
(0.085) (0.112) (0.085) (0.091) (0.074) (0.081)
Negative belief x Low area 0.092
(0.169)
Socio‐demographics
Male 0.012 0.020 0.017 0.009
(0.079) (0.080) (0.080) (0.078)
Age ‐0.000 ‐0.000 ‐0.000 ‐0.000
(0.003) (0.003) (0.003) (0.004)
Education (highest grade) 0.006 0.006 0.007 0.003
(0.018) (0.018) (0.019) (0.018)
Economic situation
Farmer ‐0.063 ‐0.059 ‐0.094 ‐0.033
(0.073) (0.075) (0.059) (0.066)
Herd size ‐0.000** ‐0.000 ‐0.000**
(0.000) (0.000) (0.000)
Herd size x Low‐yield area ‐0.000
(0.000)
Middle tertile herd size 0.052
(0.077)
Upper tertile herd size ‐0.156**
(0.072)
Social relations to other group members
Number friends ‐0.024 ‐0.026 ‐0.030 ‐0.018
(0.018) (0.018) (0.019) (0.018)
Number family members ‐0.018 ‐0.019 ‐0.022 ‐0.015
(0.021) (0.021) (0.022) (0.021)
Conflict with others 0.062 0.050 0.067 0.043
(0.092) (0.085) (0.104) (0.102)
Other controls
JoD first ‐0.045 ‐0.048 ‐0.044 ‐0.067
(0.056) (0.054) (0.061) (0.071)
Contribution in PG ‐0.009 ‐0.009 ‐0.009 ‐0.008
(0.010) (0.011) (0.011) (0.010)
Constant 0.233*** 0.056 0.068* 0.280 0.274 0.291 0.285
(0.043) (0.037) (0.034) (0.265) (0.269) (0.284) (0.284)
Observations 120 120 120 120 120 120 119
R‐squared 0.032 0.423 0.424 0.474 0.477 0.489 0.487
F 5.011 93.97 66.97 119.7 147.8 169.1 38.08
P 0.037 0 0 0 0 0 0
Adjusted R‐squared 0.024 0.413 0.410 0.415 0.413 0.427 0.429
Notes: Linear probability models. Dependent variable: Burning decision in the JoD experiment (burn = 1, not burn
= 0). The number of observations included in regression 7 deviates from the actual sample size due to 1 missing values in Perception of poor pasture quality. Regression estimations are reported with heteroskedasticity‐robust standard errors clustered at session level (in parentheses). ***, **, and * indicates statistical significance at the 1%, 5% and 10% level, respectively. Source: Author’s computation.
Finally, in model 7 of Table 2, we replace low‐yield area with a variable that captures indi‐
viduals’ perception about the quality of their pasture. This variable is highly correlated with the area dummy (ρ=.44, p<.001). It takes the value of “1” if the subject was of the opinion that the pasture is of “poor” or “very poor” quality and “0” otherwise. We observe a significant higher incidence of antisocial behavior (i.e., burning decisions) among those who had negative perceptions about the state of their resource base. Separate regressions for each area reveal that this is the case for both areas (see Table A.5 in the Appendix). In the high‐yield area, only 6 out of 59 subjects were of the opinion that their pastures are of “poor” or “very poor” quality.
Among those 6 subjects, 3 decided to reduce their partner’s income. In the low‐yield area, the majority (51.7 percent) assessed the quality as “poor” or “very poor” and 45 percent of them were willing to destroy money. We interpret these findings as further evidence for our claim that the exposure to resource scarcity increases subjects’ readiness to engage in spiteful acts.
5.2 Public Goods Experiment and Resource Scarcity
In this section, we investigate whether and how differences in resource availability affect re‐
source users’ willingness to cooperate. As a proxy for cooperativeness, we use the fraction of the endowment a subject contributed toward the group account in the one‐shot public goods experiment. Taking the entire sample, only 7.5 percent made zero contributions. This fraction of strict free riders is substantially lower than in related studies held with Western students (e.g. Fischbacher and Gächter 2010; see Biel and Thogersen (2007) for a review of one‐shot PG experiments). At the other extreme, we found about 12 percent of participants in the high‐yield area and 15 percent in the low‐yield area who contributed their entire endow‐
ment. On average, subjects gave 46 percent of their initial endowment.
Turning to a comparison between areas, we find cooperation levels to be slightly higher in the low‐yield area (N$ 4.73 [47 percent]) compared to the high‐yield area (N$ 4.45), but the dif‐
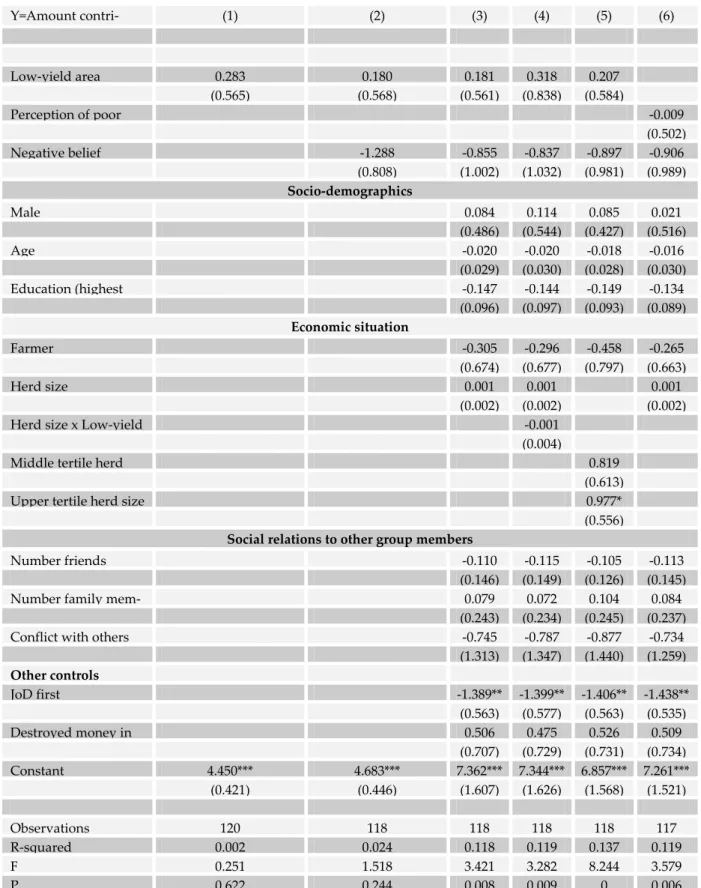
ference is statistically not significant (Z=0.539, p=0.589). OLS regressions of individual contri‐
bution decisions on the same covariates as considered above confirm our descriptive results (see Table 3). The positive coefficient of the treatment variable (low‐yield area) found across all specifications in Table 3 indicates that subjects from the low‐yield area tend to contribute slightly more than their counterparts from the high‐yield area, but the difference is not statistical‐
ly significant.18 Perceptions about the quality of the pasture and beliefs about the contribution decisions of the other two group members do not seem to affect cooperation behavior either.
Result 2: A higher degree of resource scarcity does not hamper subjects’ willingness to cooperate.
Apparently, the only independent variables considered in Table 3 that had an impact on in‐
dividuals’ cooperativeness are JoD first and upper tertile herd size.
18 We qualitatively obtain very similar results when performing double‐censored Tobit regressions instead of OLS (Table A. 6 in the Appendix). The only difference is that, in the Tobit regressions, players’ expectations are significant at the 10 percent level in regression 2.