vesicles
DISSERTATION ZUR ERLANGUNG DES DOKTORGRADES DER NATURWISSENSCHAFTEN (DR. RER. NAT.) DER FAKULTÄT CHEMIE UND PHARMAZIE
DER UNIVERSITÄT REGENSBURG
Vorgelegt von
Michal Poznik
aus Bratislava, Slowakei
Regensburg 2016
Burkhard König.
The PhD-thesis was submitted on: 31.05.2016
Date of colloquium: 1.07.2016
Board of Examiners
PD. Dr. Sabine Amslinger (Chairman)
Prof. Dr. Burkhard König (1st Referee) Prof. Dr. Olga Garcia Mancheño (2nd Referee)
PD. Dr. Rainer Müller (Examiner)
„You should get to the point where anyone else would quit and you’re NOT GOING TO STOP THERE.”
Shia LaBeouf
Table of Contents
1 Introduction – short overview 1
1.1 Functionalised vesicles ... 2
1.2 Rapid screening of photocatalytic reactions ... 4
1.3 References ... 6
2 Cooperative hydrolysis of aryl esters on functionalized membrane surfaces and in micellar solutions 9
2.1 Introduction ... 102.2 Results and discussion ... 14
2.2.1 Vesicular hydrolysis ... 14
2.2.2 Micellar hydrolysis ... 16
2.2.3 Mechanism and kinetics ... 17
2.2.4 Comparison with hydrolytic enzymes ... 20
2.3 Conclusions ... 22
2.4 Experimental Part ... 23
2.4.1 General Methods and Material ... 23
2.4.2 Synthesis of membrane additives used as membrane additives ... 23
2.4.3 Synthesis of fluorescein esters ... 26
2.4.4 Preparation and characterization of the membrane ... 30
2.4.5 Determination of cmc value for cyclen 1 ... 31
2.4.6 Calibration curves for fluorescein concentration ... 31
2.4.7 Estimated pKa values of membrane additives ... 32
2.4.8 Kinetic measurements ... 32
2.4.9 Processing of the kinetic data ... 36
2.5 References ... 41
3.2 Results and discussion... 48
3.2.1 Kinetic effects ... 49
3.2.2 Enantiodiscrimination in ester hydrolysis ... 49
3.3 Conclusions ... 52
3.4 Experimental part ... 53
3.4.1 General methods and materials ... 53
3.4.2 Synthesis ... 53
3.4.3 Synthesis of the membrane additives... 57
3.4.4 Preparation and characterization of the vesicles ... 61
3.5 References ... 63
4 The interface makes a difference: Lanthanide ion coated vesicles hydrolyse phosphodiesters 67
4.1 Introduction ... 684.2 Results and discussion... 69
4.2.1 Interaction of metal cations with DOPC vesicles ... 69
4.2.2 Hydrolysis of BNPP with different metal ions ... 71
4.2.3 Different lipids ... 71
4.2.4 Comparison of the hydrolytic properties ... 72
4.3 Conclusions ... 73
4.4 Experimental part ... 74
4.5 General methods and materials ... 74
4.5.1 Preparation and characterization of the vesicles ... 74
4.5.2 Detection of metal binding by carboxyfluorescein ... 75
4.5.3 Europium phosphorescence in the presence of the DOPC membrane ... 76
4.5.4 Sensitisation of europium emission by pyrene ... 77
4.5.5 Kinetic measurements ... 78
4.6 References ... 84
5.2 Results and discussion ... 90
5.2.1 TTA inside the bilayer ... 90
5.2.2 TTA with the sensitizer on the surface of the membrane ... 91
5.2.3 TTA on the surface of the membrane ... 93
5.2.4 Different lipids... 94
5.2.5 Effect of dilution ... 95
5.3 Conclusions ... 96
5.4 Experimental part ... 97
5.4.1 General methods and materials ... 97
5.4.2 Synthesis ... 98
5.4.3 Preparation and characterization of the vesicles ... 100
5.4.4 TTA measurements ... 103
5.4.5 NMR spectra ... 106
5.5 References ... 109
6 Fast colorimetric screening for visible light photocatalytic oxidation and reduction reactions 113
6.1 Introduction ... 1146.2 Results and discussion ... 116
6.2.1 Screening of photocatalytic oxidations ... 116
6.2.2 Screening of photocatalytic reductions ... 119
6.2.3 Screening of photocatalyst stability ... 122
6.3 Conclusions ... 124
6.4 Experimental part ... 125
6.4.1 General methods and materials ... 125
6.4.2 Indicators... 125
6.4.3 Reactor ... 129
6.4.4 Oxidation of benzyl alcohols and amines... 131
6.4.8 List of used commercial drugs ... 143 6.4.9 Synthetic procedure for dehalogenation of selected drugs... 144 6.5 References ... 148
7 Summary 154
8 Zusammenfassung 156
9 Abbreviations 158
10 Curriculum Vitae 161
11 Acknowledgement 165
1 Introduction – short overview
Vesicles are artificial liposomes whose surface can be modified by an addition of amphiphilic compounds. This approach provides a facile method for an introduction of various chemical species into close proximity with use of a simple self-assembly process. Such artificial soft particles have found a broad use in drug delivery, sensing, imaging and catalysis.
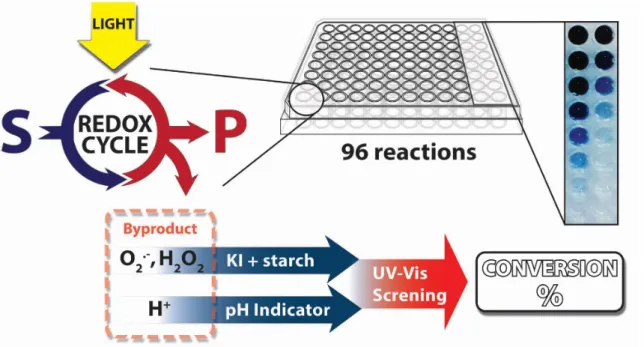
Visible light photocatalysis is an emerging field of synthetic chemistry. Therefore, a simple and facile method for rapid screening is required. We propose a photometric evaluation of the conversion using known indicators. Highly parallel investigation is possible by a directly irradiated microtiter plate as reaction vessel allowing 96 reactions at once.
Amphiphiles are molecules which combine hydrophobic and hydrophilic properties. When such compounds dissolve in water, they self-assemble into supramolecular systems.1 Depending on the nature of the amphiphiles, they usually form micelles or vesicles (Figure 1.1).
Figure 1.1 Construction of micelles and vesicles.
1,2-Dioleoyl-sn-glycero-3-phosphocholine (DOPC) and 1,2-distearoyl-sn-glycero-3- phosphocholine (DSPC) (Figure 1.1) are zwitterionic, phosphatydilcholine lipids equipped with two fatty-acid residues and are a common choice for an assembly of vesicles in aqueous solutions. Presence of the double bond in oleic acid of DOPC has a big impact on the fluidity of the membrane described by the transition temperature (Tm). At this temperature, the rigid gel-phase bilayer with a hindered lateral movement changes to fluid, so it is essentially a melting point of the membrane. DOPC provides vesicles with fluid membrane at room temperature, in contrast to a rigid bilayer of the DSPC. Fluidity of the vesicular membrane has a major influence on processes occurring on its surface.2
Vesicles can serve as a supramolecular platform into which we are able to co-embed various amphiphilic species. Using custom-made amphiphiles, we can functionalize its surface. Such molecules present in the membrane have much higher local concentration compared with a bulk solution and only 2-dimensional freedom of movement. Higher concentration increases the possible chemical and physical interaction between different amphiphiles. This offers a quick and facile method for exploring interactions between molecules without the need of laboursome synthesis of their covalently-bound analogues. This feature was successfully used in our group for sensing. In these systems, receptor and reporter amphiphiles are co-
towards the analyte are used as receptor and a reporter is usually an amphiphilic dye, which reacts to a binding event of the receptor by changing its spectroscopic properties (absorbance, fluorescence). Such vesicular probes were developed for phosphates, imidazole species or by using aptamers for a detection of trombine.3, 4, 5, 6 Imprinting on the membrane provided receptors for more complex molecules with two binding events, such as short peptides.7, 8, 9
Figure 1.2 Vesicular sensing (left) and catalytic hydrolysis (right).
This phenomenon where two species interact and induce changes in spectroscopic properties raised the question if such interaction could be beneficial also in catalysis. Micellar catalysis is known for decades and numerous examples were published.10, 11 On the contrary to the highly dynamic micellar solutions, vesicles are a stable constructs, which might improve cooperative effects on the surface. Since they are ubiquitously prepared in aqueous solutions, it is apparent to examine catalytic reactions, which could benefit from the water–bilayer interface. In our group, the use of vesicles for photocatalytic water splitting was utilised.12, 13,
14 With the use of buffer, we can examine the catalytic hydrolysis at biological pH 7.4 and obtain artificial nucleases, which are able to effectively hydrolyse DNA.15, 16 It was found that a zinc complex co-embedded into the surface of the membrane increases the activity dramatically (Figure 1.2, right).16
In this work, I tried to extend our knowledge of the cooperative effects on the vesicular surface to identify better systems for catalytic hydrolysis. I focused on inducing activity by membrane additives, which resulted in higher hydrolytic activity in hydrolysis of aryl esters (Chapter 2). I showed that also selectivity can be affected by using chiral additives, which prompts the hydrolysis of one enantiomer of chiral-activated esters (Chapter 3). Later, I examined a simplified system where a complicated metal complex was replaced by
hydrolytic activity (Chapter 4).
We learned that the membrane induces cooperative effects simply by increasing the statistical probability for two molecules to come in close proximity. This is also very important in many physical processes like non-radiative energy transfers, such as FRET.
Therefore, we decided to examine triplet–triplet annihilation (TTA) upconversion process in the vesicular systems (Chapter 5).17 This upconversion process consists of several intermolecular energy transfers, which should be favoured in vesicles. We were able to show that vesicles not only exhibit TTA, but also provide soft particles with molar upconversion efficiency that of is independent of the concentration of the solution.
1.2 Rapid screening of photocatalytic reactions
Small unilamelar vesicles are systems, which are extremely hard to visualise on a molecular level without altering some of the main properties. This forces us to use indirect methods of analysis. Most of the surface interactions were demonstrated using principles of FRET or sensitising the phosphorescence. For kinetic measurements, we adopted microtiterplate technology for evaluation of a large amount of samples. These experiences lead us to reconsider the typical approach to screening methods for synthetic reactions. Especially in the emerging field of visible light photocatalysis,18 where numerous transformations are being developed every day and state of the art technique for analysis like GC or HPLC are slow and costly. We have chosen a different approach and developed a method where we screen reaction conversions through the analysis of formed by-products. These are identical throughout the substrate scope and by employing an indicator, we were able to photometrically screen conversions of such reactions. Combining it with microtiterplate technology, we established and tested a rapid screening technique for visible light photocatalysis (Figure 1.3, Chapter 6).
Figure 1.3 Principle of the screening method for a visible light photocatalysis.
1. Franks, F., Water A Comprehensive Treatise: Volume 4: Aqueous Solutions of Amphiphiles and Macromolecules. Springer US: 1975; Vol. 4, p 839.
2. Eze, M. O., Phase transitions in phospholipid bilayers: Lateral phase separations play vital roles in biomembranes. Biochem. Educ. 1991, 19 (4), 204-208.
3. Muller, A.; Konig, B., Preparation of luminescent chemosensors by post-functionalization of vesicle surfaces. Org. Biomol. Chem. 2015, 13 (6), 1690-1699.
4. Gruber, B.; König, B., Self-Assembled Vesicles with Functionalized Membranes. Chem. Eur.
J. 2013, 19 (2), 438-448.
5. Balk, S.; Maitra, U.; Konig, B., Terbium(iii)-cholate functionalized vesicles as luminescent indicators for the enzymatic conversion of dihydroxynaphthalene diesters. Chem. Commun.
2014, 50 (58), 7852-7854.
6. Muller, A.; Konig, B., Vesicular aptasensor for the detection of thrombin. Chem. Commun.
2014, 50 (84), 12665-12668.
7. Gruber, B.; Balk, S.; Stadlbauer, S.; König, B., Dynamic Interface Imprinting: High-Affinity Peptide Binding Sites Assembled by Analyte-Induced Recruiting of Membrane Receptors.
Angew. Chem. Int. Ed. 2012, 51 (40), 10060-10063.
8. Balk, S.; König, B., Thermally induced molecular imprinting of luminescent vesicles. J.
Inclusion Phenom. Macrocyclic Chem. 2014, 81 (1), 135-139.
9. Banerjee, S.; König, B., Molecular Imprinting of Luminescent Vesicles. J. Am. Chem. Soc.
2013, 135 (8), 2967-2970.
10. Rathman, J. F., Micellar catalysis. Curr. Opin. Colloid Interface Sci. 1996, 1 (4), 514-518.
11. La Sorella, G.; Strukul, G.; Scarso, A., Recent advances in catalysis in micellar media. Green Chem. 2015, 17 (2), 644-683.
12. Hansen, M.; Li, F.; Sun, L.; Konig, B., Photocatalytic water oxidation at soft interfaces. Chem.
Sci. 2014, 5 (7), 2683-2687.
13. Troppmann, S.; Brandes, E.; Motschmann, H.; Li, F.; Wang, M.; Sun, L.; König, B., Enhanced Photocatalytic Hydrogen Production by Adsorption of an [FeFe]-Hydrogenase Subunit Mimic on Self-Assembled Membranes. Eur. J. Inorg. Chem. 2016, 2016 (4), 554-560.
14. Troppmann, S.; König, B., Functionalized Membranes for Photocatalytic Hydrogen Production. Chem. Eur. J. 2014, 20 (45), 14570-14574.
2005, (20), 2540-2548.
16. Gruber, B.; Kataev, E.; Aschenbrenner, J.; Stadlbauer, S.; König, B., Vesicles and Micelles from Amphiphilic Zinc(II)–Cyclen Complexes as Highly Potent Promoters of Hydrolytic DNA Cleavage. J. Am. Chem. Soc. 2011, 133 (51), 20704-20707.
17. Zhao, J.; Ji, S.; Guo, H., Triplet-triplet annihilation based upconversion: from triplet sensitizers and triplet acceptors to upconversion quantum yields. RSC Adv. 2011, 1 (6), 937- 950.
18. Schultz, D. M.; Yoon, T. P., Solar Synthesis: Prospects in Visible Light Photocatalysis.
Science 2014, 343 (6174).
2 Cooperative hydrolysis of aryl esters on functionalized membrane surfaces and in micellar solutions
Catalytic hydrolysis of peptides, proteins, phosphates or carboxylate esters in nature is catalysed by enzymes, which are efficient, fast and selective. Most of the hydrolytic chemical catalysts published so far mimic the active site of enzymes and contain metal complexes and amino acid residues. Their synthesis can be laborious, while the hydrolytic activity is still limited compared to enzymes. We present an approach that uses fluid membranes of vesicles and micelles as a support for amphiphilic additives, which cooperatively cleave aryl ester bonds. The membrane anchored bis-Zn(II)-complex 1 is hydrolytically active and hydrolyses fluorescein diacetate (FDA) with a second order rate constant (k2) of 0.9 M−1 s−1. The hydrolytic activity is modulated by co-embedded membrane additives, bearing common amino acid side chain functional groups. With this approach, the hydrolytic activity of the system is enhanced up to 16 fold in comparison with cyclen 1 (k2 = 14.7 M−1 s−1). DOPC and DSPC lipids form at room temperature fluid or gel phase membranes, respectively. Omitting the lipid, micellar solutions were obtained with hydrolytic activity reaching k2 = 13.4 M−1 s−1. It is shown that cooperative hydrolysis is favoured in fluid membranes and micelles, allowing the active moieties to arrange freely. The embedding and dynamic self-assembly of membrane active components in fluid membranes and micelles provide facile access to hydrolytically active soft interfaces.
This chapter was published in:
M. Poznik and B. König, “Cooperative hydrolysis of aryl esters on functionalized membrane surfaces and in micellar solutions”, Org. Biomol. Chem., 2014, 12, 3175–3180
2.1 Introduction
Carboxyesters are ubiquitously found in nature. They are involved in many biological processes and present in everyday life. Esters of drugs are better transported through membranes with respect to free drugs and cleaved inside cells by esterases. This is often used as pro-drug concept in pharmaceutical sciences.1 Peptides, proteins, phosphate and carboxy esters, respectively are catalytically hydrolysed by natural enzymes and many attempts to design artificial hydrolysing enzymes have been reported over time, but their efficiency is still limited when compared to the natural models.2, 3 Most hydrolases contain metal ions such as zinc(II) (carboxypeptidase A, astacin) in their active centres.4 The stabilisation of the transition state during hydrolysis occurs by hydrogen bonding of the ester group to amino acid residues of the enzyme protein backbone. Histidine, tyrosine and glutamine often participate in the activation of the substrate. The crucial properties of the enzyme active centre are the appropriate distance and geometry of all participating groups, their dynamics during the reaction, the microenvironment created by the folded enzyme and the ability to bind the substrate. Combining all such features in one organic molecule is challenging or even impossible and covalent enzyme models may be incapable of adjusting the conformation for an efficient hydrolysis.2, 5, 6
Scheme 2.1 Amphiphilic bis-Zn-cyclen 1 used as a hydrolytic metal center, fluorescein diacetate (FDA) used as a fluorescent probe and supporting lipids for providing fluid (DOPC) and gel phase (DSPC) membranes.
To investigate an alternative approach, we used functionalized membrane surfaces of vesicles and micelles for the cooperative hydrolysis of esters (Figure 2.1) with zinc complex 1 (Scheme 2.1) as a hydrolytically active metal center. This complex is known to coordinate water molecules and due to its Lewis acidity it produces hydroxide anions used for hydrolysis reactions at neutral pH.7, 8 The reaction rate was found to increase dramatically once complex 1 was embedded in a lipid membrane or in micelles.9 Embedded in
membranes, complex 1 may also serve as a ligand for the molecular recognition of phosphate anions.10
The effect of micellar catalysis of surfactant solutions has been studied and described in detail in the literature.11, 12 It was discovered that positively charged surfactants, such as tetraammonium salts, amines etc. embedded in micelles cleave p-nitrophenol esters in buffered solutions at pH 7 with a high efficiency.13, 14, 15 This effect is most likely caused by the high local concentration of the polar functional groups on the surface. Metallomicelles were also intensively studied for their increased hydrolytic activity with respect to homogeneous solution.16, 17
Figure 2.1 Concept of the proposed membrane hydrolysis.
The proposed cooperative catalytic effect by combining embedded metal complexes and membrane additives on the surface of a vesicular membrane is depicted in Figure 2.1. Soft interfaces are important for many biological processes and found use also in artificial systems.18 A potential advantage using a 2D functionalized membrane for hydrolysis is the non-covalent assembly of the components in a two dimensional fashion. In the fluid membrane of a vesicle, the hydrolytic active components may statistically arrange in distances optimal for hydrolysis. This concept offers the easy and facile testing of different combinations of components and their possible cooperative action. Micellar solutions of cyclen 1 and membrane additives were also examined for their hydrolytic activity. However, an advantage of the vesicular systems is that their structure is better defined and the effects of different membrane additives can be compared easier. The membrane active amphiphilic molecules are, most likely, not randomly distributed in the membrane, but form clusters and patches. Complete phase separation or limited mobility in the membrane might inhibit the cooperative action (Figure 2.2).19
Figure 2.2 Expected patch formation in different phospholipid membranes.
To support this concept a well-described FRET pair of two amphiphilic fluorescent dyes was co-embedded into membranes (Figure 2.3).20 The amphiphilic dye TAMRA exhibits in close proximity to amphiphilic carboxyfluorescein CF an emission at 580 nm after FRET, if irradiated at 495 nm. Both amphiphilic dyes were embedded in DOPC and DSPC membrane, respectively (Scheme 2.1).
Figure 2.3 Emission spectra of CF (0.025 mM) and TAMRA (0.025 mM) mixture in various lipids (λexc = 495 nm) and the mechanism of FRET.
The unsaturated lipid DOPC forms a fluid membrane at room temperature due to its transition temperature of −20 °C. DSPC yields a rigid gel phase membrane at room temperature (transition temp. 55 °C). The FRET is observed only in the fluid membrane of
DOPC lipids, which indicates partially mixed patch formation under these conditions (Figure 2.3).
Membrane additives (Scheme 2.2) were designed to support the hydrolysis reaction resembling functional groups that are present in the active centers of hydrolytic enzymes, e.g imidazole, phenol, acids or amides. Micellar hydrolytic activity has been reported previously for amines, oximes and histidine.21, 22 The series was extended to cover a larger range of acidic, neutral, basic and cationic functional groups. Amphiphiles are grouped in Scheme 2.2 according to the increasing pKa values of corresponding non-amphiphilic molecules (see experimental part for the reported literature values).
Scheme 2.2 Membrane additives investigated for cooperative hydrolysis in their expected protonation state at pH 7.4, grouped by pKa values of the functional group.
2.2 Results and discussion 2.2.1 Vesicular hydrolysis
The hydrolytic activity was monitored using fluorescein diacetate (FDA, Scheme 2.1), a substrate for membrane esterases, often used for evaluating the viability of cell samples.23, 24 FDA is a non-fluorescent diaryl ester whose fluorescence is triggered by the cleavage of its ester groups. The often used p-nitrophenol esters are more labile towards hydrolysis and their photometric determination is less sensitive than the measurement of fluorescence.
DOPC DSPC
k
obs10
-5s
-1k
0obs10
-5s
-1k
obs10
-5s
-1k
0obs10
-5s
-1 Zn-cyclen 1[5 mol%]
0.26 - 2.14 -
with membrane additive
[10 mol%]A1
0.07 0.01 0.6 0.01
A2
0.9 0.03 2.1 0.02
A3
0.3 0.02 2.5 0.02
A4
2.4 0.03 2.2 0.01
A5
0.4 0.03 1.9 0.02
A6
0.4 0.02 2.6 0.02
A7
0.5 0.04 1.4 0.02
A8
0.4 0.05 1.9 0.02
A9
4.0 0.5
21.60.8
A10
4.4 0.9 6.0 0.3
A11 11.9
3.3
9.3 1.2A12
0.9 0.05 4.2 0.03
A13
10.9 4.0 5.0 0.1
A14 17.2 9.8
5.3 0.08
A15
7.6 2.5 4.2 0.05
A16
1.6 0.05 3.3 0.04
A17
0.9 0.03 3.9 0.03
Table 2.1 Hydrolytic activity of vesicular systems : kobs: 10 mol % of amphiphiles (0.05 mM) and 5 mol.
% of cyclen 1 (0.025 mM) relative to the lipids in DOPC, DSPC membrane, k0obs: hydrolytic rates for systems without 1.
All measurements were performed under pseudo first-order-reaction conditions and the rate constant of hydrolysis (kobs) was derived from the slope of the increased fluorescein concentration over 20 min (s-1) and from the initial FDA concentration. The concentration of
the released fluorescein was determined using a recorded calibration curve in vesicular solutions not exceeding its linear region (see experimental part). All reported membrane additives were tested in vesicular membranes prepared by sonication above their transition temperature from both DOPC and DSPC in the presence of bis-Zn-cyclen 1. To properly examine the hydrolysis, the best composition of the membrane was found to be 5 mol % of 1, 10 mol. % of the respective membrane additive and 85 mol % of phospholipid. Hydrolytic activity was determined also for vesicles containing only the zinc cyclen complex 1 (5 mol %) or exclusively non-metal ion containing membrane additives (10 mol %). The measurements indicate, which species is mainly responsible for the hydrolysis. All data are summarized in Table 2.1 (values sorted according to Scheme 2.2).
Bis-Zn-cyclen 1 embedded in the membrane showed a higher activity towards hydrolysis than a non-amphiphilic solution of 1 (see experimental part), which confirms previous observations for bis(4-nitrophenyl) phosphate.9 Non-amphiphilic models of membrane additives were also tested for hydrolytic activity but none was observed (see experimental part). We found that 1 is much more active in rigid DSPC- than in fluid DOPC-membranes.
Compounds A9, A10, A11, A13, A14 and A15, respectively exhibit high rates of hydrolysis in the absence of 1 in the membrane, often exceeding the rate of sole cyclen 1. These compounds have functional groups that have been previously reported to be hydrolytically active in micellar solutions.
Figure 2.4 Comparison of the hydrolytic effects in selected vesicle compositions.
Only palmitic acid A1 caused a notable drop in the hydrolytic activity. The coordination of its carboxylate group to bis-Zn-cyclen 1 may provide a rational explanation for the inhibition.
Amphiphiles which are expected to be neutral at the investigated pH = 7.4, A7, A8, A3, A5
and A6, respectively (for DSPC also A2, A4) induced only small changes in the hydrolytic activity. High-polar and basic membrane additives exhibited the highest hydrolytic activity in combination with cyclen 1. A comparison of hydrolytic rates of membranes containing only cyclen 1 or its combination with a membrane additive (Figure 2.4) clearly indicates cooperative effects.
Figure 2.4 shows that selected membrane additives (A4, A9, A10, A11, A13, A14, A15, A16, and A17) are hydrolytically more active in fluid membranes. With exception of A9 a larger increase of the hydrolytic rate is observed in DOPC membranes than in DSPC. The effect is most pronounced for membrane additives that are only hydrolytically active in combination with complex 1, such as oxime A4 (ninefold higher activity), phenol A2 (threefold) and guanidinium A17 (threefold). A rational may be the higher dynamics of embedded amphiphiles in the membrane. All membrane additives that increase the hydrolytic activity of complex 1 have some common structural features. All compounds bear a N-O or H-O bond and are at pH 7 either neutral with a pKa value close to 7 (imidazole: 6.95, phenol: 8.05) or are protonated (amines, guanidinium). Protonated membrane additives A with more hydrogen atoms tend to accelerate the hydrolysis more: The addition of the primary octadecylamine A14 induced a more than 10 times faster hydrolysis compared to the tertiary amine A12 in DOPC.
The hydrolytic effect of micellar solutions with polar head groups is often credited to the high local concentration of positive charge on the surface, therefore creating a local high concentration of hydroxide ions, but the example of trimethylammonium salt A17 shows that this effect is only small in comparison with cations generated by protonation (amines, guanidinium). The observations indicate that the rate enhancing effect of some membrane additives may have its origin in creating hydrogen bonds, which stabilize the transition state of substrate hydrolysis reaction.
2.2.2 Micellar hydrolysis
Kinetic measurements of micellar solutions were done under the same conditions as described for the vesicular solutions. The concentration of every component was kept constant and only the lipids were omitted in the preparation step. Concetrations of amphiphiles were exceeding their cmc values (cmc for cyclen 1 is less than 0.01 mM, see experimental part). Fluorescence is strongly quenched in the co-micellar solutions and the hydrolysis was therefore monitored by absorption spectroscopy. Pseudo first-order-reaction rate constants of hydrolysis (kobs) were calculated from the slope of the increased fluorescein
absorption band (λmax = 505 nm) over 3 min (M s-1) divided by the initial FDA concentration (see experimental part).
kobs
10
-5s
-1 k0obs10
-5s
-1Zn-cyclen 1
8.6 -
with additive
A9
34.6 n.d.
A11
30.7 0.5
A14
22.4 1.7
Table 2.2 Hydrolytic activity of micellar systems: kobs: rate of system with cyclen 1 (0.025 mM) and membrane additives (0.05 mM), k0obs: micellar solutions of membrane additives. Same concentration as for vesicular measurements is used.
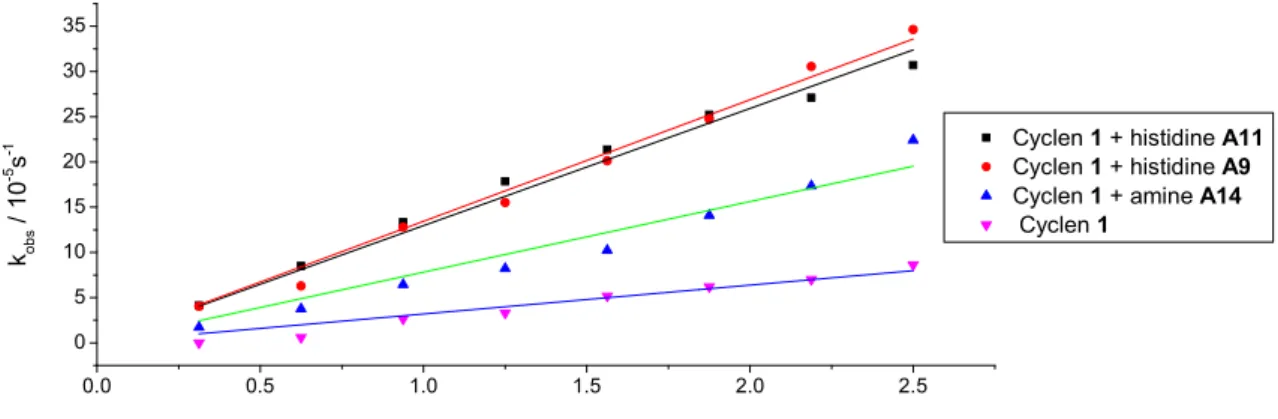
For micellar hydrolysis only the membrane additives A9, A11, A14 were tested, because they gave best results in vesicular systems. An enhancement of the hydrolytic activity was observed for micelles of cyclen 1 with respect to the vesicular solution. On the contrary, the membrane additives without the lipid were less active (A11, A14) or insoluble (A9). Co- micellar solutions gave high catalytic activity towards hydrolysis in all three tested system exceeding the activity of vesicles. An average 3-fold increase of activity in comparison to micellar cyclen 1 solution without membrane additive implies the existence of co-micelles and cooperative effects in the hydrolysis.
2.2.3 Mechanism and kinetics
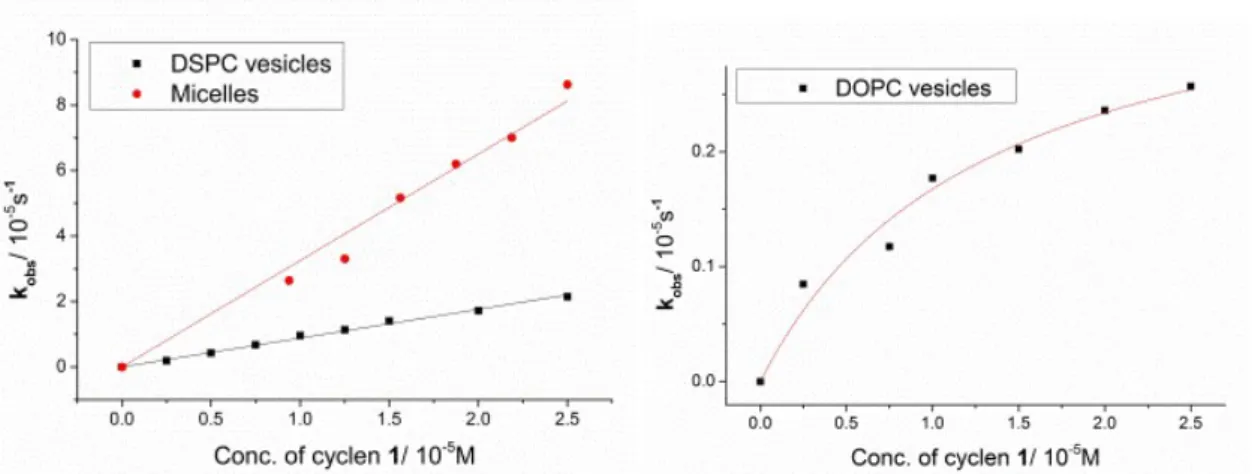
For mechanistic studies, various concentrations of vesicular and micellar solutions were used and the observed pseudo-first-order kinetic rate constants were plotted against the overall cyclen 1 concentration in the solutions (Figure 2.5). The reaction mechanism with embedded cyclen 1 tends to be different for DSPC and micelles than for DOPC membranes. Two kinetic models were used: second-order kinetics were observed in the case of DSPC vesicles and micelles with kobs linearly dependent on the concentration of cyclen 1 in solution. In contrast, DOPC vesicles show a Michaelis–Menten type behaviour of saturation kinetics. Apparently, a complex of substrate and catalyst is formed, which then undergoes the hydrolysis reaction.
The kinetic data were non-linear fitted using equation (1.1) according to previously published studies.25
(1)
KM describes the stability of the catalyst-substrate complex and kcat the rate of its decomposition to product and catalyst. In a fluid DOPC membrane, Zn-cyclen 1 shows
saturation kinetics even without the presence of a membrane additive, but in a rigid DSPC membrane and in micelles the hydrolysis rate increases linearly with the Zn-cyclen 1 concentration.
Figure 2.5 Second order kinetics for DSPC vesicle and micelles (left) and saturation kinetics for DOPC (right) containing cyclen 1.
The kinetics of functionalized membranes with the highest hydrolytic activity consisting of cyclen 1 and membrane additives A4, A14, A9 or A11 were recorded and fitted to linear and non-linear (1) models. The derived constants are summarized in Table 2.3 (for data evaluation, see experimental part).
kcat
10-5s-1 KM
10-5M k2' (kcat/KM)
M-1·s-1· k2
M-1·s-1·
DOPC
Only cyclen 1 (5 %) 0.3 0.7 0.5 −
5 % 1 + 10 % A4 10.4 8.4 1.2 −
5 % 1 + 10 % A9 − − − 1.6
5 % 1 + 10 % A11 40.9 9.3 4.4 −
5 % 1 + 10 % A14 44.2 3.0 14.7 −
DSPC
Only cyclen 1 (5 %) − − − 0.9
5 % 1 + 10 % A4 − − − 0.9
5 % 1 + 10 % A9 − − − 8.4
5 % 1 + 10 % A11 − − − 3.7
5 % 1 + 10 % A14 11.1 2.7 4.1 −
micelle.
Only cyclen 1 − − − 3.2
1 + A9 − − − 13.4
1 + A11 − − − 12.9
1 + A14 − − − 7.8
Table 2.3 Second order rate constants: Only best performing systems selected.
For a better comparison of second order rate constants and reactions following a Michaelis–
Menten kinetics, the initial slope was calculated dividing kcat by KM (k2'). For most of the functionalized DOPC membranes non-linear fitting gave better results as they followed not a single kinetic models, whereas rigid DSPC systems showed mostly linear correlations.
The membrane additive A9 behaves different from the other functionalized lipids and shows a linear second-order kinetic also in the DOPC. Embedded amine A14 leads to a saturation kinetic also in DSPC vesicles. Micelles of cyclen 1 and membrane additives showed the best hydrolytic activity.
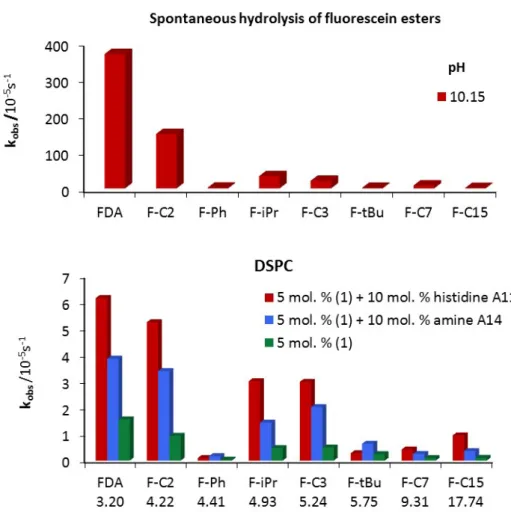
To study the effect of lipophilicity and sterical hindrance of the ester group on the hydrolysis rate, a series of fluorescein esters was prepared (Table 2.4). All these compounds were tested under the same conditions as previously described and pseudo-first order hydrolytic rates were recorded for the three best performing membrane compositions with DSPC and DOPC lipids (Table 2.1, 2.2).
Namepr. R logPc
FDA
aCH
33.20 F-C2
aCH
2CH
34.22 F-Ph
bPh 4.41 F-iPr
b iPr4.93 F-C3
b(CH
2)
2CH
35.24 F-tBu
b tBu5.75 F-C7
b(CH
2)
6CH
39.31 F-C15
b(CH
2)
14CH
317.47
Table 2.4 Fluorescein diesters: a, Prepared from the acid chloride; b, Prepared from the acid anhydride;
c, Values obtained from ACDlabs software.
Figure 2.6 shows that the trends in hydrolysis for the different esters remain the same in the different vesicular systems (for data, see experimental part); the molecular structure of the ester does not significantly affect the mechanism. The reactivity of the different esters is not affected by the membrane fluidity (DOPC vs. DSPC). The highest hydrolytic activity was reached for FDA, the least lipophilic ester (Figure 2.6). With increasing lipophilicity of the esters, the hydrolytic activity decreases. The lowest rates of hydrolysis were recorded for phenyl or tBu esters (F-Ph, F-tBu), which are more stable due to steric hindrance.
The trend in vesicular catalytic hydrolysis of the esters follows the reactivity for spontaneous hydrolysis. The stabilizing effect of increasing lipophilicity is less pronounced for reactions in vesicular solutions.
Figure 2.6 Hydrolysis of fluorescein esters (0.02 mM) spontaneously at pH 10.15 and by functionalized DSPC membranes at pH 7.4.
2.2.4 Comparison with hydrolytic enzymes
A direct comparison of kinetic data from the literature can be challenging due to different substrates and variations in the reaction conditions. Therefore commercially available hydrolytic enzymes were used under identical conditions to benchmark the hydrolytic rate of the functionalized vesicles. Porcine liver esterase and the lipase Candida rugosa, typical enzymes used in organic synthesis, were selected. Kinetic data were derived using the same non-linear fit as for vesicles to obtain kcat and KM. Since the enzymes are produced by extraction and no exact purity is given by the supplier, kinetic constants were calculated in weight concentration (mg ml-1) for enzymes and vesicles. For vesicles the weight of cyclen complex 1, membrane additive A and the lipid was considered (see experimental part for data).
DOPC membranes functionalized with cyclen 1 and amine A14 reach the activity of the two purchased enzymes (Table 2.5). However, the catalytic activity of the enzym active site still remains much higher compared to cyclen complex 1 and membrane additives, as the vesicles contain many hydrolytic active sites on their surface, while each enzyme has only one active centre.
kcat
10-5s-1 KM
10-1mg/ml k2' (kcat/KM) 10-4(mg/ml)-1·s-1
Porcine liver esterase
68.7 0.08 858
Lipase Candida rugosa
73.2 0.4 166
DOPC 5 % 1 + 10% A14
44.2 0.2 391
Table 2.5 Comparison of enzymatic and vesicular hydrolysis of FDA
2.3 Conclusions
Soft surfaces with ester hydrolysis activity were obtained by co-embedding of bis-Zn-cyclen complex 1 and amphiphilic membrane additives into a phospholipid membrane of a vesicle or producing a micellar solution. For many combinations of membrane additives and bis-Zn- cyclen complex 1 an increase of the hydrolytic activity up to 25 fold in comparison to complex 1 was observed. DOPC membranes that are fluid at the reaction temperature lead to more pronounced cooperative action of the membrane embedded amphiphiles and Michaelis-Menten saturation kinetic was observed for such membranes. Micellar solutions showed also higher activity when metal complex and additive are present. The functionalized vesicles with the highest hydrolytic activity were compared with two commercially available enzymes under identical reaction conditions. Considering the overall weight of the catalytic systems their hydrolysis activity towards fluorescein diesters is comparable.
In conclusion, we observed a significantly increased hydrolytic activity of functionalized vesicles and micelles at neutral pH towards carboxylesters, if Lewis acidic bis-Zn-cyclen complex 1 and functionalized amphiphiles are used concertedly. Their assembly has to be dynamic, as in DOPC membranes or micelles, to gain a cooperative hydrolytic effect.
2.4 Experimental Part
2.4.1 General Methods and Material
Dynamic Light Scattering
DLS measurements were performed on a Malvern Zetasizer Nano at 25 °C using 1 cm disposable polystyrene cuvettes (VWR).
NMR Spectra
Bruker Avance 300 (1H: 300.1 MHz, 13C: 75.5 MHz, T = 300 K). The chemical shifts are reported in δ [ppm] relative to external standards (solvent residual peak). The spectra were analysed by first order, the coupling constants are given in Hertz [Hz]. Characterization of the signals: s = singlet, d = doublet, t = triplet, q = quartet, m = multiplet, dd = double doublet, dt = double triplet. Integration is determined as the relative number of atoms. Error of reported values: chemical shift: 0.01 ppm for 1H NMR, 0.1 ppm for 13CNMR and 0.1 Hz for coupling constants. The solvent used is reported for each spectrum.
Mass Spectra
Finnigan MAT TSQ 7000 (ESI).
General
Thin layer chromatography (TLC) analyses were performed on silica gel 60 F-254 with a 0.2 mm layer thickness. Detection via UV light at 254 nm / 326 nm or through staining with KMnO4. Column chromatography was performed on silica gel (70–230 mesh) from Merck, flash chromatography on Biotage Isolera one using silica gel (230–400 mesh) from Merck.
Commercially available solvents of standard quality were used. Starting materials were purchased from either Acros or Sigma-Aldrich and used without any further purification.
Phospholipids were purchased from Avanti Polar Lipids Inc. Commercially available solvents of standard quality were used. If otherwise stated, purification and drying was done according to accepted general procedures. Enzymes were purchased from Sigma Aldrich.
2.4.2 Synthesis of membrane additives used as membrane additives
Zinc complex 1 was synthesized previously according to the published procedure.26 Membrane additives A1, A5, A6, A14, 9-4, A17 were purchased and used as received, compound A12 was recrystallized from ethanol prior to use. Amphiphiles A227, A828, A729,
A630, A1331, A921, A1021, A1121, CF32, TAMRA33 were synthesised according to published procedures. Amphiphiles A3, A1634, 35(Scheme 2.3) were prepared by modified, published procedures.
4-Octadecyloxyphenol (A3)
Octadecylbromide (1.0 g, 3.0 mmol), hydroquinone (1.651 g, 15 mmol) and potassium carbonate (4.14 g, 30 mmol) were suspended in dry acetonitrile (60 ml), heated to 90 °C under nitrogen atmosphere and stirred for 12 h. After cooling, the solvent was evaporated and the residue suspended in water, which was adjusted with aq. HCl to be acidic in pH. The aqueous mixture was extracted with diethylether (3 × 60 ml) and the combined organic layers were dried over magnesium sulphate. Solids were filtered off and the solvent was removed in vacuo. The residue was purified by flash chromatography (PE with a gradient, up to 30%, of EA) to obtain 500 mg (46%) of compound A3 in form of white powder.
Yield: 46%.
Tm: 93 °C (lit 91-92 °C)
1H NMR (300 MHz; CDCl3): δ 6.89 – 6.57 (m, 4H), 3.89 (t, J = 6.6 Hz, 2H), 1.85 – 1.60 (m, 2H), 1.25 (s, 30H), 0.88 (t, J = 6.6 Hz, 3H).
13C NMR (75 MHz; CDCl3): δ 153.35, 149.28, 115.99, 115.58, 68.71, 31.96, 29.73 (7C), 29.69, 29.64, 29.62, 26.45, 29.40 (2C), 26.08, 22.73, 14.17.
MS (ESI(+)):m/z [MH+].
4-Octadecyloxybenzaldehyde oxime
30(A6)
Yield: 76%.
Tm: 84 °C
1H NMR (300 MHz; CDCl3): δ 8.08 (s, 1H), 7.50 (d, J = 8.8 Hz, 2H), 6.89 (d, J = 8.8 Hz, 2H), 3.97 (t, J = 6.6 Hz, 2H), 1.86 – 1.71 (m, 2H), 1.51 – 1.16 (m, 30H), 0.88 (t, J = 6.8 Hz, 3H).
13C NMR (75 MHz; CDCl3): δ 160.70, 150.00, 128.48 (2C), 124.35, 114.76 (2C), 68.13, 31.95, 29.73 (7C), 29.69, 29.62, 29.59, 29.39, 29.19, 26.03, 22.72, 14.15.
MS (ESI(+)): m/z 390.34 [MH+].
Scheme 2.3 Synthesis of 1-octadecylguanidine (A16)
1,3-Bis-(tert-butoxycarbonyl)-2-octadecyl-guanidine (A16-BOC)
Octadecylamine (93 mg, 0.345 mmol) was dissolved in dry DCM (5 ml) and triethylamine (18 mg, 0.172 mmol) was added. The reaction mixture cooled in an ice bath under nitrogen atmosphere. A solution of Goodman's reagent (100 mg, 0.25 mmol) in dry DCM (5 ml) was added drop wise over a period of 5 minutes. The ice bath was removed and the reaction mixture stirred at RT overnight. The solvent was removed under reduced pressure and the residue was purified by column chromatography (EA:PE; 1:10) to obtain 100 mg (56%) of product A16-BOC in form of colourless oil.
1H NMR (300M Hz; CDCl3): δ 3.46 – 3.30 (m, 2H), 1.60 – 1.50 (m, 2H), 1.49 (s, 9H), 1.50 (s, 9H), 1.19 – 1.39 (m, 30H), 0.93 – 0.79 (m, 3H).
13C NMR (75 MHz; CDCl3): δ 156.10, 153.34, 83.01, 41.03, 31.95, 29.85 (9C), 29.60, 29.50, 29.39, 29.29, 28.97, 28.32 (3C), 28.09 (3C), 26.87, 22.72, 14.16.
MS (ESI(+)): m/z 512.44 [MH+].
1-Octadecylguanidine (A16)
Boc protected guanidine A16-BOC (90 mg, 0.16 mmol) was dissolved in dry diethylether (5 ml), a saturated solution of HCl in diethylether (15 ml) was added and reaction mixture was stirred at room temp for 3 days. Solvents were removed in vacuo and the residue was purified by crystallisation from THF to obtain 45 mg (73%) of 1-octadecylgudinium (A16) in form of white crystals.
Tm: 153 °C decomp. (lit36 230.5 °C)
1H NMR (300 MHz; MeOD): δ 3.16 (t, J = 7.1 Hz, 2H), 1.63 – 1.50 (m, 2H), 1.25 – 1.43 (m, 30H), 0.90 (t, J = 6.7 Hz, 3H)
13C NMR (75 MHz; MeOD): δ 42.52, 33.13, 30.83 (9C), 30.75, 30.71, 30.53, 30.40, 29.95, 27.76, 23.79, 14.50.
MS (ESI(+)):m/z 312.34 [MH+].
2.4.3 Synthesis of fluorescein esters
Esters FDA and F-C2 were prepared by known procedures from the anhydrides of the parent acids.37 Esters F-C3, F-C7, F-C15, F-Ph, F-iPr, F-tBu were prepared from chlorides of the acid.
Fluorescein (200 mg, 0.602 mmol, 1 eqv) was suspended in dry toluene (15 ml) followed by addition of carboxychloride (1.204, 2 eqv), triethylamine (0.167 ml, 1.204 mmol, 2 eqv) and DMAP (5 mg). The reaction mixture was stirred under nitrogen atmosphere for 24 h. Solids were filtered off and washed with toluene. Solvent was removed under reduced pressure and the residue was purified two times by flash chromatography (petrolether with gradient, up to 30%, of ethyl acetate) or crystallization.
Fluorescein dibutyrate (F-C3)
Yield: 65%.
Tm: 139 °C (lit37 123 °C)
1H NMR (300 MHz; CDCl3): δ 8.02 (dd, J = 6.5, 1.3 Hz, 1H), 7.73 – 7.54 (m, 2H), 7.21 – 7.12 (m, 1H), 7.08 (dd, J = 1.8, 0.7 Hz, 2H), 6.89 – 6.72 (m, 4H), 2.54 (t, J = 7.4 Hz, 4H), 1.77 (h, J = 7.4 Hz, 4H), 1.02 (t, J = 7.4 Hz, 6H).
13C NMR (75 MHz; CDCl3): δ 171.59, 169.18, 152.9, 152.15, 151.58, 135.33, 130.09, 128.96, 126.11, 125.21, 124.09, 117.80, 116.33, 110.40, 81.73, 36.15, 18.36, 13.62.
MS (ESI(+)): m/z 473.16 [MH+].
Fluorescein dioctanoate (F-C7)
Yield: 77 %.
Tm: 49.3 °C (lit37 49 °C)
1H NMR (300 MHz; CDCl3):δ 8.03 (dd, J = 6.5, 1.3 Hz, 1H), 7.73 – 7.57 (m, 2H), 7.22 – 7.14 (m, 1H), 7.08 (dd, J = 1.9, 0.6 Hz, 2H), 6.88 – 6.74 (m, 4H), 2.56 (t, J = 7.5 Hz, 4H), 1.83 – 1.68 (m, 4H), 1.51 – 1.22 (m, 16H), 0.71 – 0.91 (m, 6H).
13C NMR (75 MHz; CDCl3) δ 171.80, 169.22, 152.94, 152.16, 151.58, 135.30, 130.06, 128.96, 126.12, 125.23, 124.10, 117.78, 116.31, 110.39, 81.76, 34.36, 31.65, 29.03, 28.92, 24.85, 22.61, 14.10.
MS (ESI(+)): m/z 585.28 [MH+].
Fluorescein dipalmitoate (F-C15)
Purified by additional crystallisation from toluene.
Yield: 43%.
Tm: 78 °C (lit37 69 °C)
1H NMR (300 MHz; CDCl3): δ 8.03 (dd, J = 6.5, 1.1 Hz, 1H), 7.74 – 7.55 (m, 2H), 7.18 (d, J = 7.0 Hz, 1H), 7.08 (d, J = 1.4 Hz, 2H), 6.86 – 6.71 (m, 4H), 2.56 (t, J = 7.5 Hz, 4H), 1.84 – 1.66 (m, 4H), 1.50 – 1.13 (m, 48H), 0.88 (t, J = 6.7 Hz, 6H).
13C NMR (75 MHz; CDCl3): δ 171.78, 169.19, 152.96, 152.16, 151.58, 135.28, 130.04, 128.95, 126.13, 125.23, 124.10, 117.78, 116.32, 110.39, 81.74, 34.37, 31.95, 29.75 – 29.66 (bs, 5C), 29.62, 29.48, 29.39, 29.26, 29.09, 24.85, 22.72, 14.16.
MS (ESI(+)): m/z 585.28 [MH+].
Fluorescein dibenzoate (F-Ph)
Yield: 60%.
Tm: 217 °C (lit38 208-210 °C)
1H NMR (300 MHz; CDCl3):δ 8.27 – 8.14 (m, 4H), 8.07 (d, J = 7.1 Hz, 1H), 7.78 – 7.59 (m, 4H), 7.52 (t, J = 7.6 Hz, 4H), 7.31 – 7.16 (m, 3H), 6.95 (dt, J = 17.8, 5.4 Hz, 4H).
13C NMR (75 MHz; CDCl3): δ 169.25, 164.66, 152.99, 152.39, 151.70, 135.40, 134.00, 130.31, 130.14, 129.10, 128.99, 128.72, 126.15, 125.29, 124.17, 117.98, 116.58, 110.66, 81.78.
MS (ESI(+)): m/z 541.13 [MH+].
Fluorescein diisobutyrate (F-iPr)
Yield: 70%.
Tm: 155.6 °C
1H NMR (300 MHz; CDCl3):δ 8.02 (dt, J = 9.5, 5.1 Hz, 1H), 7.73 – 7.55 (m, 2H), 7.21 – 7.13 (m, 1H), 7.07 (dd, J = 2.0, 0.5 Hz, 2H), 6.87 – 6.74 (m, 4H), 2.80 (hept, J = 7.0 Hz, 2H), 1.31 (dd, J = 7.0, 0.6 Hz, 12H).
13C NMR (75 MHz; CDCl3): δ 175.07, 169.23, 152.98, 152.32, 151.59, 135.31, 130.06, 128.94, 126.10, 125.23, 124.08, 117.72, 116.28, 110.33, 81.76, 34.19, 18.87.
MS (ESI(+)): m/z 473.16 [MH+].
Fluorescein dipivaloate (F-tBu)
Yield: 50%.
Tm: 99.6 °C
1H NMR (300 MHz; CDCl3):δ 8.02 (dt, J = 9.9, 5.1 Hz, 1H), 7.73 – 7.55 (m, 2H), 7.20 – 7.10 (m, 1H), 7.06 (t, J = 4.7 Hz, 2H), 6.79 (dt, J = 8.7, 5.4 Hz, 4H), 1.35 (s, 18H).
13C NMR (75 MHz; CDCl3): δ 176.55, 169.26, 153.05, 152.57, 151.58, 135.32, 130.06, 128.91, 126.05, 125.22, 124.04, 117.72, 116.24, 110.32, 81.76, 39.20, 27.08.
MS (ESI(+)): m/z 501.19 [MH+].
2.4.4 Preparation and characterization of the membrane
0 5 10 15
0.1 1 10 100 1000 10000
Intensity (Percent)
Size (d.nm) Size Distribution by Intensity
Record 30: DOPC, 5% cyclen Record 32: DOPC, 10% octadecylamine Record 33: DOPC, 5% cyclen + 10% octadecylamine
0 5 10 15
0.1 1 10 100 1000 10000
Intensity (Percent)
Size (d.nm) Size Distribution by Intensity
Record 34: DSPC, 5% cyclen
Record 35: DSPC, 5% cyclen + 10% octadecylamine Record 36: DSPC, 10% octadecylamine
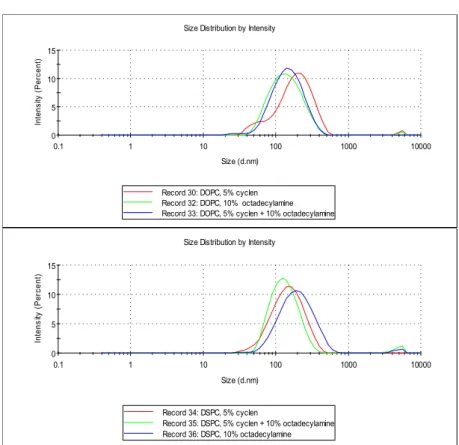
Figure 2.7 Examples of DLS measurement of mixtures made from lipids DSPC, DOPC (0.475 mM) with 5
% of cyclen 1 (0.025 mM), 5 % of cyclen 1 (0.025 mM) + 10 % octadecylamine A14 (0.05 mM) and 10 % octadecylamine A14 (0.05 mM)
Solutions of vesicles were prepared by a well-established procedure.39 Membranes were prepared by sonication or treatment in a thermomixer of emulsions of amphiphiles in 25 mM HEPES (pH = 7.4) buffer for 10-20 min at 70 °C and used with or without an extrusion step.
Micellar solutions were prepared by the same procedure with the exception of no addition of lipids. For each system the catalytic activity was determined and DLS analysis provided the size distribution of the vesicles. Measurements showed that there is only a small difference between the activities of membranes prepared by different procedures. DLS measurements (Figure 2.7) show that differently produced membranes are mostly in the shape of approximately 150 nm vesicles and do not change with composition. All measurements in this publication refer to vesicles prepared by sonication at a temperature higher than the transition temperature of the lipid used without extrusion step.
2.4.5 Determination of cmc value for cyclen 1
0 50 100 150 200 250 300 350
40 45 50 55 60 65 70
Average OFS [mN/m]
Concetration [mg/mL]
Figure 2.8 Isotherm of surface tension of the aqueous solution of Zn complex 1
2.4.6 Calibration curves for fluorescein concentration
0.000 0.002 0.004 0.006 0.008 0.010
0 20000 40000 60000 80000
Buffer
DOPC + 5 %cyclen
Fluorescence units
Fluorescein concentrtion [mM]
Figure 2.9 Fluorescein calibration curves.
The recorded fluorescence corresponds to the fluorescein produced by hydrolysis of FDA. To determine the fluorescein concentration a calibration curve was recorded. In vesicular solutions containing cyclen 1 the intensity of fluorescein is slightly quenched. Linear
regression was applied to determine the slope kbuffer = 1.02 × 10¹⁰ f.u./M and kvesicles = 8.67 × 10⁹ f.u./M, which was used for calculations of pseudo first order kinetic constants. These rates were derived from the linear region of the calibration curve (up to 50 000 fluorescence unit).
Membrane additives and lipids did not change the emission signal in the concentration range of the calibration curve so kvesicles was used in all cases.
2.4.7 Estimated pKa values of membrane additives
Membrane
additives pKa model compound (lit. ref.)
A1
4.76 acetic acid
40A2
8.05 4-acylphenol
40A3
10.20 4-methoxyphenol
40A4
11.16 4-methoxybenzaldoxim
41A5
12.00 methanthiol
40A6
15.54 methanol
40pKa of conj. Acid
A7
0.18 urea
40A8
5.14 pyridine
40A9
6.95 imidazol
40A10
6.95 imidazol
40A11
6.95 imidazol
40A12
9.76 trimethylamine
40A13
9.82 piperazine
40A14
10.62 methylamine
40A15
10.64 dimethylamine
40A16
13.71 guanidin
40Table 2.6 Table of pKa values used as a estimated values for amphiphilic compound.
Compounds with short alkyl chains were chosen for the approximate determination of pKa values of membrane additive used for their sorting in Scheme 2.2.
2.4.8 Kinetic measurements
All the fluorescence measurements were performed in the FLUOstar Omega micro-titre plate reader using excitation filter at 485 nm and emission 520 nm. For every measurement 200 scans were performed over 16 hours. The fluorescein concentration was determined from calibration curves. The observed kinetic hydrolysis constant was calculated from the initial slope of the recorded increase of fluorescence. Each well of the micro-titre plate contained 200 μl of the solution in 25 mM HEPES (pH = 7.4) buffer with a total concentration of the
amphiphiles of 0.5 mM (different lipids and amounts of membrane additives and cyclen) and 0.02 mM of the substrate (FDA). Stock solutions of the ester were made in DMSO: buffer (32:
1) resulting in the presence of 1.5 vol. % of DMSO in all measured solution. The same procedure was used for all fluorescein esters.
For micellar hydrolysis the same solutions and concentrations were used as for vesicles, but the increase of fluorescence concentration was measured with a Cary 50 UV-Vis spectrophotometer. Measurements were performed in 10 mm cuvette and the change of absorption was monitored at λmax = 505 nm for 3 minutes. For evaluation of kobs the published extinction coefficient for fluorescein of 76 900 M-1cm-1 was used.42 All the measurements were repeated and did not exceed 10 % error.
Optimization of bis-Zn-cyclen 1 concentration in the membrane
The amount of embedded zinc-cyclen 1 in DSPC vesicles membranes was varied and the effect on hydrolytic activity determined (Figure 2.10).
Figure 2.10 Hydrolytic activity on different cyclen 1 loading (0−) in DSPC vesicles.
The rate of the hydrolysis reaction increases with the amount of cyclen 1 embedded in the membrane, but decreases again above 10 % cyclen 1 with respect to the lipid. The hydrolysis rate as a function of the amount of complex 1, is highest with 5 mol. % of cyclen in the DSPC membrane. This amount of embedded complex 1 was used for all investigations.
Optimization of membrane additives concentration
The optimal ratio of membrane additive and cyclen for hydrolysis was determined for the DOPC membrane with embedded 5 mol% of bis-Zn-cyclen 1. Addition of more than 10 mol%
of the supplement additive does not change the rate of hydrolysis any more (Figure 2.11).
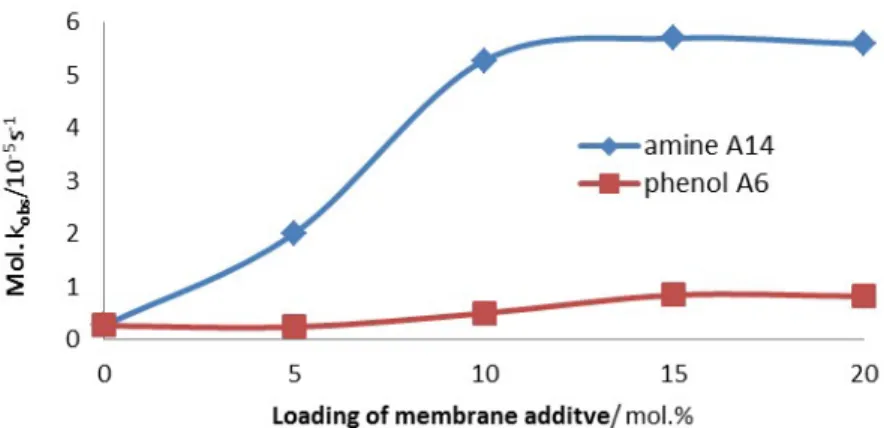
Therefore a ratio of 10 mol% of membrane additive and 5 mol% of cyclen with respect to the lipid was used for all kinetic measurements.
Figure 2.11 Dependence of the hydrolytic activity of 5 mol% bis-Zn-cyclen 1 (0.025 mM) in DOPC membranes with increasing amount of membrane additive A14 and A2 (0−0.1 mM).
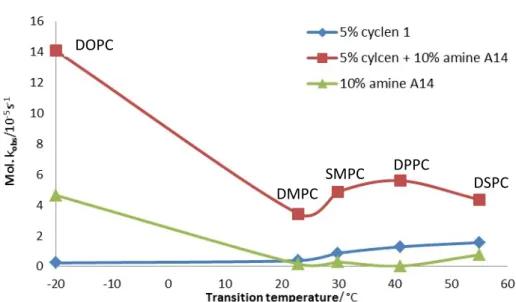
Effect of different lipids
5 % cyclen
1
5 % cyclen 1 + 10 % amine
A14
10 % amine A14 Lipid T
m°C k
obss-1 10-5
k
obss-1 10-5
k
obs0s-1 10-5
DOPC -20 0.23 14.09 4.65
DMPC 23 0.39 3.44 0.16
SMPC 30 0.87 4.89 0.28
DPPC 41 1.29 5.61 0.03
DSPC 55 1.57 4.36 0.77
Table 2.7 Hydrolytic rates of bis-Zn-cyclen 1 containing vesicles, Tm – transition temperature.
Different lipids with different transition temperature were examined for their hydrolytic properties with embedded bis-Zn-cyclen 1 (Figure 2.12, Table 2.7) and membrane additives.
DOPC and DSPC lipids were used for the investigation of the membrane additives as they have a large difference in their transition temperature.
Figure 2.12 Hydrolytic rates of bis-Zn-cyclen 1 (0.025 mM) and/or amine A14 (0.05 mM) containing vesicles made from various lipids compared with transition temperature of their membrane.
Various substrates
Selected functionalized vesicles were tested for their hydrolytic activity for different fluorescein esters.
FDA F-C2 F-Ph F-iPr F-C3 F-tBu F-C7 F-C15
Lipophilicity
a3.20 4.22 4.41 4.93 5.24 5.75 9.31 17.47
DOPC
5 % Cyclen + 10 % A11 10.69 9.07 0.04 4.69 5.54 0.15 0.27 0.48 5 % Cyclen + 10 % 10-2 17.44 12.55 0.11 2.86 4.29 0.07 0.36 0.55 5 % Cyclen 0.27 0.17 0.00 0.07 0.07 0.02 0.01 0.05
DSPC
5 % Cyclen + 10 % A11 6.17 5.25 0.10 3.02 2.99 0.28 0.42 0.96 5 % Cyclen + 10 % 10-2 3.87 3.40 0.17 1.44 2.03 0.64 0.26 0.37 5 % Cyclen 1.57 0.94 0.04 0.48 0.50 0.24 0.10 0.10
Table 2.8 Hydrolytic rates (10-5s-1) of different fluorescein esters using selected membrane systems,a, Lipophilicity was calculated using software ACDlabs.
DOPC
DMPC SMPC DPPC
DSPC
Figure 2.13 Comparison of the ratios of kobs for different fluorescein esters (0.02 mM) hydrolysed spontaneously and by vesicles at
2.4.9 Processing of the kinetic data
Vesicular hydrolysis
For every measurement 200 scans were performed over 16 hours at 25°C. Using pseudo first order conditions the rate constant of hydrolysis (kobs) was derived from the slope of the increasing fluorescein concentration over 20 min (s-1) and the initial concentration of FDA (Figure 2.14).
Figure 2.14 Example of kinetic data used for determination of kobs for DOPC (0.425 mM), 5 mol % cyclen 1 (0.025 mM), 10 mol % oxime A4 (0.05 mM).
Scheme 2.4 Model for saturation kinetics.
The simple model for saturation kinetics can be described by equations (1) and (2):
(1)
(2)
Equation (3) is derived from equations (1) and (2), and was used for non-linear fitting. As concentration of catalyst, the overall cyclen complex 1 concentration in solution was used.
(3)
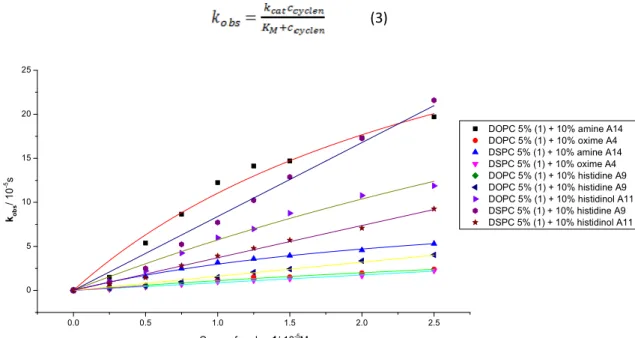
0.0 0.5 1.0 1.5 2.0 2.5
0 5 10 15 20 25
DOPC 5% (1) + 10% amine A14 DOPC 5% (1) + 10% oxime A4 DSPC 5% (1) + 10% amine A14 DSPC 5% (1) + 10% oxime A4 DOPC 5% (1) + 10% histidine A9 DOPC 5% (1) + 10% histidine A9 DOPC 5% (1) + 10% histidinol A11 DSPC 5% (1) + 10% histidine A9 DSPC 5% (1) + 10% histidinol A11 kobs/ 10-5s
Conc. of cyclen 1/ 10-5M
Figure 2.15 Plot of data and fitted curves of for determining the second rate constants for micellar solutions.
The exact molecular reaction mechanism is different from the kinetic model, because two ester groups of FDA need to be cleaved and the substrate·- catalyst complex can consist of several cyclen complexes 1 and membrane additives A.
Micellar hydrolysis
Measurements were performed at 25°C under pseudo first order conditions. The hydrolysis rate constants (kobs) were derived from the slope of increasing fluorescein concentration over 3 min (s-1) and the initial concentration of FDA (Figure 2.16).
Figure 2.16 Kinetic data used for determination of kobs in micellar solution of cyclen 1 and histidine A9.
0.0 0.5 1.0 1.5 2.0 2.5
0 5 10 15 20 25 30 35
Cyclen 1 + histidine A11 Cyclen 1 + histidine A9 Cyclen 1 + amine A14 Cyclen 1
kobs / 10-5 s-1
Conc. of cyclen 1/ M
Figure 2.17 Fitted data of determining the second order rate constants for micellar solutions.
Comparison with enzymes
All the enzymes were purchased from Sigma Aldrich and were used fresh as delivered. Stock solutions of enzymes were made in 25 mM HEPES buffer in concentration 0.5 mg/ml and were used in the same manners as vesicular solutions. Kinetic measurements for obtaining kobs were performed similarly as for vesicular solutions (Figure 2.18). Same conditions and
models were applied for processing the data; weight concentrations instead of molarities were used. For comparison with the enzymatic KM values the data for vesicle solutions were recalculated from molar activity to mass activity considering the composition 85 mol % DOPC, 5 mol % cyclen 1, 10 mol % A14 by the equation (4).
(4)
0.00 0.05 0.10 0.15 0.20 0.25
0 20 40 60 80 100 120 140 160
Esterase from porcine liver 15 U/mg
Lipase from Candida Rugosa 700 U/mg
kobs/ 10-5s-1
Concetration of enyzme [mg/ml]
Figure 2.18 Kinetic data for enzymes.
Control experiments
All functional groups of the amphiphilic compounds were tested for their hydrolytic properties in homogeneous solution. For this purpose the corresponding molecules lacking the alkyl chain (Scheme 2.5) were tested under the same conditions as the amphiphilic samples (Table 2.9).
Scheme 2.5 Water soluble non-amphiphilic derivatives of Zn-cyclen complexes and membrane additives.
None of these compounds induced noticeable hydrolytic activity in comparison to the spontaneous hydrolysis of the FDA in buffer (Table 2.9).
Compound kobs
s-1 10-5
B1
0.003
B2
0.006
B3
0.0035
B4
0.004
B5
0.003
B6
0.004
B7
0.003
B8
0.005
5 mol % cyclen*
0.24
DOPC only
0.005
Buffer only
0.003
Table 2.9 Initial rates of samples prepared using same method, but non amphiphilic molecules of membrane additives and cyclen 1. For comparison the hydrolysis rates for bis- Zn-cyclen 1 in DOPC membrane (*) and spontaneous hydrolysis in buffer under identical conditions are given.