Report No. 21
South Asia: Human Development Unit
Findings from the Bhutan Learning Quality Survey
January 2009
47204
Public Disclosure AuthorizedPublic Disclosure AuthorizedPublic Disclosure AuthorizedPublic Disclosure Authorized
Discussion Paper Series
Discussion Papers are published to communicate the results of the World Bank’s work to the development community with the least possible delay. The typescript manuscript of this paper there fore has not been prepared in accordance with the procedures appropriate to formally edited texts. Some sources cited in the paper may be informal documents that are not readily available.
The findings, interpretations, and conclusions expressed herein do not necessarily reflect the views of the International Bank for Reconstruction and Development / The World Bank and its affiliated organizations, or those of the Executive Directors of the World Bank or the governments they represent.
The World Bank does not guarantee the accuracy of the data included in this work. The boundaries, colors, denominations, and other information shown on any map in this work do not imply any judgment on the part of The World Bank concerning the legal status of any territory or the endorsement or acceptance of such boundaries.
ACKNOWLEDGEMENTS
This report is based on a large school survey funded by the Education Policy Development Fund (EPDF). The survey was carried out under the supervision of the World Bank and with the assistance of Cambridge Education Consultants, represented by Marion Young. The survey and report were prepared by Corinne Siaens and Sangeeta Goyal in the Human Development unit of the World Bank’s South Asia Region, under the guidance of Michelle Riboud, Education Sector Manager, and Alastair J. McKechnie, Country Director.
The constructive comments of the peer reviewers, Christel Vermeersch, Alberto Rodriguez, and Venkatesh Sundararaman significantly improved the report. Mark La Prairie helped invaluably by coordinating the research with RGoB's efforts on improving education quality. Julie-Anne Graitge, Gertrude Cooper and Savita Dhingra efficiently handled the processing of the survey and report.
The report team benefited greatly from collaborative work with the RGoB counterpart team. The RGoB team included representatives of the National Education Assessment Committee, the Education Review Committee, the Bhutan Board of Examinations, the Ministry of Education and the Education Secretary Sangay Zam during a workshop in October 2007 in Thimphu on preliminary findings of the report.
LIST OF ACRONYMS
B. Ed. Bachelor of Education
BLSS Bhutan Living Standard Survey GER Gross Enrolment Rate
IRT Item Response Theory
MDG Millennium Development Goal MoE Ministry of Education
NEA National Education Assessment
NER Net Enrolment Rate
OLS Ordinary Least Squares Regression PP Pre-Primary PTR Pupil Teacher Ratio
RGoB Royal Government of Bhutan
SBIP School Based Improvement Program TCERT Teacher Certificate for Primary Education
VHW Village Health Worker
EXECUTIVE SUMMARY
1. This report presents findings of a nationally representative learning survey conducted in grades 2 and 4 of public and private schools in Bhutan. The report presents observed learning levels and reports on various school, teacher and child related characteristics that are correlated with test scores as an indicator of learning achievement.
2. A sample of approximately two thousand and four hundred students in grades 2 and 4 was tested in three subjects – Dzongkha (the national language), English and Mathematics. Both grades were given the same tests. Information on child, school, teacher and village characteristics was collected for the purposes of correlating factors influential for learning.
3. The typical child in grade 2 has mastered the basic competencies that are expected of that grade within the context of the Bhutanese curriculum in Dzongkha, English and Mathematics. The typical child in grade 4 has attained average or mastery level competence in all competencies expected to be attained at the end of grade 4 in Dzongkha, English and Mathematics.
4. In Bhutan, school and teacher as well as student characteristics are important for education outcomes. This analysis shows that variation in school and teacher quality is correlated with a maximum of about 50 percent of variation in test scores, even after controlling for child and family background characteristics. The remaining variation in performance is within schools and relates to students’ background heterogeneity or ability.
5. Characteristics of schools matter along a number of different dimensions.
Teachers play a particularly important role. Students in schools with a higher share of female teachers have significantly higher test scores in grade 2. A higher share of teachers who have attended the School Based Improvement Program training or the upgrade training is associated with higher scores.
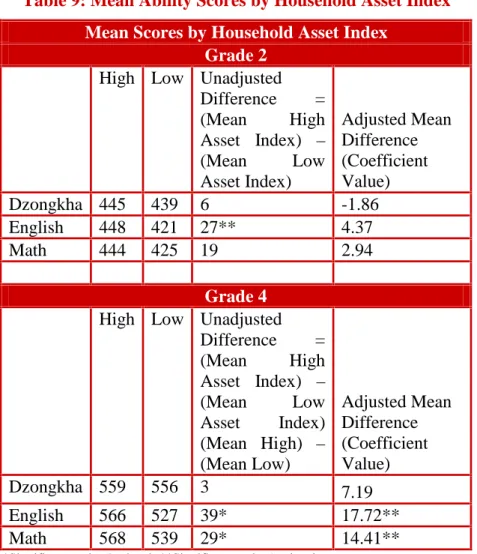
6. Among observable child related characteristics, gender is not significantly correlated with test scores. The difference in test scores between wealthier or better educated families is small once school characteristics are controlled for, but does remain to a certain extent. Father’s literacy is not significantly correlated with any test scores and mother’s literacy is only significantly and positively correlated with math scores in grade 2. Household wealth is significantly correlated with higher test scores for English and Mathematics in grade 4 only.
7. A child’s age is negatively correlated with learning outcomes. For an older child, the opportunity cost of a child’s time becomes higher, and many children work. For girls in particular, social norms become more constraining. These factors put pressure on children to be less devoted to school and eventually to leave school.
8. Teacher absence is a pervasive problem in public schools of developing countries.
This study asked parents whether teachers attended school regularly and came to school on time to judge teacher presence in schools. Seventy percent of the parents in the survey said that teachers attended school regularly and ninety percent of the parents said that teachers came to school on time. Further analysis showed that there is a clustering of parental response at the school level – there are some schools with more severe problems with teacher absenteeism.
9. The following policy implications emerge from this study: (a) educational attainment of children can be improved by interventions aimed at schools at the teacher level as well as at the household level; (b) performance can be improved by ensuring more teachers undergo the SBIP training and by taking the upgrade training for the higher level classes; (c) performance can be improved by hiring more female teachers, (d) performance can be increased by helping children to attend the right grade for their age;
and (e) the issue of teacher absence may be of concern in some schools.
TABLE OF CONTENTS
ACKNOWLEDGEMENTS... i
LIST OF ACRONYMS ...ii
EXECUTIVE SUMMARY ...iii
TABLE OF CONTENTS... v
LIST OF TABLES... vi
I. Introduction ... 1
II. Background and Context... 3
Overview of Bhutan’s Educational Progress and Current Challenges ... 3
Enrolment in Primary School ... 3
Schools and Teachers... 4
III. Theoretical and Empirical Literature on Education Quality... 5
IV. Sampling Design, Sample Description and Empirical Methodology ... 7
V. Objectives, Competencies and Learning Outcomes ... 8
Curriculum Objectives and Tests... 8
What Do Children Know? ... 9
Scaled Scores ... 13
VI. Findings from Multivariate Regression Analysis ... 16
Analytical Framework for Multivariate Analysis ... 16
Empirical Results... 16
Child and Family Background Effects... 19
Dzongkhag and Village Effects ... 23
VII. Teachers and the Education Process ... 27
Who Are Bhutan’s Teachers? ... 27
Teacher Motivation in Bhutan ... 29
VIII. Summary, Policy Implications and Research Recommendations... 30
Summary of Findings of the Study ... 30
Policy Implications and Recommendations for Future Research ... 31
REFERENCES ... 33
Annex 1: Descriptive Statistics... 35
Annex 2: Regression Results ... 38
Annex 3: Construction of the Household Asset and School Infrastructure Indices... 44
LIST OF TABLES
Table 1: Children’s Knowledge in Dzongkha ... 10
Table 2: Children’s Knowledge in English... 11
Table 3: Children’s Knowledge in Mathematics ... 12
Table 4: Mean Ability Scores (All Schools)... 14
Table 5: Distribution of Scaled Scores for each Subject and Grade... 15
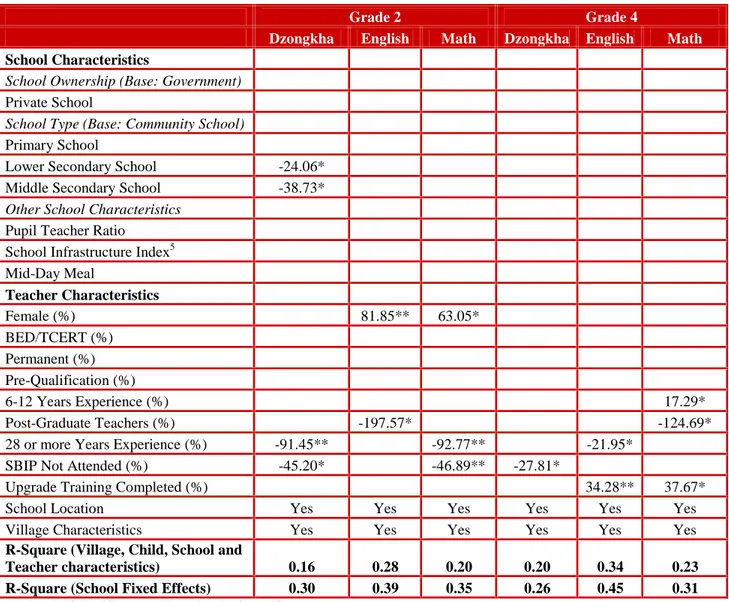
Table 6: Coefficients of school characteristics ... 19
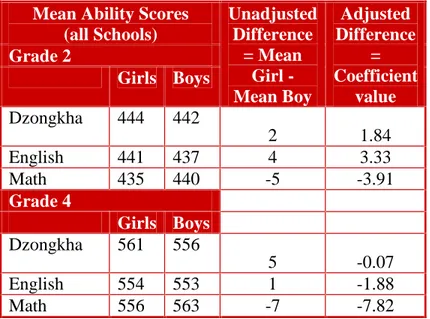
Table 7: Unadjusted and Adjusted Difference in Tested Scores by Gender... 21
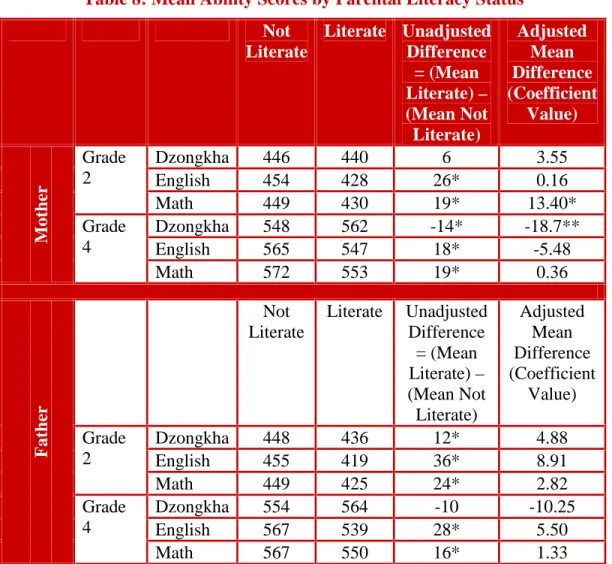
Table 8: Mean Ability Scores by Parental Literacy Status ... 22
Table 9: Mean Ability Scores by Household Asset Index ... 23
Table 10: Dzongkhag Effects ... 24
Table 11: Village Effects ... 26
Table 12: Profile of Teachers across School Categories ... 28
Table 13: Parents’ Responses on Teacher Attendance and Arrival ... 29
Table A1: School Characteristics – Descriptive Statistics... 35
Table A2: Teacher Characteristics – Descriptive Statistics ... 35
Table A3: Village Characteristics – Descriptive Statistics ... 36
Table A4: Child Characteristics – Descriptive Statistics ... 37
I. Introduction
1. In a globalizing world, knowledge and skills are the drivers of economic and social well-being. Ensuring universal participation in education has been the primary objective of developing countries in the past decades but now education quality is gradually moving towards centre-stage. Evidence shows that the quality of education – usually analyzed by test scores results as a proxy for quality – contributes to higher rates of economic growth and personal incomes; education policy reformers in developing countries are increasingly seeking to improve education quality. While the gaps in years of schooling completed are narrowing between children in developing and developed countries, gaps in actual knowledge of children are large and growing (Hanushek and Woessman, 2006).
2. The education sector in Bhutan has been growing steadily since the 1960s and concomitantly the literacy rates of the population have also been steadily going up over time. The mostly mountainous country regards education as central to its national development. Every cohort has seen an increasing share of children going to school and the education system now strains to keep up with the speed with which enrolment has expanded over the last ten years, in-line with Bhutan’s commitment to meet the education Millennium Development Goals (MDGs).
3. The need to improve education quality has become a priority for education policy- makers and reformers in the country and there is widespread public concern over a perceived decline in education quality. The Ministry of Education (MoE) is making concerted efforts to improve education quality along a number of dimensions, including:
teacher quality; infrastructure; facilities; and curricula. To measure and monitor education quality, Royal Government of Bhutan (RGoB) has established a new assessment system called the National Education Assessment (NEA). In 2003, grade 6 students were tested on a pilot basis in English and Mathematics, and in 2005, another set of grade 6 students were tested in Dzongkha, the national language. Similarly, grade 10 students were tested on a pilot basis in English and Mathematics in 2006 and in Dzongkha in 2007. The two grades will again be tested in each subject five years later to determine changes in learning achievement and to assess how that change relates to improvements in education quality undertaken by RGoB between the two cohorts.
4. Early grades of primary school (and early childhood education) are critical years for the development of cognitive skills among children (Heckman 2007, Heckman and Cunha, 2007). At the time of this report, the quality for primary education earlier than grade 6 (the terminal primary school grade) cannot be assessed on a system-wide basis.
5. The Bhutan Learning Quality Survey (BLQS) of schools that is discussed in this report provides an opportunity to examine quality of education in early grades in primary school for the first time. The survey includes students test scores in Dzongkha, English and Mathematics, and information on the characteristics of the schools, teachers, and child and family background characteristics of the students who are being tested. This allows us to measure the extent of correlation of the learning outcomes of students with a wide variety of factors.
6. More specifically, the survey allows us to:
(a) to estimate learning levels in primary education – in particular, to test children in grades 2 and 4 in Dzongkha, English and Mathematics;
(b) to identify factors correlated with differences in student achievement;
and
(c) to understand the extent to which each source contributes to difference in learning achievement.
7. A large body of research in both developed and developing countries robustly conclude that the main factors involved in the production of education are school, teacher, child and family characteristics. Empirical methods used in this paper allow for a break down of the total variation in scores attributable to each factor. Differences in school/teacher quality explain a fairly large share of variation in test scores. This underscores the importance of instituting appropriate school- and teacher-based policies to raise achievement. The survey also tries to answer the question of the extent to which observable characteristics of schools and teachers explain school and teacher quality.
Apart from school and teacher related factors, a child’s family background characteristics are also systematically correlated with learning to a large extent in Bhutan - more so than in many other developing countries.
8. This report is structured as follows: Section II presents the background and context of Bhutan’s education system; Section III discusses previous theoretical and empirical literature on education quality; Section IV describes the sampling design methodology, the sample and empirical methodology used in this study; Section V presents findings on students’ actual knowledge in three subjects and their corresponding scaled scores; Section VI presents the results of multivariate regression analysis for estimating school, teacher and child related correlates of learning outcomes; Section VII profiles teachers in grades 2 and 4 and the education process; and Section VIII concludes with brief summary, discussion of policy implications, and recommendation for future research.
II. Background and Context
Overview of Bhutan’s Educational Progress and Current Challenges1
9. Education has historically been a priority sector for the Royal Government of Bhutan. Bhutan, located between India and China, is a small country with a mostly mountainous terrain and thinly dispersed population. Providing universal education of good quality in this context is a challenging task.
10. Since the country’s first Five-Year Plan in 1961, RGoB has made considerable investments to promote and expand modern education alongside monastic education.
Participation levels in education have progressively risen as a result and literacy rates have increased tremendously over the last half-century. According to the Bhutan Living Standard Survey (BLSS) 2003, the overall literacy rate for the population aged 6 years and above was 42.9 percent. The male literacy rate was 53.9 percent, whereas the female literacy rate was 32.8 percent. Bhutan’s remarkable progress in education participation can be inferred from the fact that according to the BLSS 2003, the literacy rate for the 10- 14 years age-group was 75.3 percent, whereas it was only 12.8 percent for the population over age 60.
11. The speed with which Bhutan has increased its stock of human capital has been remarkable, especially compared to its neighbors in the South Asia region. The percentage of 15-19 year olds that have completed at least grade 5 was 57 percent for Pakistan (2001), 65 percent for Nepal (2002-03) and 77 percent for India (2004) (Riboud, Savchenko and Tan, 2007). In 2003-04, nearly half of all 15-19 year olds in the country had completed at least grade 5. As early as twenty years ago, only a tiny portion of all children attended school in Bhutan.
Enrolment in Primary School
12. The primary school cycle in Bhutan consists of seven years from pre-primary (PP) to grade 6. The official age of entry for children into PP is six years and graduation from the primary cycle is at age 12. Since 1991, school enrolment has increased at the rate of six to seven percent annually. The primary gross enrolment rate (GER) increased by 21 percent from 2003 to 2006 and the net enrolment rate (NER) increased by nearly 18 percent in the same period (World Bank; 2005, 2007). The gender gap in school participation has narrowed considerably over the years. Since 2001, girls have constituted over 46 percent of those in school across all levels of schooling (World Bank 2005).
13. Lower NER in primary education is due to several endogenous factors: (a) schools are not always located close to children’s homes, given Bhutan’s mountainous terrain; many children must walk considerable distances to reach school each day, so they do not start school at the official age of six years; and (b) there are high repetition rates.
The primary repetition rate in 2002 was 12.9 percent overall -- 13.5 percent for boys and 12.3 percent for girls (UIS Global Education Database, 2006).
1Information for this section is mostly taken from Current Human Development Outcomes in Bhutan:
Analysis Using the 2003 BLSS, Report No: 32273-BT, The World Bank, 2005.
Schools and Teachers
14. Bhutan provides free basic education for its children from PP to grade 10. Primary grades are offered in community schools, primary schools, and lower and middle secondary schools. The majority of schools in Bhutan are owned and run by the government, but there is a small sector of privately-owned schools. At present, under the general education system in Bhutan, there are:
ƒ 249 community primary schools;
ƒ 83 primary schools;
ƒ 87 lower secondary schools; and ƒ 37 middle secondary schools.
ƒ There are also 16 private primary schools (MoE, RGoB, 2007).
15. The official norm for deployment of teachers in Bhutan is a pupil-teacher ratio (PTR) of 32:1. As of 2007, there were 5,027 teachers in community, primary, lower and middle secondary schools teaching 146,046 students that implies an average pupil- teacher ratio (PTR) of 29:1. This ratio is lower than the norm, but is also inclusive of all students and teachers, including those grades above the primary level (grades 7 to 12) (MoE, RGoB, 2007). This ratio may not, however, be reflective of true class sizes.
16. The share of trained teachers in public schools is relatively high, while female teachers constitute considerably less than half of all teachers. In 2002, the percentage of teachers with training was 91.6 percent; female teachers comprised 36.1 percent of all teachers (UIS Global Education Database, 2006).2
2In the data on which this report is based, average share of female teachers is 42 percent of primary level teachers.
III. Theoretical and Empirical Literature on Education Quality
17. World-wide experience with education reforms shows that there is no ‘one-size- fits-all’ approach to improve education quality. There are, however, some elements that are widely accepted as basic to any well-functioning education system. These elements interact with the social, political and economic context in which the system operates to produce education outcomes.
18. Research from both developed and developing countries show that education policy that focuses only on increasing school resources has not succeeded in improving education quality. Simply increasing school budgets, reducing class-sizes or providing more teacher-training has not delivered the desired increases in learning outcomes. The implication of this research is that the level and distribution of resources are key in determining ease of access to schools equipped with adequate infrastructure and materials, located in close proximity to children’s homes, staffed with adequate numbers of qualified teachers. The absence of conveniently located schools and a lack of teachers in sufficient numbers act as deterrents to participation in education, especially for girls and young children. If the institutional structure and accountability systems within which schools operate are weak, increased resources will not achieve the desired impact at the margin. The quality of service delivery is as much, if not more important, than levels of financial and material resources.
19. The quality of service delivery is a complex issue, and especially contingent on the behavior and performance of education providers, particularly teachers. The role of teachers in ensuring that children learn is critical. Education policy concerning teachers mostly focuses on teacher education and training, teacher reward systems that determine who becomes and remains a teacher, and teacher performance in the classroom. The challenge for policy-makers is to attract qualified and motivated individuals who will consistently perform well in the classroom over the years they remain in the profession.
20. In general, public education systems in developing countries reward teachers on the basis of their education, training and experience. In most empirical research, findings show that the correlation between these teacher characteristics and students’ learning outcomes are either weak or non-existent. It is generally agreed that teacher incentives for improved performance in public education systems are weak (Dixit et al, 2002). These are reflected in the very high rates of absenteeism for teachers that have been reported from a large group of developing countries. Performance is also affected by the large amounts of time spent by teachers on non-teaching activities (Chaudhury et al 2004;
PROBE 1998). The onus to perform, therefore, largely resides with teachers that are motivated to perform. Teacher motivation alone, however, may not be sufficient or reliable to sustain or improve teacher performance and, consequently, student learning achievement.
21. No education system has been able to devise the perfect reward system to align the objectives of teachers and children. Performance or merit-pay systems have generated mixed results. It is argued by some that pay increases to compensate the teacher for the extra risk undertaken by them to improve outcomes may not be cost-effective, given that the child plays a large role in producing results (Eberts et al, 2002). In a randomized
experiment in the southern Indian state of Andhra Pradesh, performance bonuses for teachers led to an increase of 0.15 of a standard deviation in test scores. Moreover, the incentive program was highly cost-effective compared to the status-quo (Muralidharan and Sundararaman, 2006). Professional status and social prestige associated with one’s profession also act as incentives for entry into and performance in a profession. Prestige and status associated with teaching, in general, rank lower than other professions requiring similar qualifications. Increasing prestige and status accorded to the teaching profession poses challenges that cannot be addressed quickly or easily.
22. There are examples of education systems that have proved better than others in teacher performance and education outcomes. A new report by McKinsey and Co. looks at common factors that characterize the best education systems in the world (such as education systems in Finland, Canada, Japan, Singapore and South Korea). The systems are very different from each other in many respects, yet appear to have the following common features with regard to teachers:
(a) they recruit the brightest graduates as teachers;
(b) admission into teacher training is very competitive; and
(c) there are early and frequent intervention to bring lagging students up to par with others.
23. The recruitment of the best graduates as teachers does not seem to require higher salaries. Due to stringent selection criteria, teaching is a high status profession in these countries. These countries also focus on teacher professional development that takes place largely in schools.
24. Children’s individual, family and community background characteristics are also key inputs into the production of learning outcomes. Some research in developing countries has found that girls are less likely to enroll in schools at the appropriate age.
Age at first entry can also have an effect both on completed years of education and on learning outcomes. Some cognitive skills are best developed early on and children may miss out on establishing solid foundations for learning due to late entry. The age-grade combination for a child may also deviate from the norm due to grade repetition. Late entry and grade repetition can induce children to drop-out due to: (a) the increasing opportunity cost of the child’s time with age; and (b) disaffection with learning.
25. Among household characteristics that influence educational outcomes in developing countries, children with literate parents generally tend to have better learning outcomes (Filmer, King and Pritchett, 1997), as is the case for children who come from economically better-off households.
IV. Sampling Design, Sample Description and Empirical Methodology
26. The study is based on analysis of a school survey conducted in May-June 2007.
The survey tested children in grades 2 and 4 in three subjects – Dzongkha, English and Mathematics. It also collected information on the characteristics of villages, schools, teachers, students and their family background.
27. The school survey was designed to be nationally representative and covers all dzongkhags (districts) in the country. It covers a total of 120 schools, including 42 community primary schools, 32 primary schools, 32 lower secondary schools, 10 middle secondary schools and 4 private primary schools. Schools are located in urban areas (37), semi-urban areas (32), semi-rural areas (36), rural areas (12) and remote rural areas (3).
The sample is representative of small schools and large schools and was approved by the Ministry of Education. The survey collected data in every primary school (or secondary schools having primary grades) of the selected village clusters in rural areas.
28. Each dzongkhag was officially informed of the schools selected to facilitate data collection. District Education Officers informed head teachers of schools of the survey team’s visit to solicit their cooperation. However, head teachers were not informed of the specific date of the visit to avoid bias introduced by prior preparation.
29. In each school in the sample, 20 students were randomly selected from grades 2 and 4, ten students from each grade. If a school had more than one class for a grade, first a class was randomly chosen and then students were randomly selected from that class.
While the desired sample size was 2,400 child-level observations, the achieved sample had 2,359 observations. In cases where schools had fewer than ten children in either grade 2 or grade 4, enumerators implemented a within school adjustment by including more children from other classes of the same grades if that was possible. Children in schools with a total number of students lower than 20 were not replaced (however, there were very few such schools). Tables A1-A4 in the annex provide complete descriptive statistics of the sample data.
30. Students from both grades 2 and 4 were administered the same tests in the three subjects and the tests were conducted for the whole group of students in the sample in each school. Apart from testing the students, the survey collected information on the school facility and interviewed teachers of students who were part of the sample. Data was also collected on the family background and other personal characteristics of the students in the sample.
31. The empirical methodology for this study consists of multivariate analysis with learning outcomes as the dependent variable and village, school, teacher and student characteristics as the independent variables. The statistical model used is Ordinary Least Squares Regression (OLS); and a series of models are developed for estimating the correlations between school, teacher and student characteristics and student learning outcomes.3
3 Data analysis was conducted using STATA 9.0 which is a statistical analysis software package.
V. Objectives, Competencies and Learning Outcomes
32. This section examines what children in grades 2 and 4 actually know by looking at how well they do on various competencies. Each subject is examined by:
a. The percentage of children by grade who answer specific test items (aligned to a competency) correctly.
b. Learning outcomes by grade in terms of summary scaled scores. These are scores for aggregate performance on a test which lie on a scale that corresponds to underlying ability of the student.
Curriculum Objectives and Tests
33. Bhutan’s general education system prescribes the acquisition of basic skills in literacy and numeracy in grades PP to grade 3. Three subjects are taught in these grades – Dzongkha, English and Mathematics. A fourth subject, Science, is added for Grades 4 to 8.
34. For this study, children were tested in three subjects – Dzongkha, English and Mathematics. Tests were based on basic competencies in these three subjects for grade 2 and grade 4 as prescribed by the Bhutan National Curriculum. A local Bhutanese technical expert assisted the lead consultant responsible for developing the test instruments. Two rounds of piloting were completed before the test instruments were finalized.
35. The test in each subject covered the range of competencies from the simple to the complex. Some test items were beyond the curriculum for grade 2 but within the bounds of prescribed competencies for grade 4. To minimize biases and distortions in administering and marking tests, it was decided that test items would be multiple-choice questions. Due consideration was given to the lack of familiarity of Bhutanese school children with the multiple-choice test format. The members of the survey field team were given intensive training and guided on how to explain the test format to the children when administering the tests.
36. The tests used in this study fall in the category of criterion-referenced tests that are designed to test a student’s achievement of particular skills in different areas of knowledge. Information generated by criterion-referenced tests can be used to describe students’ mastery of a particular skill such as, for example, spelling or long division.
Criterion referenced tests (see Box 1) can tell school administrators how many students in a particular grade have mastered skills prescribed in the curriculum.
Box 1: Criterion Referenced Tests
What Do Children Know?
37. This sub-section examines what children actually know by looking at how well they do on various competencies in Dzongkha, English and Mathematics.
What do children know in Dzongkha?
38. Dzongkha is the national language of Bhutan and also the language of instruction for some subjects at lower primary levels in public schools. The items used for Dzongkha tested six competencies: word recognition; word construction; vocabulary; grammar;
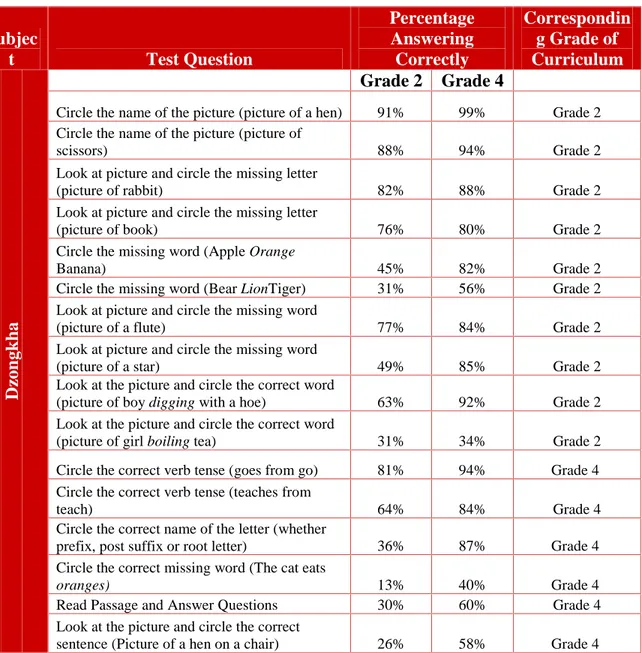
sentence construction; and reading comprehension. Table 1 below shows what percentage of children in each grade answered particular test items correctly. It also shows the grade for which the competency is prescribed by the curriculum.
39. Grade 2: For test items corresponding to grade 2 curricula, between 88 to 91 percent of students can circle the names of pictures. Between 76 to 82 percent of students can identify the missing letter in a word corresponding to a picture shown. A greater percentage of students are able to circle missing words or correct words where pictures are shown; between 31 to 77 percent of students respond correctly to these items.
Students do less well when they have to fill in a missing like word where pictures are not shown – between 31 to 45 percent of students answer such test items correctly. In items prescribed for grade 4, students perform better at circling correct verb tense (between 64 to 81 percent correct) than at circling correct names or the letter or missing words (between 13 to 36 percent). A third of students (30 percent) are able to read a simple passage and answer questions; a fourth (26 percent) of students can see a picture and match it with the correct sentence.
40. Grade 4: A higher percentage of grade 4 students respond correctly to all the questions than grade 2 students. Between 80 to 99 percent of the students respond correctly to picture-related questions, for circling the name of the picture and circling missing letters. For questions without pictures, between 56 to 82 percent of students respond correctly. For items corresponding to the grade 4 curriculum, between 84 to 94 percent of students circled correct verb tenses and the correct name of a letter. Only 40 percent of students were able to correct the missing word in the sentence “The cat eats oranges”. Only around 60 percent of students are able to read a simple passage and
Criterion-referenced tests use the objectives and goals set by the curricular framework as a guide for the development of test items for each grade and subject. The objectives and goals of the curriculum are analyzed to determine the subordinate skills that are required to achieve them. Subordinate skills are further separated into prerequisite and enabling categories. Other types of tests include norm-referenced tests and scholastic aptitude tests.
answer questions; around 58 percent of students can see a picture and match it with the correct sentence.
Table 1: Children’s Knowledge in Dzongkha
Subjec
t Test Question
Percentage Answering Correctly
Correspondin g Grade of Curriculum Grade 2 Grade 4
Circle the name of the picture (picture of a hen) 91% 99% Grade 2 Circle the name of the picture (picture of
scissors) 88% 94% Grade 2
Look at picture and circle the missing letter
(picture of rabbit) 82% 88% Grade 2 Look at picture and circle the missing letter
(picture of book) 76% 80% Grade 2 Circle the missing word (Apple Orange
Banana) 45% 82% Grade 2
Circle the missing word (Bear LionTiger) 31% 56% Grade 2 Look at picture and circle the missing word
(picture of a flute) 77% 84% Grade 2 Look at picture and circle the missing word
(picture of a star) 49% 85% Grade 2 Look at the picture and circle the correct word
(picture of boy digging with a hoe) 63% 92% Grade 2 Look at the picture and circle the correct word
(picture of girl boiling tea) 31% 34% Grade 2 Circle the correct verb tense (goes from go) 81% 94% Grade 4 Circle the correct verb tense (teaches from
teach) 64% 84% Grade 4
Circle the correct name of the letter (whether
prefix, post suffix or root letter) 36% 87% Grade 4 Circle the correct missing word (The cat eats
oranges) 13% 40% Grade 4
Read Passage and Answer Questions 30% 60% Grade 4
Dzongkha
Look at the picture and circle the correct
sentence (Picture of a hen on a chair) 26% 58% Grade 4
What do children know in English?
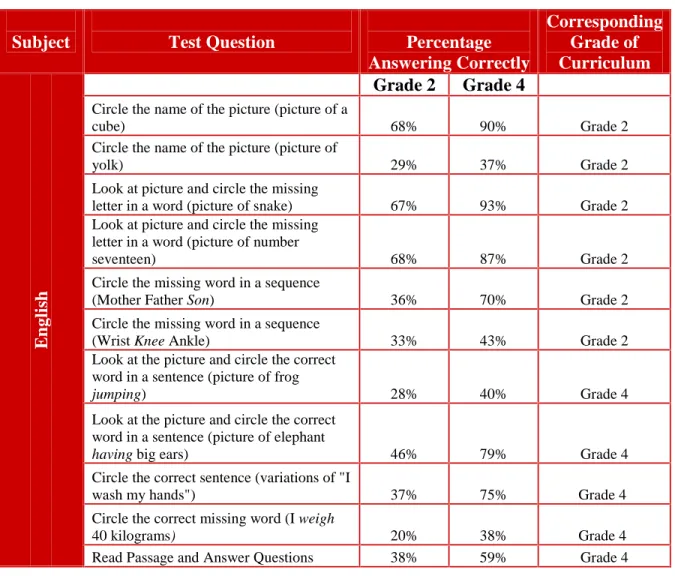
41. The six competencies tested in the English language are the same as those tested for Dzongkha. These competencies include: word recognition; word construction;
vocabulary; grammar; sentence construction; and reading comprehension. The percentage of students responding correctly to a test item by grade is set out in Table 2.
Table 2: Children’s Knowledge in English
Subject Test Question Percentage
Answering Correctly
Corresponding Grade of Curriculum Grade 2 Grade 4
Circle the name of the picture (picture of a
cube) 68% 90% Grade 2
Circle the name of the picture (picture of
yolk) 29% 37% Grade 2
Look at picture and circle the missing
letter in a word (picture of snake) 67% 93% Grade 2 Look at picture and circle the missing
letter in a word (picture of number
seventeen) 68% 87% Grade 2
Circle the missing word in a sequence
(Mother Father Son) 36% 70% Grade 2 Circle the missing word in a sequence
(Wrist Knee Ankle) 33% 43% Grade 2 Look at the picture and circle the correct
word in a sentence (picture of frog
jumping) 28% 40% Grade 4
Look at the picture and circle the correct word in a sentence (picture of elephant
having big ears) 46% 79% Grade 4
Circle the correct sentence (variations of "I
wash my hands") 37% 75% Grade 4 Circle the correct missing word (I weigh
40 kilograms) 20% 38% Grade 4
English
Read Passage and Answer Questions 38% 59% Grade 4
42. Grade 2: 68 percent of grade 2 students correctly pick the right word for the picture of a cube but only 29 percent do so for the picture of yolk. About 67-68 percent correctly picked out the right letter to complete words naming pictures shown. Between 33-36 percent were able to correctly complete a sequence of related words. In items prescribed for grade 4, between 28-46 percent correctly responded to items that included pictures. Between 20-37 percent were able to correct sentences and missing words. More than a third of students, or 38 percent, was able to read a passage and answer questions.
43. Grade 4: A higher percentage of grade 4 students responded correctly to all test items compared to grade 2. Around 90 percent were able to correctly pick the right word and letter in a word for pictures shown. Only 37 percent were able to pick the right word for yolk (which may be an unfamiliar word for the total sample as only 29 percent of grade 2 students got this correct). Between 87-93 percent correctly picked out the right letter to complete words naming pictures shown. Between 43-70 percent were able to correctly complete a sequence of related words. For items prescribed for grade 4, between 40-79 percent correctly responded to those that included pictures. Between 38-
75 percent were able to correct sentences and missing words. Only 59 percent of students were able to read a passage and answer questions about it.
What do children know in Mathematics?
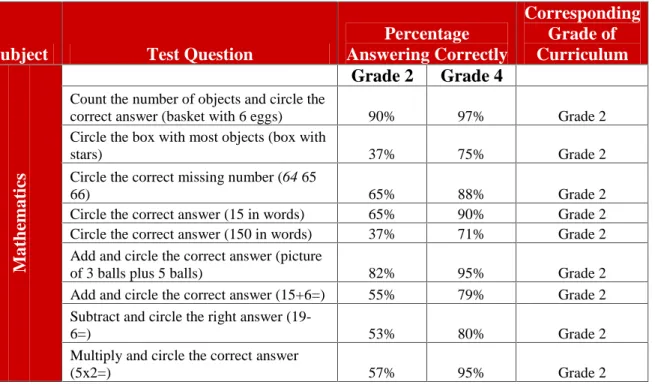
44. Nine competencies were tested in Mathematics, ranging from the simple to the more complex. These competencies were: counting; addition; subtraction; multiplication;
division; fractions; data; deductive; and measurement analyses. Table 3 provides the results.
45. Grade 2: 90 percent of grade 2 students are able to count and circle the right number of objects in the picture but only 37 percent correctly responded to counting and circling the highest number of objects. 65 percent of students could circle the correct missing number in a sequence. 65 percent of students were able to pick out the correct number in words when the number was 15 (in words) but only 37 percent could do so when the number was 150 (in words). Between 53-82 percent of students were able to correctly do simple addition, subtraction and multiplication. More complicated questions – all prescribed for grade 4 – were correctly answered by between 22-39 percent of students.
46. Grade 4: A higher percentage of students in grade 4 correctly responded to all test items compared to grade 2. 75-97 percent of students are able to count and circle the correct number of objects in the picture. Only 71 percent of students are able to pick out the right word when the number shown is 150. Between 56-95 percent of students are able to correctly do simple addition, subtraction and multiplication. More complicated questions – all prescribed for grade 4- were correctly answered by between 46-91 percent of students.
Table 3: Children’s Knowledge in Mathematics
Subject Test Question
Percentage Answering Correctly
Corresponding Grade of Curriculum Grade 2 Grade 4
Count the number of objects and circle the
correct answer (basket with 6 eggs) 90% 97% Grade 2 Circle the box with most objects (box with
stars) 37% 75% Grade 2
Circle the correct missing number (64 65
66) 65% 88% Grade 2
Circle the correct answer (15 in words) 65% 90% Grade 2 Circle the correct answer (150 in words) 37% 71% Grade 2 Add and circle the correct answer (picture
of 3 balls plus 5 balls) 82% 95% Grade 2 Add and circle the correct answer (15+6=) 55% 79% Grade 2 Subtract and circle the right answer (19-
6=) 53% 80% Grade 2
Mathematics
Multiply and circle the correct answer
(5x2=) 57% 95% Grade 2
Subject Test Question
Percentage Answering Correctly
Corresponding Grade of Curriculum
Multiply and circle the correct answer
(11x?=110) 23% 56% Grade 2
Divide and circle the correct answer
(4÷2=) 29% 49% Grade 2
Circle the correct answer for the shaded part of the picture (a circle with a quarter
shaded) 39% 68% Grade 4
Circle the correct answer (1/4 ÷ 1/4=) 25% 58% Grade 4 Look at the picture and circle the correct
answer (clock face showing 9 0' clock) 63% 91% Grade 4 Circle the heaviest of weights below
(picture of balances) 22% 46% Grade 4 Area Questions (The length of a picture
shown) 32% 52% Grade 4
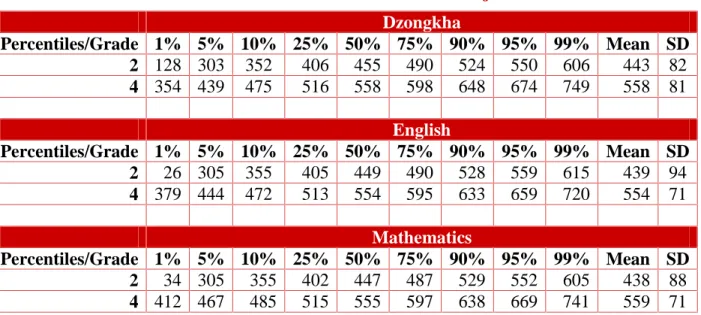
Scaled Scores
47. Scaled scores are a useful way of summarizing performance compared to raw scores (percentage correct). Scaled scores take into account the difficulties of the various test items that were answered correctly by a student and therefore successfully discriminate between the actual knowledge differences between students. For this study, the raw scores of the student were converted into scaled scores using the methodology prescribed by Item Response Theory (IRT) for weighing the various test items and assigning an aggregate score to each child based on questions correctly answered. (See Box 2 below for a brief explanation of IRT). The IRT scores have been constructed so that the average child will have a score of 500 and the standard deviation of the distribution of the scores is 100.
Box 2: Item Response Theory (IRT)
Learning Outcomes in Terms of Scaled Scores
48. The mean and standard deviations of ability scores by grade and subject are shown in Table 4 below for all students in the sample. The mean ability score in grade 2 ranges from 438-443 for the three subjects with standard deviations ranging from 82-94
IRT is a body of theory that describes the use of mathematical models on data from test questionnaires to measure skill achievement. The models of IRT allow computation of the probability of correct response on an item based on person and test-item parameters. Person related parameters can be underlying ability or aptitude. Test-item related parameters can include characteristics such as item difficulty, how well the item discriminates between low and high ability persons for a given level of difficulty, and a probability of guessing the correct answer.
points; the mean ability score for grade 4 ranges from 554-559 for the three subjects with standard deviations ranging from 71-81 points.
49. The IRT scores for students in the two grades for all the subjects are consistent with findings on how students perform on actual competencies. A t-test of the differences in the mean scores across the two grades was significant at the 5 percent level; this implies that moving up grades makes a significant difference to learning levels.
Table 4: Mean Ability Scores (All Schools)
Dzongkha English Math
Grade 2 443 439 438
Standard Deviation (82) (94) (88)
Grade 4 558 554 559
Standard Deviation (81) (71) (71)
(Mean Grade 4) – (Mean Grade 2) 115* 115* 121*
*Significant at 5% level
Distribution of Students on Scaled Scores
50. The scaled scores also provide a basis for making comparisons of the distribution of achievement levels across grades. Grade-to-grade comparisons are made by examining both the growth in scaled scores and the percentage of students in different proficiency categories across the two grades. It is important to keep in mind the fact that this is a comparison of different groups of students across two grades. A shift in the distribution of scores in the higher grade will be the net result of low ability students dropping out before they reach the higher grade and greater learning that takes place as students reach higher grades.
51. Table 5 on the next page shows the IRT ability scores achieved by students at different percentiles of the student distribution. The percentiles shown in the table are 1st, 5th, 10th, 25th, 50th, 75th, 90th, 95th and 99th. The 50th percentile is the median of the distribution. The mean and standard deviation of scores are also shown in the table. The relationship of the median to the mean and the size of the standard deviation describe skew and degree of heterogeneity of performance.
52. The patterns of score distributions are similar across subjects for each grade. The lowest 1 percent of grade 2 students scores more than 3 standard deviations below the average student and the top 10 percent score more than 1 standard deviation above the average student. For grade 4, the lowest 1 percent of students scores less than 1 standard deviation below the average student and the top 25 percent score more than 1 standard deviation above the average student.
53. The distribution of scores shifts to the right for grade 4 compared to grade 2. The first percentile of grade 4 has scores comparable to the 10th percentile of grade 2 (at around the 300 mark, or 2 standard deviations below the average student in grade 4). A student situated between the 75th and the 90th percentile of grade 2 has scores at about the
500 mark; this compares to a student of grade 4 who crosses the 500 mark between the 10th and the 25th percentile.
Table 5: Distribution of Scaled Scores for each Subject and Grade Dzongkha
Percentiles/Grade 1% 5% 10% 25% 50% 75% 90% 95% 99% Mean SD 2 128 303 352 406 455 490 524 550 606 443 82 4 354 439 475 516 558 598 648 674 749 558 81
English
Percentiles/Grade 1% 5% 10% 25% 50% 75% 90% 95% 99% Mean SD
2 26 305 355 405 449 490 528 559 615 439 94
4 379 444 472 513 554 595 633 659 720 554 71 Mathematics
Percentiles/Grade 1% 5% 10% 25% 50% 75% 90% 95% 99% Mean SD 2 34 305 355 402 447 487 529 552 605 438 88 4 412 467 485 515 555 597 638 669 741 559 71
VI. Findings from Multivariate Regression Analysis
Analytical Framework for Multivariate Analysis
54. In this section, multivariate regression analysis is used to identify the correlates of learning outcomes in schools. The analysis is done at the level of the individual child with the IRT score as the dependent variable.
55. The analysis is done separately for each grade and subject. Two principal models have been estimated with: (1) ability scores regressed on school attended as the only independent variable (school fixed effect); and (2) ability scores regressed on dzongkhag in which the school is located, village characteristics, school characteristics and child and family background characteristics. The results for (1) and (2) are set out in Tables R1-R2 in the annex.
In the second model, achievement of student i in school j Yij is modeled as a function of individual and family background characteristics Xij, a vector of school and teacher characteristics Sjwhich is constant across students from the same school, and a random error term εij such that
ij j ij
ij X S
Y =α +β +λ +ε ; where εij~ N(0,σ2)
Empirical Results School Effects
56. It is now widely accepted that differences in school and teacher quality are the most critical factors in determining differences in student achievement. A standard way of estimating school quality is to use school fixed effects in regression equations.
Coefficients on school dummies are interpreted as estimates of school quality. The explanatory power of the equation (measured by the adjusted R-square) is the total variation in test scores explained by variation in school quality. The remaining unexplained variation is due to within school heterogeneity and noise in the data.
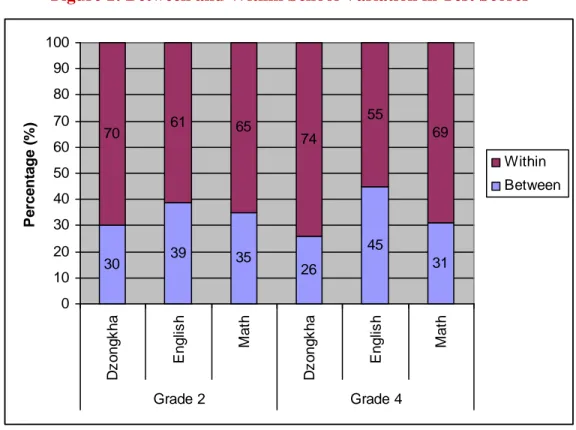
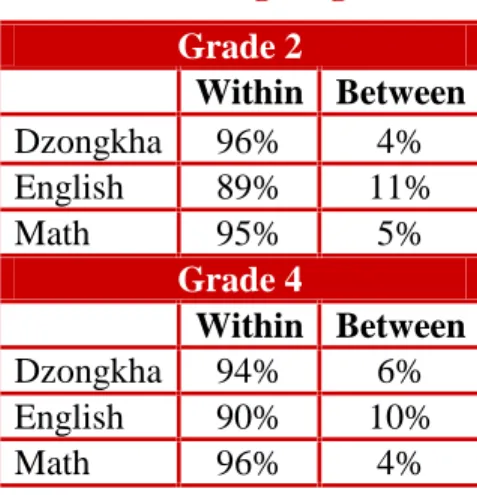
57. School quality differences account for a maximum of about half of the total variation in test scores. Figure 1 below represents graphically the extent of variation in test scores due to differences in quality between schools; the remaining that is ‘within’
school variation is attributable to within school heterogeneity among students and to noise in the data4. The figure shows that differences in school quality explain 25-45 percent of variation in test scores. Note that the explanatory power of a model with school fixed effects to which some child and family background characteristics are added is not much higher, although we do not show such regression results in this paper. Figure
4Figure 1 is drawn from regression results presented in the annex tables R1 to R2, where only the school attended is used as control.
1 also shows that school quality differences for both grades 2 and 4 are more important for English and Mathematics. To compare quality differences across grades by subject:
(a) for Dzongkha and Mathematics, between school differences decline marginally from grade 2 to grade 4; and (b) for English, differences in school quality become more important in the higher grade.
Figure 1: Between and Within School Variation in Test Scores
30 39 35
26
45
31
70 61 65
74
55
69
0 10 20 30 40 50 60 70 80 90 100
Dzongkha English Math Dzongkha English Math
Grade 2 Grade 4
Percentage(%)
Within Between
58. This result is different from the findings from studies conducted in other developing countries, such as India and Pakistan. Differences in school quality account for a much higher share of the variation in test scores - between 60-70 percent in the case of India, and more than 70 percent in the case of Pakistan (World Bank, 2007; Goyal 2006a, Goyal 2006b, Siaens, 2008). While between-school variation is substantial in Bhutan, within school variation in test scores tends to be the dominant factor in all three subjects. The policy implications should necessarily take into account both sources of variation for raising educational attainment.
What Constitutes School Quality? The Impact of Observable School Characteristics 59. It is necessary to go a step further than determining that the school is an important factor for educational attainment and identify characteristics of schools that make them more or less effective. In this analysis, school fixed effects were replaced by a set of observable school characteristics: average pupil-teacher ratio (PTR) in the primary sections of the school; a school infrastructure index; the availability of school mid-day- meals; and average teacher characteristics in primary classes, including gender, the nature of teacher contracts, education, experience and training. This analysis was carried out separately for each subject and grade.