279 Chapter 9
9 Is Secondary School Teacher Judgment Accuracy Related to the Development of Students’ Reading Literacy?
1Constance Karing, Maximilian Pfost, and Cordula Artelt
Summary
The present work focuses on the relation between teacher judgement accuracy and the development of students’ reading literacy and whether this relation is moderated by instructional variables. Longitudinal data were obtained from a sample of 502 students and their 40 German language teachers in the context of the BiKS-8-14 longitudinal study (measurement points: at the ends of Grade 5 and
1 The results reported in this book chapter rely on the article „Is there a relationship between lower secondary school teacher judgment accuracy and the development of students’ reading and mathematical competence?“ by Constance Karing, Maximilian Pfost, and Cordula Artelt, published first in the Journal for Educational Research Online (Karing, Pfost & Artelt, 2011).
Die in diesem Beitrag berichteten Ergebnisse beruhen im Wesentlichen auf dem Artikel „Hängt die diagnostische Kompetenz von Sekundarstufenlehrkräften mit der Entwicklung der Lesekompetenz und der mathematischen Kompetenz ihrer Schülerinnen und Schüler zusammen?“ von Constance Karing, Maximilian Pfost und Cordula Artelt, zuerst veröffentlicht im Journal for Educational Research Online (Karing, Pfost & Artelt, 2011).
Author Note Constance Karing,
Department of Research Synthesis, Intervention and Evaluation, University of Jena, Germany.
Maximilian Pfost,
Department of Educational Research, University of Bamberg, Germany.
Cordula Artelt,
Department of Educational Research, University of Bamberg, Germany.
This research was supported by grant AR 301/6-1 & AR 301/6-2 from the German Research Foundation (DFG).
Correspondence concerning this chapter should be addressed to Constance Karing, Department of Research Synthesis, Intervention and Evaluation, Humboldtstraße 26, 07743 Jena, Germany. E-mail: constance.karing@uni-jena.de
Grade 6). Teacher judgement accuracy was measured by the task-specific hit rate and the rank-order component. German language teachers showed a moderate hit rate (M = 0.66). For the rank-order component, we found a mean correlation of
̅ = .19. Multilevel analyses revealed a significant positive relation between the task- specific hit rate and the development of students’ reading literacy. Furthermore, this significant relation was moderated by instructional variables such as teachers’
use of structural cues and the degree to which lessons were individualized. A high task-specific hit rate in combination with a high degree of individualization of lessons was significantly associated with an increased development in students’
reading literacy. However, a high task-specific hit rate in combination with a low frequency of structural cue use during lessons was also significantly related to an increase in the development of students’ reading literacy. For the rank-order component, no significant positive relations or interactions were found in the domain of reading. Altogether, these findings support the assumption that teachers’ diagnostic competence in combination with instructional variables is positively related to an increase in the development of students’ reading literacy.
The implications of these findings for research and practice are discussed.
Theoretical Background
Teachers’ diagnostic sensitivity is seen as a crucial factor for successful teaching (Helmke & Schrader, 1987; Weinert, Schrader, & Helmke, 1990). Accurate judgments of students’ cognitive understanding and achievement as well as of the difficulty level of tasks and questions are required for planning and delivering instructions (Artelt &
Gräsel, 2009; Helmke, Hosenfeld, & Schrader, 2004; Rogalla & Vogt, 2008; Schrader, 2011). In particular, accurate judgments are important to be able to adapt one’s teaching to the students’ characteristics (Helmke & Schrader, 1987; Schrader &
Helmke, 2001). For example, the failure to adapt learning materials or instructions to the students’ level of knowledge could lead to less learning success as well as to demotivation among students (Schrader, Helmke, Hosenfeld, Halt, & Hochweber, 2006).
Research investigating judgment accuracy usually differentiates between three different components of teacher judgment accuracy: the rank-order component, the
level component, and the component of differentiation (e.g., Schrader & Helmke, 1987; Spinath, 2005; Südkamp, Möller, & Pohlmann, 2008) because measuring accuracy by only one global component results in a confusion of different judgment biases (Helmke & Schrader, 1987; Helmke et al., 2004). According to Helmke and colleagues (2004), the rank-order component is regarded as the core component of teacher judgment accuracy. This component describes the accuracy with which teachers are able to judge the rank order between their students. The rank-order component is operationalized as a correlation between teacher judgments and students’ actual performance at the class level. This means that a high rank-order component is achieved if the teacher can rank his or her students in the same order as is indicated by the students’ achievement on a standardized competence test. Most previous studies have shown a moderate correlation between student achievement and teacher judgments of student achievement (e.g., Hoge & Coladarci, 1989: Mdn r = .66;
Südkamp, Kaiser, & Möller, 2012: Mdn r = .53). However, these studies found large variability among teachers in their judgment accuracy.
In addition to the “classic” components of teacher judgment accuracy, another component, the task-specific hit rate, can be operationalized. This component includes an exact comparison of teacher judgment and students’ actual performance at the item level (see Karing, Matthäi, & Artelt, 2011). Thus, the task-specific hit rate takes into account whether teacher judgment and students’ actual performance are in agreement or not. This component is based on task-specific judgments of individual students.
Teachers have to compare student ability with the difficulty levels of tasks. In order to achieve a high task-specific hit rate, teachers need good knowledge about the individuals as well as good knowledge about the tasks’ characteristics. This means that there is an overlap between teachers’ diagnostic competence, content knowledge, and pedagogical content knowledge (Helmke, Hosenfeld, & Schrader, 2003; Karing et al., 2011). Little research has actually taken this component into account. For example, Coladarci (1986) found that elementary school teachers correctly judged 73% of their students’ answers in the domain of reading. A similar result for elementary school teachers was found by Demaray and Elliott (1998), who reported that the teachers accurately gauged 79% of their students’ answers in the domain of reading. Findings from the COACTIV study (Brunner, Anders, Hachfeld, & Krauss, 2011) showed a
different picture of secondary school teachers. In this study, a task-specific hit rate of only 51% was obtained for mathematics teachers. However, beyond the differences between the studies in the reported mean accuracy level, all studies showed considerable differences between teachers regarding their judgment accuracy of students’ performance.
Relevance of Teacher Judgment Accuracy for Students’ Learning Success
According to Helmke and Schrader (1987), one prerequisite for effective teaching is the ability to adapt one’s teaching to the characteristics of one’s students (e.g., appropriate difficulty levels for tasks and questions, optimal instructional events). In order for teachers to adapt their teaching behavior to individual differences among students, they must have adequate diagnostic knowledge about students’ abilities as well as about the difficulty levels of tasks and questions. Thus, the combination of accurate teacher judgments and adequate instructional techniques should be critical for successful teaching (Haag & Lohrmann, 2007; Helmke & Schrader, 1987;Ingenkamp, 1992; Schrader & Helmke, 2001). Despite the assumption that teacher judgments play an important role in effective teaching, it is surprising that only a few empirical studies have thus far examined the relation between teacher judgment accuracy and students’ learning success. These studies have been restricted to the domain of mathematics and have shown heterogeneous results. In the study by Helmke and Schrader (1987, see also Schrader, 1989), secondary school teacher judgment accuracy was not related in general to the development of mathematical competence in lower academic track students in Grade 5. Teacher judgment accuracy was operationalized as the correlation between teachers’ predicted scores for individual students and students’ actual performance on a mathematics test (rank-order component). However, a significant interaction between teacher judgment accuracy and the frequency of structural cue use as well as individualized supportive contact was found: Students’ learning success was highest when high judgment accuracy was combined with high instructional quality (high frequency of structural cue use or supportive individual contact). Teachers’ use of structural cues included, among other things, attention-regulating comments emphasizing important information and teachers’ supportive individualized contact as reflected by teachers’ individual contact
with their students during class work (e.g., giving students tips or answering their questions). Taken together, teacher judgment accuracy was important for students’
learning success but only after taking teachers’ instructional practices into account.
Lehmann and colleagues (2000) found a positive relation between teachers’ accuracy in judging the difficulty levels of mathematics tasks (rank-order component) and students’ mathematical competence at least for some grades and school types. A similar result was obtained by Anders and colleagues (2010; see also Brunner et al., 2011). In their study, teacher judgment accuracy was investigated using two indicators.
First, the accuracy of secondary school teachers in estimating the difficulty levels of mathematics tasks in their classes (task-related bias as the mean absolute value between the actual proportion of correct answers in class and teacher judgments) and, second, their accuracy in judging the rank order of different students with regard to the students’ mathematical achievement (rank-order component). The authors found a significant relation between the two indicators and the development of students’
mathematical competence from Grade 9 to Grade 10. Furthermore, the relation between teachers’ accuracy in judging the difficulty levels of mathematics tasks and students’ learning success was mediated by teachers’ cognitive activation potential in mathematics instruction. Thus, a higher accuracy in judging the difficulty levels of mathematics tasks was related to a higher cognitive activation potential, which, in turn, had a positive influence on the development of students’ mathematical achievement.
However, this was not found for the relation between the rank-order component and the development of students’ mathematical competence.
Research Questions
As outlined above, the research that has been conducted in this area so far has focused in particular on the rank-order component, thus neglecting other measures of teacher judgment accuracy. Furthermore, studies that took the task-specific hit rate into account were restricted to elementary school teachers. Finally, little research has actually been conducted on the relation between teacher judgment accuracy and students’ learning success and this research has been restricted to the domain of mathematics. Consequently, the following research questions will be addressed in this chapter:
1. How research hypothe judgme 2. Is th reading for stud that bo develop 3. Is th reading individu (1987;
judgme modera
Figure 1 develop instruct
w accurately h (e.g., Col esized, for ent accuracy ere a relatio literacy? B dents’ learn
th indicato pment of stu
he relation literacy ualization a
see also S ent accurac ated by inst
1. The expe pment of st tional varia
y can teach ladarci, 198
both comp y.
on between ased on the ning succe ors of teach
udents’ rea between te moderated and structur Schrader, cy and th tructional v
cted relatio udent read bles (path b
ers judge st 86; Demara ponents, th
teacher jud e assumpti ss (e.g., Br her judgme ading literac acher judgm
by instru ral cues? In
1989), we e developm ariables (se
on between ing literacy b).
tudents’ rea ay & Elliott hat teacher
dgment accu ion that tea runner et a ent accurac cy (see Figu ment accur uctional v line with t predicted ment of s ee Figure 1
teacher jud (path a), w
ading litera t, 1998; Ho rs would ex
uracy and t acher judgm
al., 2011; K cy would b ure 1, path racy and th ariables su the findings that the tudents’ re , path b).
dgment acc which might
cy? In line oge & Colad
xhibit a m
the developm ment accura Kuntze, 200
be positivel a).
he developm uch as te s by Helmk
relation b eading lite
curacy and t t be modera
e with prev darci, 1989 moderate to
ment of stud acy is impo 06), we exp
ly related t
ment of stud eachers’ us
ke and Sch between tea
eracy woul
the
ated by sev vious 9), we high
dents’
ortant ected o the
dents’
se of rader acher ld be
veral
Method
Participants
Longitudinal data were obtained from a sample of 502 students and their 40 German language teachers at the ends of Grade 5 (T1) and Grade 6 (T2) in the context of the BiKS-8-14 study. The German language teachers were on average 46.5 years old (SD = 12.0) at T1 and had 17.8 years of teaching experience (SD = 11.1). More than half of these teachers were female (57.5 %).
The student sample consisted of 294 (58.6%) females and 208 (41.4%) males. Their mean age at T1 was 11.4 years (SD = 0.4). About 15% of the students had immigration backgrounds. The students attended 29 secondary schools (lower, middle, and higher academic tracks) across Germany (28 secondary classes in Bavaria, 12 in Hesse). Ten percent of the students were from the lower academic track (“Hauptschule”), 12.5%
were from the middle academic track (“Realschule”), and 77.5% were from the higher academic track schools (“Gymnasium”).
Instruments
Student variables.
Reading literacy. To assess students’ reading literacy, we used sample texts with 43 multiple-choice items at the end of Grade 5 and sample texts with 31 multiple-choice items at the end of Grade 6. The reading tests were developed by the BiKS research group. For the reading literacy tests, the students had to read a given text, search the text for relevant information, and make more or less high inferences from the text to answer the given items. These tests were linked by a common item design with nonequivalent groups (anchor-item test design; see Holland, Dorans, & Petersen, 2007;
Kolen & Brennan, 2004) to obtain a common metric of the individual reading literacy estimators. First, for all the reading literacy items at T1, the item difficulty parameters were estimated within an Item Response Theory framework (1-parameter Rasch model) by using the ConQuest software package (Wu, Adams, Wilson, & Haldane, 2007). Subsequently, every item difficulty parameter was fixed to guarantee a common metric of the individual reading literacy estimator. The individual student’s ability was estimated by Weighted Likelihood Estimates (WLEs). In the next step, for all the
reading literacy items at T2, the item difficulty parameters were estimated by using the fixed item difficulty parameters from T1 (separate estimation), and WLEs were estimated for students’ ability at T2. With regard to the criterion validity, a correlation of r = -.39 between the reading literacy test and German grades at T1 was obtained. At T2, a correlation of r = -.40 was found. The internal consistency (Cronbach’s alpha) of the test was satisfactory at both measurement points (αT1= .79, αT2= .82).
General cognitive abilities. At the end of Grade 5, students’ general cognitive abilities were measured by a set of 15 items from the matrices subtest of the CFT-20-R (German version, Weiß, 2006). This test assessed the ability to recognize and solve problems of figural relations and of formal figural reasoning with different levels of complexity. The tasks contained a 2x2 or 3x3 matrix, but one cell was left blank. The student had to fill in the correct answer by choosing one out of five provided alternatives. According to the test manual, the psychometric properties of the test are acceptable (the correlation between the matrices subtest and the total test score is r = .82).
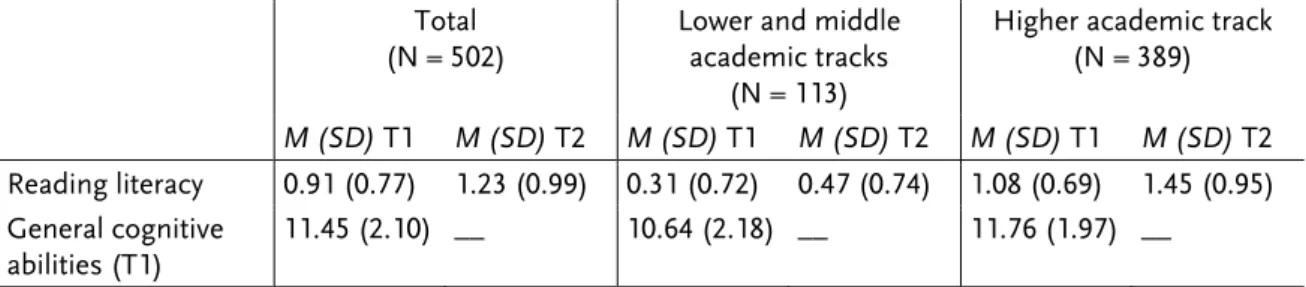
Table 1. Means and Standard Deviations (SD) of Students' Competence for the Total Sample and for the Different School Types in Grade 5(T1) and Grade 6 (T2)
Total (N = 502)
Lower and middle academic tracks
(N = 113)
Higher academic track (N = 389) M (SD) T1 M (SD) T2 M (SD) T1 M (SD) T2 M (SD) T1 M (SD) T2 Reading literacy 0.91 (0.77) 1.23 (0.99) 0.31 (0.72) 0.47 (0.74) 1.08 (0.69) 1.45 (0.95) General cognitive
abilities (T1)
11.45 (2.10) __ 10.64 (2.18) __ 11.76 (1.97) __
Note. For reading literacy, WLE scores are depicted; for general cognitive abilities, raw scores were used.
Socioeconomic status. Students’ socioeconomic status was measured using the International Socio-Economic Index of Occupational Status, which is based on family members’ income and educational background (ISEI; Ganzeboom, De Graaf, &
Treiman, 1992). The ISEI scale ranges from 16 (low socioeconomic status) to 90 (high socioeconomic status). For the present study, we used the highest socioeconomic status in the family (HISEI). The mean HISEI at T1 of the analyzed sample was
M = 55.8 (SD = 16.7), whereas the national average HISEI was M = 47.6 in 2008 (Mikrozensus 2008; see Nold, 2010).
Teacher variables.
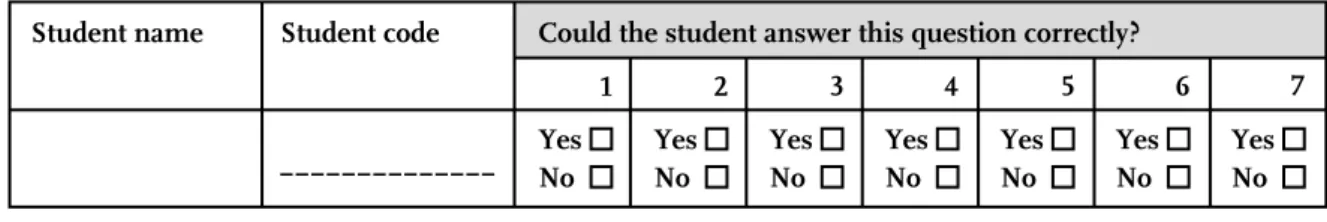
Teacher judgment accuracy. Teacher judgment accuracy of students’ reading literacy was assessed in Grade 5 using a questionnaire that contained one reading literacy text with seven multiple-choice items and the judgment measures. This reading literacy text was chosen because of good item discrimination values and item difficulty values (with low, medium and high difficulty items). To reduce the workload for the teachers, we randomly selected seven students from each class. Teachers were asked to indicate whether each of the randomly selected students would pass (coded as 1) or fail (coded as 0) each item on the reading literacy test (see Figure 2).
Figure 2. The judgment form on which the teacher indicated whether each of the students would pass or fail each item.
On the basis of these judgments, two indicators of teacher judgment accuracy - the rank-order component and the task-specific hit rate - were calculated. The rank-order component was computed as the correlation between teacher judgment and students’
actual performance at the class level. Teacher judgment was computed by summing the number of items that the teacher had judged the student would pass (each coded as 1). A measure of each student’s performance was formed by summing each student’s correct answers (each correct answer was coded as 1). The task-specific hit rate was computed by summing the number of items for which a teacher’s judgment and a student’s actual performance were in agreement and then dividing by the number of items (see Karing et al., 2011, and the Appendix).
Teachers’ use of individualization during lessons. The degree of individualization of lessons was measured in Grade 5 by a short scale consisting of four items (adapted
from Clausen, 2002). The Likert-type response scale ranged from 1 (I disagree) to 4 (I agree). An example item is: “Depending on students’ abilities, they are given tasks with different difficulty levels.” Cronbach’s alpha was α = .85, indicating a satisfactory internal consistency.
Teachers’ use of structural cues during lessons. The use of structural cues during lessons was assessed by three items in Grade 5. An example item is: “I summarize the lesson so they can remember the gist” (adapted from Rakoczy, Buff, & Lipowsky, 2005, and self-developed items). The Likert-type response scale ranged from 1 (never) to 4 (very much). Internal consistency for the scale was satisfactory, reaching α= .80.
Table 2. Means and Standard Deviations (SD) for Instructional Variables
(Individualization, Structural Cues) for the Total Sample in Grade 5 and for the Different School Types
Total Lower and middle academic tracks
Higher academic track
t
M (SD) M (SD) M (SD)
Individualization 2.28 (0.74) 2.84 (0.82) 2.07 (0.59) 3.29*
Structural cues 3.43 (0.71) 3.79 (0.40) 3.30 (0.76) 2.01# Note. Total: N = 40. Lower and middle academic tracks: N = 11. Higher academic track: N = 29.
# p < .10. * p < .05.
Statistical Analyses
To test the second and third research questions, the nested structure of the data (students are nested within classes) had to be taken into account. Multilevel analyses were applied because they integrate analyses between the student and class levels (Raudenbush & Byrk, 2002). HLM 6.08 software (Raudenbush, Bryk, Cheong, &
Congdon, 2004) was used as a tool for multilevel analyses. Random intercept fixed- slope models were estimated. The method of estimation was restricted maximum likelihood. For the analyses, continuous variables were z-standardized. The variable indicating the school track was dummy-coded (0 = lower and middle academic tracks, 1 = higher academic track). The lower and middle academic tracks were combined into one category because of their small sample sizes.
The dependent variable in all models was students’ reading literacy in Grade 6. First, the intercept-only model was computed to determine the intraclass correlation.
Second, we specified a model that included only a set of control variables that typically affect reading literacy (Baumert & Schümer, 2001; Drechsel & Artelt, 2007; Hornberg, Valtin, Potthoff, Schwippert, & Schulz-Zander, 2007; Retelsdorf & Möller, 2008;
Schaffner, Schiefele, & Schneider, 2004) and which were also used as controls on the individual level in the multilevel context in the study by Anders and colleagues (2010).
Control variables at the student level (Level 1) consisted of general cognitive abilities at T1, HISEI at T1, and gender and reading literacy at T1. At the second level, the class level, school type was controlled. Third, the rank-order component and the task-specific hit rate were included separately at the second level in the model to examine the relation between teacher judgment accuracy and the development of students’ reading literacy. Then, to test whether this relation was moderated by instructional variables, median splits were computed for both instructional variables (individualization:
Mdn = 2.25; structural cues: Mdn = 3.67). Finally, within each subsample (low and high degree of individualization, low and high frequency of structural cue use), the influences of the rank-order component and the task-specific hit rate on reading literacy were analyzed separately while controlling for reading literacy at T1, cognitive abilities, HISEI, gender, and school type.
Missing values at the student level were imputed (m = 5) by using the multiple imputation module in the SPSS software package. All analyses were run five times, and the estimated results were automatically integrated by the HLM software.
Results
1. How Accurately do Teachers Judge Students’ Reading Literacy?
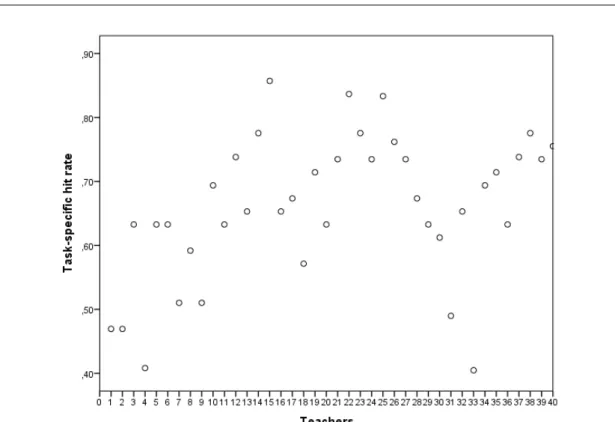
German language teachers showed a mean task-specific hit rate of M = 0.66 (SD = 0.11), meaning that they correctly judged 66% of their students’ answers in the domain of reading. For the rank-order component, a mean correlation of ̅ = .19 (SD = 0.51) in the domain of reading was found. The results for teacher judgment accuracy are presented in Table 3. The standard deviations for the two indicators of teacher judgment accuracy of students’ reading literacy indicated that there was large
variability among teachers in their judgment accuracy (see Table 3 as well as Figures 3 and 4).
Table 3. Teacher Judgment Accuracy: Task-Specific Hit Rate and Rank-Order Component in Grade 5
M SD Min Max
Task-specific hit rate 0.66 0.11 0.40 0.86
Rank-order component .19 0.51 -.85 .93
Note. N = 38 - 40 teachers. For the rank-order component, the average correlation was computed using Fisher’s Z transformation.
Figure 3. Teachers’ judgment accuracy: task-specific hit rate.
Theoretical Range: Min = 0, Max = 1.00.
Figure 4. Teachers’ judgment accuracy: rank-order component.
Theoretical Range: Min = -1.00, Max = 1.00.
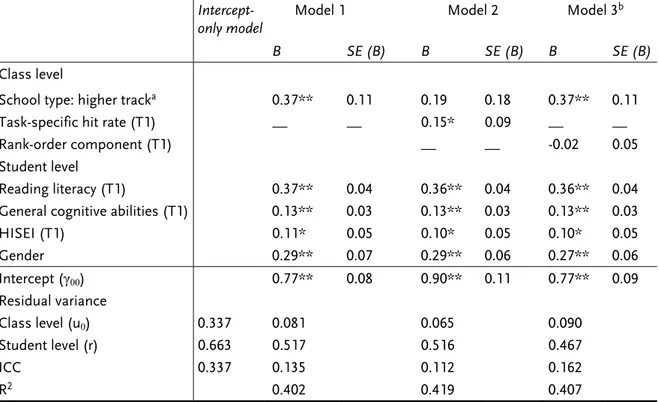
2. Is There a Relation between Teacher Judgment Accuracy and the Development of Students’ Reading Literacy?
Results for the second research question are presented in Table 4. First, the intercept- only model revealed an intraclass correlation coefficient of .337, meaning that 33.7% of the variance occurred between classes at T2. Consequently, 76.3% of the total variance occurred at the individual level. Second, the student- and class-level (control-) variables were included in the model (Model 1). At the student level, we found that reading literacy at T1 (B = 0.37, p < .01), gender (B = 0.29, p < .01), general cognitive abilities (B = 0.13, p < .01), and HISEI (B = 0.11, p < .05) were significantly related to students’
reading literacy at T2. Moreover, a significant effect of school type at the class level (B = 0.37, p < .01) was found. Furthermore, results indicated that 40.2% of the total variance was explained by the student- and class-level variables. Third, the task-specific hit rate (Model 2) and the rank-order component (Model 3) were introduced separately into the model to examine the relation between teacher judgment accuracy and the development of students’ reading literacy. Analyses revealed that the task-specific hit
rate had a significant positive relation with the development of students’ reading literacy (B = 0.15, p < .05, see Model 2),2 whereas the rank-order component was not significantly positively related to the development of students’ reading literacy (B = -0.02, p > .05, see Model 3). The percentage of total variance that was explained by Model 2 was 41.9%; by Model 3, it was 40.7%.
Table 4. Results from the Multilevel Analyses Predicting Reading Literacy in Grade 6 (T2)
Note. a reference: lower and middle academic tracks; gender: 0 = male, 1 = female; five classes in the lower academic track, six classes in the middle academic track, and 29 classes in the higher academic track; 502 students; b Model 3: five classes in the lower academic track, six classes in the middle academic track, and 27 classes in the higher academic track; 476 students; ICC: intraclass correlations (variance between classes [u0]/ total variance [r + u0]).
*p < .05. **p < .01.
2 Higher academic track teachers had a significantly higher task-specific hit rate than teachers in the middle and lower academic tracks (t = 3.92, p < .01; higher academic track: M = 0.70, SD = 0.10; middle and lower academic tracks: M = 0.56, SD = 0.09). Thus, the analyses were computed again using only the higher academic track teachers. The results show a positive relation between the task-specific hit rate and the development of reading literacy but reached statistical significance only at the 10% level (B = 0.17, p < .10).
Intercept- only model
Model 1 Model 2 Model 3b B SE (B) B SE (B) B SE (B) Class level
School type: higher tracka 0.37** 0.11 0.19 0.18 0.37** 0.11 Task-specific hit rate (T1) __ __ 0.15* 0.09 __ __
Rank-order component (T1) __ __ -0.02 0.05
Student level
Reading literacy (T1) 0.37** 0.04 0.36** 0.04 0.36** 0.04 General cognitive abilities (T1) 0.13** 0.03 0.13** 0.03 0.13** 0.03
HISEI (T1) 0.11* 0.05 0.10* 0.05 0.10* 0.05
Gender 0.29** 0.07 0.29** 0.06 0.27** 0.06
Intercept (γ00) 0.77** 0.08 0.90** 0.11 0.77** 0.09 Residual variance
Class level (u0) 0.337 0.081 0.065 0.090
Student level (r) 0.663 0.517 0.516 0.467
ICC 0.337 0.135 0.112 0.162
R2 0.402 0.419 0.407
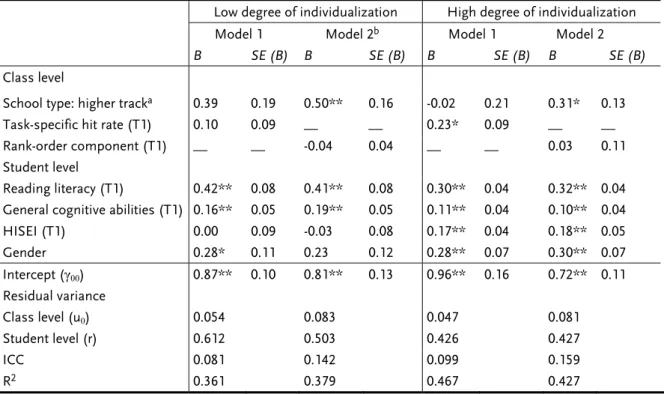
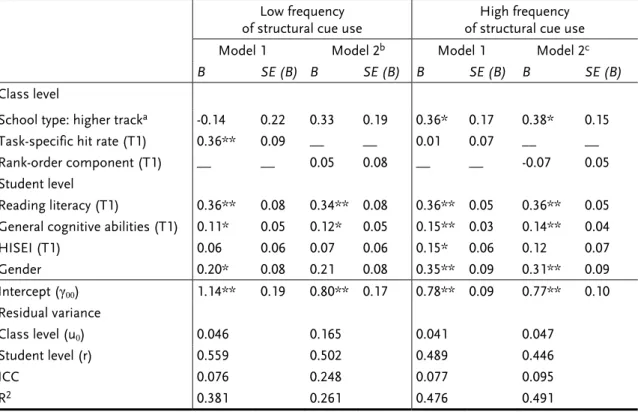
3. Is the Relation between Teacher Judgment Accuracy and the Development of Students’ Reading Literacy Moderated by Instructional Variables?
To test whether this relation was moderated by instructional variables, multilevel analyses were computed separately for each subsample (low and high degree of individualization, low and high frequency of structural cue use during lessons). First, the results for teachers’ use of individualization during lessons are presented (Table 5).
For teachers who used a high degree of individualization during lessons, we found a significant positive relation between the task-specific hit rate and the development of students’ reading literacy (B = 0.23, p < .05), whereas for teachers who applied a low degree of individualization during lessons, the task-specific hit rate was not significantly related to the development of students’ reading literacy (B = 0.10, p > .05).
For the rank-order component, again, no relation between this indicator and the development of students’ reading literacy was found: A significant positive relation between the rank-order component and students’ reading literacy development was not demonstrated in the group with a low degree of individualization (B = -0.04, p > .05) or in the group with a high degree of individualization (B = 0.03, p > .05).
Table 5. Results from the Multilevel Analyses Predicting Reading Literacy in Grade 6 (T2) Separately for Low and High Degrees of Individualization
Note. a reference: lower and middle academic tracks; gender: 0 = male, 1 = female; low degree of individualization: four classes in the middle academic track and 14 classes in the higher academic track;
235 students; b Model 2: four classes in the middle academic track and 12 classes in the higher academic track;
209 students; high degree of individualization: five classes in the lower academic track, two classes in the middle academic track, and 15 classes in the higher academic track; 267 students; ICC: intraclass correlations (variance between classes [u0]/ total variance [r + u0]).
*p < .05. **p < .01.
With regard to the teachers’ use of structural cues during lessons (Table 6), an unexpected result was found. The results revealed that for teachers with a low frequency of structural cue use during lessons, there was a significant positive relation between the task-specific hit rate and the development of students’ reading literacy (B = 0.36, p < .01), whereas no significant relation was found for teachers who frequently used structural cues during lessons (B = 0.01, p > .05).3 Again, no significant relation between the rank-order component and the development of students’ reading literacy was found, either in the subsample with a low frequency of
3 Analyses were computed again using only the higher academic track teachers because of their significantly higher task-specific hit rate compared to teachers in the middle and lower academic tracks.
The findings again showed a positive relation between the task-specific hit rate and the development of reading literacy for teachers with a high degree of individualization (B = 0.35, p < .01) and for teachers who used few structural cues during lessons (B = 0.36, p < .01). For the other groups, no significant relations were found.
Low degree of individualization High degree of individualization Model 1 Model 2b Model 1 Model 2
B SE (B) B SE (B) B SE (B) B SE (B)
Class level
School type: higher tracka 0.39 0.19 0.50** 0.16 -0.02 0.21 0.31* 0.13 Task-specific hit rate (T1) 0.10 0.09 __ __ 0.23* 0.09 __ __
Rank-order component (T1) __ __ -0.04 0.04 __ __ 0.03 0.11 Student level
Reading literacy (T1) 0.42** 0.08 0.41** 0.08 0.30** 0.04 0.32** 0.04 General cognitive abilities (T1) 0.16** 0.05 0.19** 0.05 0.11** 0.04 0.10** 0.04 HISEI (T1) 0.00 0.09 -0.03 0.08 0.17** 0.04 0.18** 0.05
Gender 0.28* 0.11 0.23 0.12 0.28** 0.07 0.30** 0.07 Intercept (γ00) 0.87** 0.10 0.81** 0.13 0.96** 0.16 0.72** 0.11
Residual variance
Class level (u0) 0.054 0.083 0.047 0.081 Student level (r) 0.612 0.503 0.426 0.427
ICC 0.081 0.142 0.099 0.159
R2 0.361 0.379 0.467 0.427
structural cues (B = 0.05, p > .05) or in the subsample with frequently used structural cues (B = -0.07, p > .05).
Table 6.Results from the Multilevel Analyses Predicting Reading Literacy in Grade 6 (T2) Separately for Low and High Frequencies of Structural Cue Use During Lessons
Note. a reference: lower and middle academic tracks; gender: 0 = male, 1 = female; few structural cues:
two classes in the middle academic track and 15 classes in the higher academic track; 213 students; b Model 2:
two classes in the middle academic track and 14 classes in the higher academic track; 204 students; a lot of structural cues: five classes in the lower academic track, four classes in the middle academic track, and 14 classes in the higher academic track; 289 students; c Model 2: five classes in the lower academic track, four classes in the middle academic track, and 13 classes in the higher academic track; 272 students; ICC:
intraclass correlations (variance between classes [u0]/ total variance [r + u0]).
*p < .05. **p < .01.
Discussion
The aim of the study was, on the one hand, to examine the accuracy of secondary school teacher judgments in the domain of reading and, on the other hand, to investigate the relation between teacher judgment accuracy and the development of students’ reading literacy and whether this relation was moderated by instructional variables.
As predicted, German language teachers showed a moderate hit rate. They accurately judged 66% of their students’ answers. Compared to findings from studies with
Low frequency
of structural cue use
High frequency of structural cue use Model 1 Model 2b Model 1 Model 2c
B SE (B) B SE (B) B SE (B) B SE (B)
Class level
School type: higher tracka -0.14 0.22 0.33 0.19 0.36* 0.17 0.38* 0.15 Task-specific hit rate (T1) 0.36** 0.09 __ __ 0.01 0.07 __ __
Rank-order component (T1) __ __ 0.05 0.08 __ __ -0.07 0.05 Student level
Reading literacy (T1) 0.36** 0.08 0.34** 0.08 0.36** 0.05 0.36** 0.05 General cognitive abilities (T1) 0.11* 0.05 0.12* 0.05 0.15** 0.03 0.14** 0.04 HISEI (T1) 0.06 0.06 0.07 0.06 0.15* 0.06 0.12 0.07 Gender 0.20* 0.08 0.21 0.08 0.35** 0.09 0.31** 0.09
Intercept (γ00) 1.14** 0.19 0.80** 0.17 0.78** 0.09 0.77** 0.10
Residual variance
Class level (u0) 0.046 0.165 0.041 0.047 Student level (r) 0.559 0.502 0.489 0.446
ICC 0.076 0.248 0.077 0.095
R2 0.381 0.261 0.476 0.491
elementary school teachers, the task-specific hit rate in our study was smaller than the task-specific hit rate reported in studies with elementary school teachers (see Coladarci, 1986; Demaray & Elliott, 1998). For the rank-order component, we found quite a low correlation between teacher judgments and students’ actual reading performance ( ̅ = .19). A possible explanation for the low correlation could be that the seven items of the reading literacy test did not differentiate sufficiently well between the students. Such a restriction of variance can substantially depress correlations and thus lead to an understatement of the relation between teacher judgments and students’ actual performance. In addition, the rank-order component in our study was also smaller than the rank-order component reported in studies with elementary school teachers (Demaray & Elliott, 1998; Feinberg & Shapiro, 1998). For example, Demaray and Elliott (1998) obtained a correlation of r = .82 in the domain of reading.
However, the elementary school teachers in their study had to rate each item (52 items) on the reading literacy test, whereas the secondary school teachers in our study had to judge only seven items on the reading literacy test, thus resulting in a restriction of variance. Furthermore, there were differences in the manner in which the correlations were operationalized. In the present study, mean within-class correlations were computed, whereas in the study by Demaray and Elliott (1998), class membership was not considered when computing correlations. Looking only at the overall correlation and ignoring the class level, as done by Demaray and Elliot (1998), leads to a confounding of differences between classes and differences between students within classes and may therefore be affected by substantial bias (Schrader & Helmke, 1990).
Another possible explanation could be that actual differences between elementary and secondary school teachers exist. The first evidence for this comes from a study by Karing (2009), who found that elementary school teachers more accurately judged students’ reading literacy as well as students’ mathematical competence than secondary school teachers. This finding is consistent with the assumption that differences between elementary and secondary school teacher judgment accuracy are related to structural prerequisites such as class composition (e.g., heterogeneity of students’ achievement) and teachers’ education. For example, elementary school classes are more heterogeneous with regard to the academic performance of students than secondary school classes (Tillman & Wischer, 2006). Some studies have found
that the heterogeneity of student achievement was positive related to measures of teachers’ diagnostic competence (Schrader, 1989; Weinert & Lingelbach, 1995; Karing, 2009). Furthermore, the elementary school teachers had more pedagogical and psychological practice in their teacher training than secondary school teachers, especially teachers in the higher academic track (Einsiedler, 2004; Hermann, 2004).
As in previous studies (e.g., Hoge & Coladarci, 1989; Südkamp et al., 2012), we found large variability among German language teachers in their judgment accuracy of students’ reading literacy. The variability in correlations ranged from -.85 to .92, and the range for the task-specific hit rate ranged from 40% to 86%, meaning that there may be a substantial number of different variables (e.g., student and teacher characteristics) that influence teacher judgment accuracy of students’ academic performance.
With regard to our analyses of the relation between teacher judgment accuracy and the development of students’ reading literacy, the following results were found: First, as expected, a significant positive relation between teachers’ task-specific hit rate and the development of students’ reading literacy was demonstrated. However, the significant relation between teachers’ task-specific hit rate and the development of students’
reading literacy was moderated by instructional variables: A high task-specific hit rate in combination with a high degree of individualization of lessons was significantly associated with an increased development of students’ reading literacy, whereas a high task-specific hit rate in combination with a low degree of individualization of lessons had no effect on students’ reading literacy development. Furthermore, a high task- specific hit rate in combination with a low frequency of structural cue use during lessons was also significantly related to an increase in the development of students’
reading literacy. However, no relation was demonstrated when structural cues were frequently used. A possible explanation for this unexpected finding may be that high- ability students do not depend on teachers’ use of structural cues during lessons, but rather rely on self-directed learning and individualized instructions because of their favorable learning prerequisites. On the other hand, for low-ability students, a highly structured learning environment makes it easier for them to focus their attention on relevant aspects of the lessons and to more easily combine prior knowledge with new knowledge (Blumberg, Möller, & Hardy, 2004; Lipowsky, 2009). For example, Möller,
Jonen, Hardy, and Stern (2002) found that high-ability elementary school students did not require highly structured lessons in social studies and science for their learning success, whereas low-ability students profited more from a highly structured learning environment. This could explain the difference between the findings of Helmke and Schrader (1987; see also Schrader 1989) and our study. Contrary to our study, Helmke and Schrader (1987; see also Schrader 1989) found that mathematics achievement gains were highest when high diagnostic competence was combined with the use of a lot of structural cues during lessons. In our study however, nearly 80% of the students attended higher academic track schools, whereas in the study by Helmke and Schrader (1987; see also Schrader 1989), the sample consisted exclusively of lower academic track students.
With regard to the rank-order component, no significant positive relation with the development of students’ reading literacy was found. Furthermore, we found no significant interaction between this indicator and either instructional variable for the development of reading literacy. One reason for the different findings regarding the association between the two indicators of teacher judgment accuracy and the development of reading literacy might be the low correspondence between teacher judgment accuracy and students’ actual performance. Perhaps as a result of the low value of the rank-order component, no significant relation with students’ development of reading literacy could be identified. According to Schrader (1989), a minimal degree of diagnostic competence as well as instructional quality is necessary to achieve significant relations or interactions. Maybe there were not enough teachers in our study who showed the necessary minimal degree of this indicator (rank-order component) to achieve significant relations and interactions.
Limitations and Suggestions for Future Research
Our study has some limitations that need to be taken into account. A perfect correspondence between teacher judgment of students’ performance and students’
actual performance cannot be expected because the competence tests reflect only a single performance of the students, whereas teacher judgments within the school context are based on different oral and written performances of the students. As in previous studies, the reliabilities of the two indicators of teacher judgment accuracy
could not be computed (McElvany et al., 2009; Schrader, 1989). According to Schrader (2009), the reliabilities of these indicators depend on the reliability of the judgment as well as on the reliability of the criterion, but are not definitively determined by these two variables. A further limitation is that both instructional variables were based on self-reports from teachers. Thus, they are limited to the views of the teachers and may be affected by judgment biases. Furthermore, median splits were computed for both instructional variables to answer the third question. However, a consequence of dichotomization is the loss of information about individual differences as well as the loss of statistical power (MacCallum, Zhang, Preacher, & Rucker, 2002; Richter, 2007;
Schrader, 1989). Finally, due to the small sample sizes of students and teachers from lower and middle academic track schools, a generalization of the present findings to these school types should be made with caution. According to Mass and Hox (2005), a sample size of at least N = 50 classes (Level 2) is needed for multilevel analyses. In our study, we had only N = 40 classes, leading to low test power and high insecurity in the estimation of the model parameters.
Despite these limitations, this study makes an important contribution to our understanding of the relation between teacher judgment accuracy and the development of students’ reading literacy. It shows that a combination of both high diagnostic sensitivity and appropriate instructional practices by teachers is necessary for effective teaching. However, our study, like previous studies (e.g., Anders et al., 2010; Helmke & Schrader, 1987; Lehmann et al., 2000), investigated the relation between teacher judgment accuracy and students’ learning success only in secondary school and only in the domains of reading and mathematics. Thus, further research is needed to take into account elementary school teachers as well as other domains and school subjects.
Results from the present study, like previous work (e.g., Anders et al., 2010; McElvany et al., 2009; Schrader, 1989), showed general deficits in teacher judgment accuracy.
Along with the assumption that teacher judgment accuracy is important for successful teaching, there is a considerable need for special teacher training. A first approach is offered by VERA (“Vergleichsarbeiten”; Helmke et al., 2004). Here, elementary school teachers get feedback about their judgment accuracy in the domains of reading and mathematics (task-related rank-order component and level component). However,
merely informing teachers about the accuracy of their judgments does not seem to be sufficient for substantially improving their judgment accuracy. Rather, improving their judgment accuracy depends on how teachers apply this information about their judgment accuracy. Unfortunately, not much is known about this important topic, which urgently needs further exploration.
References
Anders, Y., Kunter, M., Brunner, M., Krauss, S., & Baumert, J. (2010). Diagnostische Fähigkeiten von Mathematiklehrkräften und ihre Auswirkungen auf die Leistungen ihrer Schülerinnen und Schüler. Psychologie in Erziehung und Unterricht, 57, 175-193. doi 10.237/peu2010.arT13d.
Artelt, C., & Gräsel, C. (2009). Gasteditorial. Diagnostische Kompetenz von Lehrkräften. Zeitschrift für Pädagogische Psychologie, 23, 157-160. doi:
10.1024/1010-0652.23.34.157.
Baumert, J., & Schümer, G. (2001). Familiäre Lebensverhältnisse, Bildungsbeteiligung und Kompetenzerwerb. In J. Baumert, E. Klieme, M. Neubrand, M. Prenzel, U.
Schiefele, J. M. Schneider et al. (Hrsg.), PISA 2000: Basiskompetenzen von Schülerinnen und Schülern im internationalen Vergleich (S. 323-407). Opladen:
Leske & Budrich.
Blumberg, E., Möller, K., & Hardy, I. (2004). Erreichen motivationaler und selbstbezogener Zielsetzungen in einem schülerorientierten
naturwissenschaftsbezogenen Sachunterricht - Bestehen Unterschiede in Abhängigkeit von der Leistungsstärke?. In W. Bos, E. Lankes, N. Plaßmeier, &
K. Schwippert (Hrsg.), Heterogenität. Eine Herausforderung an die empirische Bildungsforschung. Münster: Waxmann.
Brunner, M., Anders, Y., Hachfeld, A., & Krauss, S. (2011). Diagnostische Fähigkeiten von Mathematiklehrkräften. In M. Kunter, J. Baumert, W. Blum, U. Klusmann, S. Krauss & M. Neubrand (Hrsg.),Professionelle Kompetenz von Lehrkräften.
Ergebnisse des Forschungsprogramms COACTIV (S. 215-234). Münster:
Waxmann.
Clausen, M. (2002). Qualität von Unterricht – Eine Frage der Perspektive? Münster:
Waxmann.
Coladarci, T. (1986). The accuracy of teacher judgments of student responses to standardized test items. Journal of Educational Psychology, 78, 141-146.
Demaray, M. K., & Elliott, S. N. (1998). Teachers’ judgments of students’ academic functioning: A comparison of actual and predicted performances. School Psychology Quarterly, 13, 8-24.
Drechsel, B., & Artelt, C. (2007). Lesekompetenz. In M. Prenzel, C. Artelt, J. Baumert, W. Blum, M. Hammann, E. Klieme & R. Pekrun (Hrsg.), PISA 2006. Die Ergebnisse der dritten internationalen Vergleichsstudie (S. 225-248). Münster:
Waxmann.
Einsiedler,W. (2004). Lehrerausbildung für Grundschule. In Blömeke, S., Reinhold, P., Tulodziecki, G. & Wildt, J. (Hrgs.), Handbuch Lehrerausbildung (S. 315-324). Bad Heilbrunn: Klinkhardt.
Feinberg, A. B., & Shapiro, E. S. (2009). Teacher accuracy: An examination of teacher- basedjudgments of students’ reading with differing achievement levels. The Journal of Educational Research, 102, 453-462. doi: 10.1521/scpq.18.1.52.20876.
Ganzeboom, H. B. G., De Graaf, P. M., & Treiman, D. J. (1992). A Standard International Socio-Economic Index of Occupational Status. Social Science Research 21, 1-56.
Haag, L., & Lohrmann, K. (2007). Diagnostische (In-)Kompetenz von Lehrern. In B.
Fuchs & C. Schönherr (Hrsg.), Urteilskraft und Pädagogik. Beiträge zu einer pädagogischen Handlungstheorie. Würzburg: Königshausen & Neumann.
Helmke, A., Hosenfeld, I., & Schrader, F. W. (2003). Diagnosekompetenz in
Ausbildung und Beruf entwickeln. Karlsruher pädagogische Beiträge, 55, 15-34.
Helmke, A., Hosenfeld, I., & Schrader, F. W. (2004). Vergleichsarbeiten als Instrument zur Verbesserung der Diagnosekompetenz von Lehrkräften. In R. Arnold & C.
Griese (Hrsg.), Schulleitung und Schulentwicklung (S. 119-144). Hohengehren:
Schneider Verlag.
Helmke, A., & Schrader, F.-W. (1987). Interactional effects of instructional quality and teacher judgement accuracy on achievement. Teaching and Teacher Education, 3, 91-98.
Herrmann, U. (2004). Lehrerausbildung für das Gymnasium und die Gesamtschule.
In Blömeke, S., Reinhold, P., Tulodziecki, G. & Wildt, J. (Hrsg.), Handbuch Lehrerausbildung (S. 335-350). Bad Heilbrunn: Klinkhardt.
Hoge, R. D., & Coladarci, T. (1989). Teacher-based judgments of academic
achievement: A review of literature. Review of Educational Psychology, 59, 297- 313.
Holland, P. W., Dorans, N. J., & Peterson, N. S. (2007). Equating test scores. In C. R.
Rao & S. Sinharay (Hrsg.), Handbook of Statistics 26. Psychometrics (S. 169-203).
Amsterdam: Elsevier.
Hornberg, S., Valtin, R., Potthoff, B., Schwippert, K., & Schulz-Zander, R. (2007).
Lesekompetenzen von Mädchen und Jungen im internationalen Vergleich. In W. Bos, S. Hornberg, R. Valtin, K. Schwippert, E.-M. Lankes, L. Fried, K.-H. et al. (Hrsg.), IGLU 2006. Lesekompetenzen von Grundschulkindern in Deutschland im internationalen Vergleich (S. 195-223). Münster: Waxmann.
Ingenkamp, K. (1992). Lehrbuch der Pädagogischen Diagnostik. Weinheim: Beltz.
Institut für Qualitätsentwicklung (2007). Leseverständnistest 7 Hessen. Wiesbaden:
Institut für Qualitätsentwicklung.
Karing, C. (2009). Diagnostische Kompetenz von Grundschul- und
Gymnasiallehrkräften im Leistungsbereich und im Bereich Interessen.
Zeitschrift für Pädagogische Psychologie, 23, 197-209. doi: 10.1024/1010- 0652.23.34.197.
Karing, C., Matthäi, J., & Artelt, C. (2011). Genauigkeit von Lehrerurteilen über die Lesekompetenz ihrer Schülerinnen und Schüler in der Sekundarstufe I - Eine Frage der Spezifität?. Zeitschrift für Pädagogische Psychologie, 25, 159-172. doi:
10.1024/1010-0652/a000041.
Karing, C., Pfost, M., & Artelt, C. (2011). Hängt die diagnostische Kompetenz von Sekundarstufenlehrkräften mit der Entwicklung der Lesekompetenz und der mathematischen Kompetenz ihrer Schülerinnen und Schüler zusammen?.
Journal for Educational Research Online, 3, 119-147.
Kolen, M. J., & Brennan, R. L. (2004). Test Equating, Scaling, and Linking. Methods and Practices. New York, NY: Springer.
Kuntze, S. (2006). Konzeption einer Lernumgebung für den gymnasialen Mathematikunterricht und Evaluation einer Themenstudienarbeit zum mathematischen Beweisen und Argumentieren. Zugriff am 30.04.2013.
Verfügbar unter: http://edoc.ub.uni-muenchen.de/6278.
Lehmann, R. H., Peek, R., Gänsfuß, R., Lutkat, S., Mücke, S., & Barth, I. (2000).
Qualitätsuntersuchungen an Schulen zum Unterricht in Mathematik (QuaSUM).
Potsdam: Ministerium für Bildung, Jugend und Sport des Landes Brandenburg (MBJS).
Lipowsky, F. (2009). Unterricht. In E. Wild & J. Möller (Hrsg.), Pädagogische Psychologie [Educational Psychology]. (S. 73-102). Berlin: Springer.
MacCallum, R. C., Zhang, S., Preacher, K. J., & Rucker, D. D. (2002). On the practice of dichotomization of quantitative variables. Psychological Methods, 7, 19-40.
Maas, C. J. M., & Hox, J. J. (2005). Sufficient Sample Sizes for Multilevel Modeling.
Methodology: European Journal of Research Methods for the Behavioral and Social Sciences, 1, 85-91.
McElvany, N., Schroeder, S., Richter, T., Hachfeld, A., Baumert, J., Schnotz, W. et al.
(2009). Diagnostische Fähigkeiten von Lehrkräften bei der Einschätzung von Schülerleistungen und Aufgabenschwierigkeiten bei Lernmedien mit
instruktionalen Bildern. Zeitschrift für Pädagogische Psychologie, 23, 223-235. doi:
10.1024/1010-0652.23.34.223.
Möller, K., Jonen, A., Hardy, I., & Stern, E. (2002). Die Förderung von naturwissenschaftlichem Verständnis bei Grundschulkindern durch Strukturierung der Lernumgebung. Zeitschrift für Pädagogik. 45.Beiheft.
Bildungsqualität von Schule: Schulische und außerschulische Bedingungen mathematischer, naturwissenschaftlicher und überfachlicher Kompetenzen, 176-191.
Nold, D. (2010). Sozioökonomischer Status von Schülerinnen und Schülern 2008.
Ergebnisse des Mikrozensus. Statistisches Bundesamt. Zugriff am 30.04.2013.
Verfügbar unter:
https://www.destatis.de/DE/Publikationen/Wirtschaft/Statistik/BildungForsch ungKultur/ StatusSchueler_22010.pdf?__blob=publicationFile.
Rakoczy, K., Buff, A., & Lipowsky, F. (2005). Teil 1: Befragungsinstrumente. In E.
Klieme, C. Pauli & K. Reusser (Hrsg.), Dokumentation der Erhebungs- und Auswertungsinstrumente zur schweizerisch-deutschen Videostudie
„Unterrichtsqualität, Lernverhalten und mathematisches Verständnis“. Frankfurt am Main: Gesellschaft zur Förderung Pädagogischer Forschung / Deutsches Institut für Internationale Pädagogische Forschung.
Raudenbush, S. W., & Bryk, A. S. (2002). Hierarchical linear models (2nd ed.). Thousand Oaks: Sage.
Raudenbush, S. W., Bryk, A., Cheong, Y. F., & Congdon, R. (2004). HLM 6:
Hierarchical linear and nonlinear modeling. Chicago: Scientific Software International.
Retelsdorf, J., & Möller, J. (2008). Entwicklungen von Lesekompetenz und Lesemotivation. Schereneffekte in der Sekundarstufe?. Zeitschrift für Entwicklungspsychologie und Pädagogische Psychologie, 40, 179-188. doi:
10.1026/0049-8637.40.4.179.
Richter, T. (2007). Wie analysiert man Interaktionen von metrischen und kategorialen Prädiktoren? Nicht mit Median-Splits! Zeitschrift für Medienpsychologie, 19, 116- 125. doi: 10.1026/1617-6383.19.3.116.
Rogalla, M., & Vogt, F. (2008). Förderung adaptiver Lehrkompetenz: eine Interventionsstudie. Unterrichtswissenschaft, 36, 17-36.
Schaffner, E., Schiefele, U., & Schneider, W. (2004). Ein erweitertes Verständnis der Lesekompetenz: Die Ergebnisse des nationalen Ergänzungstests. In
U. Schiefele, C. Artelt, W. Schneider & P. Stanat (Hrsg.), Struktur, Entwicklung und Förderung von Lesekompetenz. Vertiefende Analysen im Rahmen von PISA 2000 (S. 197-242). Wiesbaden: VS Verlag für Sozialwissenschaften.
Schrader, F.-W. (1989). Diagnostische Kompetenzen von Lehrern und ihre Bedeutung für die Gestaltung und Effektivität des Unterrichts. Frankfurt am Main: Peter Lang.
Schrader, F.-W. (2009). Anmerkungen zum Themenschwerpunkt Diagnostische Kompetenz von Lehrkräften. Zeitschrift für Pädagogische Psychologie, 23, 237-245.
doi: 10.1024/1010-0652.23.34.237.
Schrader, F.-W. (2011). Lehrer als Diagnostiker. In E. Terhart, H. Bennewitz & M.
Rothland (Hrsg.), Handbuch zur Forschung zum Lehrerberuf [(S. 683-698).
Münster: Waxmann.
Schrader, F.-W., & Helmke, A. (1987). Diagnostische Kompetenz von Lehrern:
Komponenten und Wirkungen. Empirische Pädagogik, 1, 27-52.
Schrader, F.-W., & Helmke, A. (1990). Lassen sich Lehrer bei der Leistungsbeurteilung von sachfremden Gesichtspunkten leiten? Eine Untersuchung zu
Determinanten diagnostischer Lehrerurteile. Zeitschrift für
Entwicklungspsychologie und Pädagogische Psychologie, 22, 312-324.
Schrader, F.-W., & Helmke, A. (2001). Alltägliche Leistungsbeurteilung durch Lehrer.
In F. E. Weinert (Hrsg.), Leistungsmessungen in Schulen. (S. 45-58). Weinheim:
Beltz.
Schrader, F.-W., Helmke, A., Hosenfeld, I., Halt, A.C., & Hochweber, J. (2006).
Komponenten der Diagnosegenauigkeit von Lehrkräften: Ergebnisse aus Vergleichsarbeiten. In F. Eder, A. Gastager & F. Hofmann (Hrsg.), Qualität durch Standards? Beiträge zur 67. AEPF-Tagung in Salzburg (S. 265-278).
Münster: Waxmann.
Spinath, B. (2005). Akkuratheit der Einschätzung von Schülermerkmalen durch Lehrer und das Konstrukt der diagnostischen Kompetenz. Zeitschrift für Pädagogische Psychologie, 19, 85-95. doi: 10.1024/1010-0652.19.1.85.
Südkamp, A., Kaiser, J., & Möller, J. (2012). Accuracy of teachers' judgments of students' academic achievement: A Meta-Analysis. Journal of Educational Psychology, 104, 743-762. doi: 10.1037/a0027627
Südkamp, A., Möller, J., & Pohlmann, B. (2008). Der Simulierte Klassenraum. Eine experimentelle Untersuchung zur diagnostischen Kompetenz. Zeitschrift für Pädagogische Psychologie, 22, 261-276. doi: 10.1024/1010-0652.22.34.261.
Tillmann, K.-J., & Wischer, B. (2006). Heterogenität in der Schule. Forschungsstand und Konsequenzen. Pädagogik, 3, 44-48.
Weinert, F. E., & Lingelbach, H. (1995). Teaching Expertise: Theoretical
conceptualizations, empirical findings, and some consequences for teacher training. In Hoz, R. & Silberstein, M. (Hrsg.), Partnerships of schools and institutions of higher education in teacher development (S. 293-302). Beer-Shera, Israel: Ben-Gurion University of the Negev Press.
Weinert, F. E., Schrader, F.-W., & Helmke, A. (1990). Educational expertise: Closing the gap between educational research and classroom practice. School Psychology International, 11, 163-180.
Weiß, R. H. (2006). Grundintelligenztest Skala 2 - Revision (CFT 20-R). Göttingen:
Hogrefe.
Wu, M. L., Adams, R. J., Wilson, M., & Haldane, S. A. (2007). ACER ConQuest version 2.0: generalised item response modelling software. Camberwell: ACER Press.
Appendix
An example of the computation of the two indicators of teacher judgment accuracy. In the following table, a fictitious class is illustrated. The first part of the table contains students' achievement (passed = coded as 1; failed = coded as 0). The second part of the table includes teacher judgments. The teacher judged whether each of the seven students would pass (coded as 1) or fail (coded as 0) each of the seven items.
Note. S1 to S7 = students; 1 .. 7 = items; i =1 .. l = number of students; j = 1 .. n number of teachers; k = 1 .. m number of tasks; SDx = standard deviation of students' achievement, SDy = standard deviation of teacher judgments, Covariance is COVxy = 2.22,
Students' achievement Teacher judgment (one teacher) Hit rate (tj) 1 2 3 4 5 6 7
Sijk
m
k=1
1 2 3 4 5 6 7
Lijk
m
k=1
S1 1 1 1 1 1 1 1 7 0 0 1 0 1 1 1 4 4
S2 1 1 0 0 0 0 0 2 1 1 1 1 1 1 1 7 2
S3 0 0 1 0 1 0 0 2 0 0 0 0 0 0 0 0 5
S4 1 0 1 0 1 1 1 5 1 1 1 1 0 1 1 6 4
S5 0 1 0 1 0 1 1 4 1 0 1 0 1 1 1 5 2
S6 0 0 1 0 0 0 0 1 1 0 1 1 0 0 0 3 5
S7 1 1 1 1 1 1 0 6 1 1 1 1 1 1 1 7 6
SDx = 2.27 SDy = 2.51
tij
l
i=1
= 28
Sijk
m
j=1 = the sum of an individual student’s correct answers (= individual student’s performance),
Lijk
m
j=1 = the sum of teacher judgements of individual students' correct answers.
Computation of two indicators of teacher judgment accuracy:
1.) Rank-order component (rxy):
rxy = COVxy
SDx × SDy = 2.22
2.27×2.51 = 0.39
A moderate correlation between teacher judgment and students' performance.
2.) Task-specific hit rate (aTj):
aTj = m1 tij
l
i=1 = 28
49 = 0.57
The teacher correctly judged 57% of their students' answers.