229 Chapter 8
8 Reading Literacy Development in Secondary School and the Effect of Differential Institutional Learning Environments
Maximilian Pfost and Cordula Artelt
Summary
The German secondary school system is characterized by a relatively early separation of students into different types of schools or school tracks that provide different types of curricula in accordance with the prerequisites of the learners.
The stratification of the students into the different school tracks is based mainly on student achievement in elementary school, but is also influenced by other factors such as the socioeconomic status or immigration background of the family. As upper academic track schools should provide more favorable developmental conditions with regard to the students’ cognitive competencies due to institutional characteristics and school composition effects, pre-existing differences in reading comprehension and vocabulary between the students in the different school tracks should further increase over the course of secondary school. In tracing the development of reading comprehension and vocabulary between Grade 5 and
Author Note Maximilian Pfost,
Department of Educational Research, University of Bamberg, Germany.
Cordula Artelt,
Department of Educational Research, University of Bamberg, Germany.
This research was supported by grant WE 1478/4-1 & AR 301/9-1 from the German Research Foundation (DFG).
We would like to thank Benjamin Nagengast (University of Tübingen) for his insightful comments on a draft of this chapter.
Correspondence concerning this chapter should be addressed to Maximilian Pfost, Department of Educational Research, University of Bamberg, Markusplatz 3, 96045, Bamberg, Germany. E-mail: maximilian.pfost@uni-bamberg.de
Grade 7 in the current study, results indicated a widening gap between upper, middle, and lower academic track school students’ reading comprehension, whereas stable achievement differences in vocabulary were found. A second analysis investigated the effect of attending the different school tracks while controlling for selectivity into the different secondary schools. Results indicated substantial positive effects of attending an upper academic track school in comparison to the lower and middle academic track schools in terms of effect sizes for reading comprehension and vocabulary, though not all results reached statistical significance. Taken together, favorable learning environments seem to support reading literacy development, but the reported findings should be generalized cautiously.
In most German states, students enroll in secondary school when they reach the age of 10 after 4 years of primary education (Cortina, Baumert, Leschinsky, Mayer, &
Trommer, 2008; Faust, 2006). The secondary school system in Germany, in contrast to the primary education system, is marked by a strict institutional stratification of students into different types of schools or tracks that go along with distinct school leaving certificates and that provide different learning opportunities to their students.
With regard to reading literacy, the transition from primary to secondary school is also marked by different conceptions of schooling and the function of reading. Whereas during primary school, instruction focuses on teaching children to read, over the course of secondary school, students increasingly read to learn (Burns & Kidd, 2010;
Chall, 1983). Nevertheless, although explicit instruction in reading is rare and the process of acquiring further reading skills becomes increasingly incidental in the course of secondary school, there is still a generally positive trend in the development of students’ reading literacy until students leave school (Hill, Bloom, Black, & Lipsey, 2008; Klicpera, Schabmann, & Gasteiger-Klicpera, 1993). Therefore, it is of critical importance to investigate the role of schools in a secondary school system that is characterized by an explicit between-school tracking for the development of reading literacy.
As mentioned, the German secondary school system separates their students by different types of schools or tracks that provide different types of curricula in accordance with the competencies and prerequisites of the learners. We call this form of organizational differentiation between-school tracking or curricular differentiation by school type (LeTendre, Hofer, & Shimizu, 2003) in contrast to forms of tracking that take place within schools (e.g., differentiating by courses or streams that can often be found in U.S. high schools). Thereby, the assignment of students to the different types of schools depends primarily on an interplay between decisions made by the primary schools and by the parents (Cortina & Trommer, 2005; Faust, 2005). Over the course of the last year in primary school, the school provides a recommendation for the educational career of the student. This recommendation is primarily based on the student’s aptitudes, but also takes into account other prognostic factors (e.g., familial support of the child). The bindingness of this recommendation varies between the federal states, providing different scopes for parents’ decision making with regard to the educational careers of their children. In the end, this procedure leads to a separation of the students between the different types of schools according to the students’ cognitive abilities but also according to their social and familial backgrounds (Baumert & Köller, 2005; Baumert & Schümer, 2001; Ditton & Krüsken, 2006; Ditton, Krüsken, & Schauenberg, 2005). The rationale behind this institutional separation of students, which Gamoran and Mare (1989) call the Positive View of Tracking, is “that students differ in their academic goals and in the environments in which they learn best. Ideally, a system of academic tracking matches students’ aptitudes with the objectives and learning environments to which they are best suited” (Gamoran &
Mare, 1989, p. 1148). Therefore, a homogenization of the group of students with regard to their ability level should ideally enhance learning for all students (Baumert, 2006). Nevertheless, empirical support for this assumption has been mixed (cf. Ariga &
Brunello, 2007; Slavin, 1990).
However, focusing exclusively on the question of the productivity of tracking practices in comparison to nontracking practices on students’ learning neglects a second outcome dimension: individual differences or performance inequality between students who attend different tracks. Separating students into different school tracks might, for example, be very effective for students in higher academic tracks, whereas it
might have detrimental effects for students in lower academic tracks. Of course, the opposite could also be true. Students in lower academic tracks might receive the instruction they need to catch up to the achievement level of the higher track students.
Therefore, the following two questions require further analysis: How do the cognitive competencies of students who were separated into different academic tracks develop and how would these competencies have developed if the students who were assigned to a certain school track would have been assigned to another track?
Type of School and Causes of Individual Differences in Competence Development
In most German states, the secondary school system is comprised of at least three types of schools or tracks (Cortina, et al., 2008): a lower academic track (“Hauptschule”) that provides 5 years of basic secondary education, generally preparing students for vocational training; a middle academic track (“Realschule”), comprising 6 years of secondary education; and a higher academic track (“Gymnasium”) that comprises 8/9 years of secondary education and qualifies students for university admission. In addition, some German states run comprehensive secondary schools, offering all three types of school leaving certificates. As different types of schools pursue different academic goals and students are selected into these types of schools primarily according to their cognitive abilities and academic achievement, different learning environments are the result. These school-type-specific environments provide differential developmental possibilities for students based on differential distributional processes of economic, social, and cultural resources; differential institutional working and learning conditions; as well as differential school-type-specific educational and curricular traditions (Baumert, 2006; Baumert, Köller, & Schnabel, 1999; Baumert &
Schümer, 2001; Gamoran & Berends, 1987). For example, whereas in lower academic track schools, it is still common to have a form teacher who teaches several or almost all subjects (Leschinsky, 2008a), teachers in middle or upper academic track schools are usually specialized to teach only two or three subjects (Leschinsky, 2008b;
Trautwein & Neumann, 2008). In addition, upper academic track teachers tend to have higher levels of content knowledge as well as pedagogical content knowledge (Baumert, et al., 2010). Furthermore, comparing the cultures of instruction, relatively
clear-cut differences between tracks are apparent: In the upper academic track schools, lessons are usually characterized by a high level of cognitive activation and a low level of teacher support, whereas in lower academic track schools, lessons are usually characterized by a high level of teacher support and a low level of cognitive activation (Kunter, et al., 2005). Finally, instruction in lower tracks often seems to proceed more slowly and is conceptually simplified, thereby providing only restricted access to knowledge for students who attend this track (Gamoran & Berends, 1987).
In addition to the thus-far described institutional differences in instruction, the student composition itself might support or handicap learning processes (Baumert, Stanat, & Watermann, 2006; Harker & Tymms, 2004; Pfost, 2011; Zimmer & Toma, 2000). This means that differences in the development of cognitive competencies might be attributable not only to institutional differences in the learning environments, but might also reflect differences in the characteristics of the students within these schools. For example, it has been shown that the proportion of students with an immigration background is negatively linked to the development of the students’ reading competence (Pfost, 2011; Stanat, 2006; Walter & Stanat, 2008).
Further studies have shown a positive relation between the mean level of achievement and individual reading development (Baumert, et al., 2006; Dreeben & Barr, 1988;
Lehmann, 2006) or mathematics (Lehmann, 2006; Opdenakker, van Damme, de Fraine, van Landeghem, & Onghena, 2002; Zimmer & Toma, 2000). Finally, evidence exists for a positive effect of the aggregated mean socioeconomic status on students’
academic achievement (Dumay & Dupriez, 2007; Ma & Klinger, 2000; van Ewijk &
Sleegers, 2010). As the access to different school tracks is highly selective, institutional differences in the composition of students within schools is the result and may reinforce existing institutional differences in the learning opportunities that are offered. Consequently, different learning rates between students attending different school tracks in secondary school should be expected.
When reviewing differences in the development of cognitive competencies, a third cause of individual differences needs to be taken into account: differential learning rates due to individual characteristics or traits of the students themselves. Therefore, differences in competence development between different school tracks might be attributable to observed and unobserved characteristics that govern the selectivity of
students into the different types of schools. A well-supported fact is that in primary school, students already differ in their school performances, familiar and social backgrounds, as well as expectations concerning future school achievement (Ditton &
Krüsken, 2006; Gamoran & Mare, 1989; Maaz, Hausen, McElvany, & Baumert, 2006;
Schneider & Stefanek, 2004). For example, parents from different economic and educational backgrounds might apply different strategies such as the utilization of paid private tutoring to realize their educational aspirations and therefore might try to actively influence the selection process into secondary school (Dang & Rogers, 2008;
Schneider, 2004). Furthermore, students differ in their prior knowledge when entering secondary school, which might directly result in different learning rates (Renkl, 1996).
Within the domain of reading, Stanovich (1986, 2000) describes a model of increasing interindividual differences in reading literacy; he named this the Matthew effect model. Thereby, the cumulative advantages of good readers or the cumulative disadvantages of bad readers are the result of reciprocal self-reinforcing causal processes: “The very children who are reading well and who have good vocabularies will read more, learn more word meanings, and hence read even better. Children with inadequate vocabularies – who read slowly and without enjoyment – read less, and as a result have slower development of vocabulary knowledge, which inhibits further growth in reading ability” (Stanovich, 1986, p. 381). However, empirical studies that have investigated the Matthew effect model in reading have produced mixed results.
On the one hand, there is much empirical support from longitudinal studies concerning the reciprocal relation of reading ability, reading motivation, and reading behavior (McElvany, Kortenbruck, & Becker, 2008; Morgan & Fuchs, 2007; Pfost, Dörfler, & Artelt, 2010). On the other hand, studies that have focused on the development of the competence gap between good and poor readers have not yet accumulated convincing evidence which clearly supports a pattern of increasing or a pattern of decreasing differences in reading achievement over time (e.g. Aarnoutse, van Leeuwe, Voeten, & Oud, 2001; Bast & Reitsma, 1998; Kempe, Eriksson- Gustavsson, & Samuelsson, 2011; Parrila, Aunola, Leskinen, Nurmi, & Kirby, 2005;
Pfost, Dörfler, & Artelt, 2012).
In sum, differences in learning rates between students attending lower, middle, and upper academic track schools are the result of an interplay between individual,
institutional, and school composition factors that may add up, reinforce, or compensate each other over the course of students’ individual development.
Achievement Differences and Achievement Growth in Secondary School – Empirical Findings
Cross-sectional studies, especially the four PISA studies run by the OECD between 2000 and 2009 (Baumert, et al., 2001; Klieme, et al., 2010; Prenzel, et al., 2007; Prenzel, et al., 2005), have reported large differences in cognitive competencies between the students who attend different school tracks in Germany. In the most recent PISA study, 15-year-old students attending upper academic track schools on average achieved a reading comprehension score that was more than one and a half standard deviations above the average reading comprehension score of students attending lower academic track schools. Students attending middle academic track schools as well as comprehensive schools reached an average reading comprehension score in between these other two types of schools (Naumann, Artelt, Schneider, & Stanat, 2010).
Comparable results have been reported for mathematics and science (Frey, Heinze, Mildner, Hochweber, & Asseburg, 2010; Rönnebeck, Schöps, Prenzel, Mildner, &
Hochweber, 2010). Intuitively, we might conclude that these differences are the result of achievement differences prior to secondary school plus different learning rates between school tracks, but cross-sectional studies such as PISA cannot determine the time in the course of development at which differential learning rates appear. Thus, the hypothesis of a widening achievement gap between the different academic tracks needs to be analyzed longitudinally.
Within the domain of mathematics, the assumption of a widening achievement gap has been investigated and verified several times (Becker, Lüdtke, Trautwein, &
Baumert, 2006; Köller & Baumert, 2001) with the exception of Schneider and Stefanek (2004), who reported stable mathematics achievement differences between Grade 2 and Grade 11. The reported results from Germany converge well with studies that have investigated the effect of taking advanced courses in U.S. high schools (Gamoran &
Mare, 1989; Schmidt, 2009).
Within the domain of reading, however, studies have been less frequent and the results have been more controversial. This might, at least partially, be attributable to differences in the learning opportunities that underlie the development of different cognitive skills (cf., Köller & Baumert, 2008). Whereas for the development of mathematical skills, schools play almost a monopolistic role in the transfer of knowledge, within the domain of reading, further learning opportunities such as leisure time reading (e.g., Pfost, Dörfler, et al., 2010; Spear-Swerling, Brucker, &
Alfano, 2010) are of high relevance. Consequently, it might be reasonable to expect that differences in school learning environments might be more related to the development of mathematics than to the development of reading literacy. Retelsdorf and Möller (2008), in analyzing data from the LISA study, reported small but nonsignificant differences in the development of reading literacy from Grade 5 to Grade 6 between lower (d = 0.59), middle (d = 0.62), and upper academic track schools (d = 0.82). Initial differences in reading literacy in Grade 5, when students enter secondary school, however, were already relatively large, with students in the upper academic track scoring on average more than one standard deviation (d = 1.22) above students from the middle academic track and even more than two standard deviations (d = 2.30) above students from the lower academic track. Similar results were presented by Gröhlich, Bonsen, and Bos (2009): In analyzing data from more than 10,000 students from the Hamburg KESS study, the authors reported the highest growth in reading literacy between the end of Grade 4 and Grade 6 for students who attended comprehensive schools (d = 0.47), followed by students who attended lower and middle academic track schools (d = 0.45). The lowest average growth was reported for upper academic track students (d = 0.42). The results confirm the findings from the antecedent LAU study (Lehmann, Peek, Gänsfuß, & Hußfeldt, 1998). Taken together, the results in the domain of reading have been less stringent and have not confirmed the assumption of a widening gap over the course of secondary school.
The question of whether a privileged school learning environment is linked to an increased learning rate was also addressed by the Berlin ELEMENT study (Lehmann &
Lenkeit, 2008), which was subsequently reanalyzed by Baumert, Becker, Neumann, and Nikoleva (2009). In the state of Berlin, students have the opportunity to switch to some upper academic track schools (“grundständiges Gymnasium”) after Grade 4 or to
stay in a prolonged elementary school and change to secondary school after Grade 6.
Students who chose to attend early upper academic track schools after Grade 4 had, in comparison to the students who remained in elementary school, better marks, better reading, and mathematics competencies and came from families with a higher socioeconomic status. Results describing the competence development between Grade 4 and Grade 6 showed, beyond initial differences in reading literacy, a comparable learning rate for students in the two types of schools. With regard to mathematics, students in the early upper academic track school showed an increased learning rate in comparison to the elementary school students. The reanalysis of the data by Baumert et al. (2009), however, focusing on the role of the learning environment on the development of reading and mathematics, did not demonstrate a more favorable learning rate in reading or in mathematics for students in the early upper academic track schools after students’ individual characteristics, driving the transition from elementary to early upper academic track school, had been taken into account.
Therefore, the hypothesis that a privileged learning environment leads to higher learning rates was not confirmed by this study. Finally, using data from the BiKS study, Pfost, Karing, Lorenz, and Artelt (2010) report a widening achievement gap or fan-spread effect between students attending the lower academic track and the middle as well as upper academic track for reading comprehension, but not vocabulary, between Grade 5 and Grade 6. In addition, a fan-spread effect between students attending different secondary schools was already traceable when students still attended primary school.
Taken together, whereas in the domain of mathematics, fan-spread effects have been demonstrated several times, within the domain of reading, results have been less stringent and have mostly indicated relatively stable achievement differences between different types of schools across the course of secondary school. However, due to the assumption of different learning environments, also fan-spread effects in the domain of reading can be expected.
Research Questions
The current study focused on the following two questions: First, can differences in the development of reading literacy by type of school/school track be found? With regard
to the assumption that upper academic track schools provide a favorable learning environment due to institutional and compositional factors and that students attending upper academic track schools on average have higher cognitive abilities, which should additionally promote further learning, different learning rates in favor of students in upper academic track schools were expected. Furthermore, as lower academic track schools should provide the least favorable learning conditions, the lowest learning rates were expected within this school type. Second, it seemed important to ask whether an effect of attending different types of schools on reading achievement measures could be verified independent of students’ characteristics that govern the selectivity into the different secondary school tracks. Again, we expected a favorable effect of attending upper academic track schools in comparison to middle and lower academic track schools, after controlling for important covariates that go along with the choice of a certain track. Due to sample-size restrictions, students from middle and lower academic track schools were grouped together. Therefore, only the effect of attending upper academic track schools in comparison to attending an alternative type of school (middle and lower academic tracks) was estimated.
The current paper extends the findings reported by Pfost, et al. (2010) in at least two ways: at first, data up to Grade 7 was available. Second, the role of covariate selection for the estimation of effects of different institutional learning environments was addressed in more detail.
Method
Design and Participants
All analyses were based on data from the BiKS-8-14 panel study. At the first point of measurement, in the second term of Grade 3, N = 2,395 students were assessed. After the transition from primary into secondary school, a subsample of n = 922 students (38.5% of the original sample) was further followed across secondary school (n = 268 in the lower, 188 in the middle, and 466 in the upper academic tracks). Students were selected for further participation in the BiKS-8-14 panel study when they agreed to participate further, when they chose a school within the BiKS inquiry region that had at least one class with at least three participants, and when the school was not
characterized by comprehensive or remedial instruction (cf., Schmidt, Schmitt, &
Smidt, 2009). Furthermore, n = 879 secondary school students (n = 102 in the lower, 135 in the middle, and 642 in the upper academic tracks) were additionally recruited in Grade 5 for participation in the BiKS panel study, resulting in a total sample of N = 1,801 secondary school students. Whereas in primary school, data collection took place every half year (Measurement Waves 1, 2, and 3), in secondary school, data were collected annually at the end of each academic year (Measurement Waves 4, 5, and 6).
The following analyses focused on the development of measures of reading comprehension and vocabulary between Grade 5 and Grade 7. Additional data from the elementary school years were taken into account for the second set of analyses. The average age of the students was 11.4 years (SD = 0.5) in Grade 5. Furthermore, in our sample, 13.8% of the students lived in households with immigration backgrounds. The gender of the students was almost equally distributed; 47.8% of the students were male and 52.2% were female.
Measures
Students, teachers, and parents were tested on a wide range of measures. In the following section, the measures that were used in the current analysis are presented.
At first, the two measures of reading comprehension and vocabulary used in secondary school (Grade 5 to 7) are depicted. Developmental differences between school tracks on these two variables are of major interest in our analyses. Therefore, these two variables are presented in detail. Subsequently, the variables/covariates that were used in the second analysis, in order to control for the selectivity into the different school tracks, are depicted. All covariates were assessed in primary school.
Reading comprehension. In Grade 5, reading comprehension was measured by a sample of six short texts with a total of 43 multiple-choice items developed by the BiKS research group. For the reading comprehension test, the students had to read a given text, search relevant information, and generate more or less high inferences from the text to answer the given items. In Grade 6, three texts with a total of 31 multiple-choice items were used. Finally, in Grade 7, again, three texts with a total of 26 multiple- choice items were used. For the three waves of measurement, a common item design with a nonequivalent groups/anchor-item test design was applied (Holland, Dorans, &
Peterson, 2007; Kolen & Brennan, 2004), allowing the estimation of students’ reading comprehension on a common metric within an IRT framework. Therefore, for all reading comprehension test items, the item difficulty parameters were estimated with a three-dimensional 1-parameter Rasch model by using the ConQuest software package (Wu, Adams, Wilson, & Haldane, 2007). A design matrix was specified and the item difficulty parameters of the three waves of measurement were estimated in a single simultaneous run (concurrent estimation). Item difficulty parameters for the same items across different waves of measurement were set equal. Subsequently, individual students’ abilities were estimated in a second run by weighted likelihood estimates (WLEs) for every wave of measurement using the item difficulty parameters of the concurrent estimation. Missing responses were treated as incorrect during the item calibration stage as well as during the estimation of the person parameters. The estimated individual ability scores were conclusively T-standardized (M = 50, SD = 10) in Grade 5. The reliabilities (WLE-reliability) of the reading comprehension measures were satisfactory for all waves of measurement (ReliabilityGrade 5 = .78, ReliabilityGrade 6
= .77, ReliabilityGrade 7 = .76).
Vocabulary. Students’ vocabulary was measured by a set of 35 items from the subscale V1 (Vocabulary) of the Kognitiver Fähigkeitstest für 4. bis 12. Klassen, Revision (KFT 4-12 + R; Heller & Perleth, 2000). Additional vocabulary items that were used in Grade 7 were disregarded in the present analysis in order to keep the metric constant. Ceiling effects were negligible as still in Grade 7 the maximum test score was reached by just one student of the sample. For every item, a target word as well as a selection of four additional words was presented for reading. Students had to indicate the word whose definition best matched the presented target word. Students’ vocabulary was estimated by summing the number of correct answers. For ease of interpretation, students’
vocabulary scores were also T-standardized (M = 50, SD = 10) in Grade 5 by a linear transformation. The internal consistency (Cronbach’s α) of the vocabulary test was satisfactory for the three waves of measurement (αGrade 5 = .78, αGrade 6 = .80, αGrade 7 = .78).
Covariates. Socioeconomic and ethnic-cultural backgrounds. Data concerning students’ socioeconomic and ethnic-cultural backgrounds were collected in a highly standardized telephone interview in the first and third waves of measurement in Grade
3 and Grade 4 of elementary school. In order to determine students’ immigration backgrounds, parents were asked questions concerning their cultural origin. Students were classified as having an immigration background when at least one parent was born in a foreign country. Furthermore, the parents were asked questions concerning their familial, educational, as well as occupational status. With this information, the highest ISEI (International Socio-economic Index of Occupational Status; Ganzeboom, De Graaf, & Treiman, 1992) and educational level of the parents was determined.
Cultural capital. Parents were asked to specify the number of books they had at home.
The responses were categorized by the interviewers. Categories ranged from 1 (not one) to 7 (more than 500).
Extracurricular reading behavior. Students’ habitual extracurricular reading behavior was assessed by a single item (“Does [the name of the child] read for pleasure?”) in the parental telephone interview in Grade 4. Parents rated the frequency of their children’s reading behavior on a 4-point Likert-type scale with the response options 1 (almost never or never), 2 (rarely), 3 (yes, several times a week), and 4 (yes, everyday).
Reading self-concept. Students’ reading self-concept was assessed by a single item (“How good are you in school in… reading?”) in the students’ questionnaire in Grade 4. Students rated their reading self-concept on a 4-point Likert-type scale ranging from 1 (bad) to 4 (very good).
Vocabulary. In Grade 4, students’ vocabulary was measured by a set of 30 items from the supplementary vocabulary test of the culture fair intelligence test (CFT 20, german version: Weiß, 1987).
Mathematics competence. Students’ mathematics competence in Grade 4 was measured by a selection of 19 items from the DEMAT 4 (Gölitz, Roick, & Hasselhorn, 2005).
Spelling. Spelling was measured in Grade 4 by using 21 items from the DRT 4 (Grund, Haug, & Naumann, 2003).
General cognitive abilities. Students’ general cognitive abilities were assessed in Grade 4 with a set of 15 items from the matrices subtest of the culture fair intelligence test (CFT 20-R, german version: Weiß, 2006).
Reading comprehension. In Grade 4, reading comprehension was measured by a sample of 13 short texts with 20 multiple-choice items from the subscale text comprehension of the ELFE 1-6 (Lenhard & Schneider, 2005). The test was prolonged by adding three new texts with six multiple-choice items developed by the authors to avoid ceiling effects.
Grades. Information concerning the students’ grades after the first term of Grade 4 was provided by the class teachers. In Germany, grades range from 1 (excellent) to 6 (insufficient).
Analytic Strategy
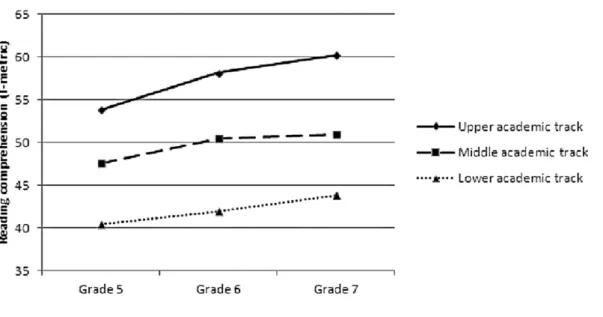
The first set of analyses addressed the question of whether differences in the development of reading comprehension and vocabulary between students attending different types of schools could be demonstrated. In order to test for developmental differences, difference scores for reading comprehension and vocabulary, using models of true intraindividual change (cf. Geiser, 2010; Steyer, Eid, & Schwenkmezger, 1997), were computed (Figure 1). The type of school was used as a grouping variable.
As there was only one indicator of reading comprehension or vocabulary available for each wave of measurement, a latent achievement indicator was not estimated.
Consequently, the measurement error of the manifest variables was set to zero. The initial unconstrained model was just identified, fitting the data perfectly. To test for differences between groups, mean change scores between different types of schools were set to be equal and compared to the model without this constraint. All multigroup models of difference scores were estimated with Mplus 6.1 (Muthén & Muthén, 1998- 2010). In order to take the nested data structure into account, the type is complex option was used. Although an MLR estimator was used, the chi-square value for testing the constrained model against the alternative, unconstrained (just-identified) model was not corrected as there was not yet a routine within Mplus for doing this when missing data were replaced by multiple imputation.1 The analyses were run two times. In the first analysis, students were grouped according to the type of school that these students attended in Grade 5. Changes in the school type between Grade 5 and Grade 7 that
1 cf. Mplus Discussion board, posting by Linda K. Muthén on 16th June 2006 on http://www.statmodel.com/discussion/messages/22/381.html [17th March 2012].
may betw man Grad impu diffe a sec in th repea
Figu mod
The diffe comp chara this r for w and v
have occur ween Grade nner. In the
de 6 and/or uted. To erences in r cond set of he study in at a class du
re 1. Specif el is specifi
second set erent types prehension acteristics i research qu whom test
vocabulary
rred were i 5 and Gra ese two case
r Grade 7 w support th reading com f analyses, c n Grade 7, uring the ti
fied differen fied as base
t of analyse s of scho n and vo influencing uestion, we
informatio from the e
ignored. In de 7 were t es (change was almost he interpre mprehensio
considering who did n ime period
nce score m line model.
es addresse ools or sc ocabulary
g the select e used the r on, includin elementary
n the same treated as th
of school a t never avai etation of on and voca g only stude not change d under inve
model for re .
ed the que chool track
could be tivity into th reduced sub
ng inter ali school year
way, stude hough they and grade re ilable, and f our resu abulary dev ents who w their type estigation.
ading com
stion of wh ks on th
verified he seconda bsample of ia measure rs, was avai
nts who ha y had advan epetition), t the achieve ults, the m velopment w were still ac
of school,
prehension
hether an e e developm
independe ary school s f students in es of readin ilable. In or
ad to repea nced in the test inform ement scor models de
were reana ctively parti , and who
n/vocabular
effect of at ment of ent of in system. To n secondar ng compre rder to dise
at a class e normal mation of res were scribing alyzed in cipating did not
ry. The
ttending reading ndividual address y school hension entangle
institutional from individual effects, interindividual differences between students prior to their secondary school attendance needed to be adequately controlled. One of the most efficient tools for estimating treatment effects (e.g., the effect of attending different types of schools) in nonexperimental studies is Propensity-Score-Matching (PSM). In general, matching methods within observational studies aim to equate a distribution of covariates in treatment and control groups by drawing students from both groups who are similar on a set of observed covariates (Rosenbaum & Rubin, 1985; Stuart, 2010). Matching methods often come into operation when causal inferences about treatment effects in observational designs are of particular interest (c.f. Morgan & Winship, 2007; Rubin, 1997; West & Thoemmes, 2010). PSM traditionally comprises two analytical steps: First, for every student, the probability of being in either the treatment (TG) or the control group (CG) is calculated on the basis of the covariates that are taken into account. In the present analysis, attending an upper academic track school comprised the treatment condition and lower or middle academic track schools the control condition. In the current analysis, the following covariates were considered: the state where the school was located (dummy coded:
0 = Hesse, 1 = Bavaria), students’ age and sex (dummy coded: 0 = female, 1 = male), parents’ education (dummy coded: 0 = parents did not reach university entrance qualification, 1 = parents reached university entrance qualification), students’
immigration background (dummy coded: 0 = no immigration background, 1 = students have an immigration background), parents’ HISEI, cultural capital of the parents (the categories were dummy coded), students’ time spent in extracurricular reading (the categories were dummy coded), students’ reading self-concept (the categories were dummy coded), and Grade 4 achievement measures of vocabulary, mathematics, spelling, general cognitive abilities, and reading comprehension. Only linear effects of the covariates were considered. In the second matching analysis, in addition to the already denoted variables, students’ grades after the first term of Grade 4 in mathematics and German were taken into account. As denoted, students’ grades from the first term of Grade 4 were directly linked to the choice of school track.
However, school grades are often not comparable to each other due to different applied reference scales (Maaz, et al., 2008; Trautwein, Lüdtke, Becker, Neumann, & Nagy, 2008; Treutlein & Schöler, 2009) and should therefore be treated and interpreted with caution.
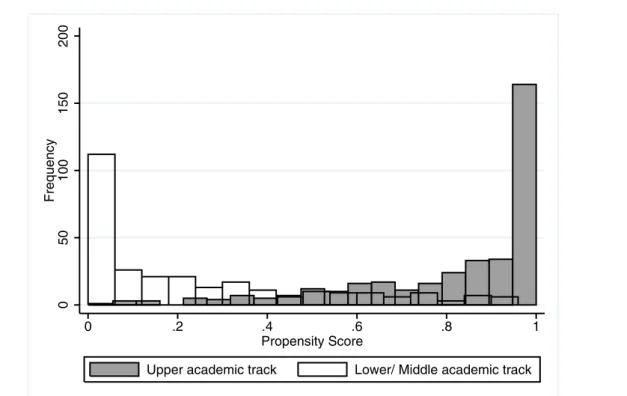
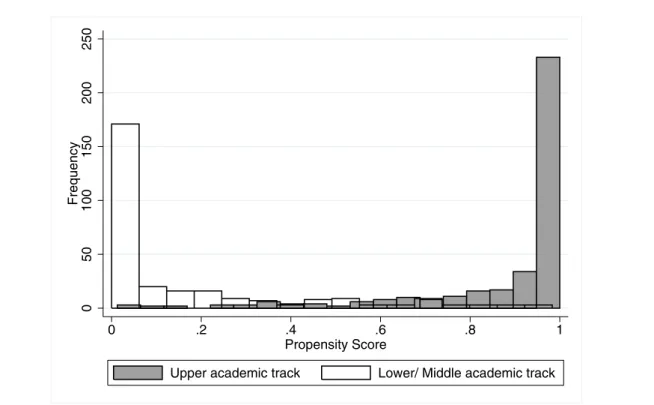
On the basis of these variables, a probit score which indicates a student’s probability of attending the upper academic track school (TG) given that student’s covariates was estimated. Then, students in the two groups were matched to each other on the basis of the calculated probit score using radius matching (see Dehejia & Wahba, 2002;
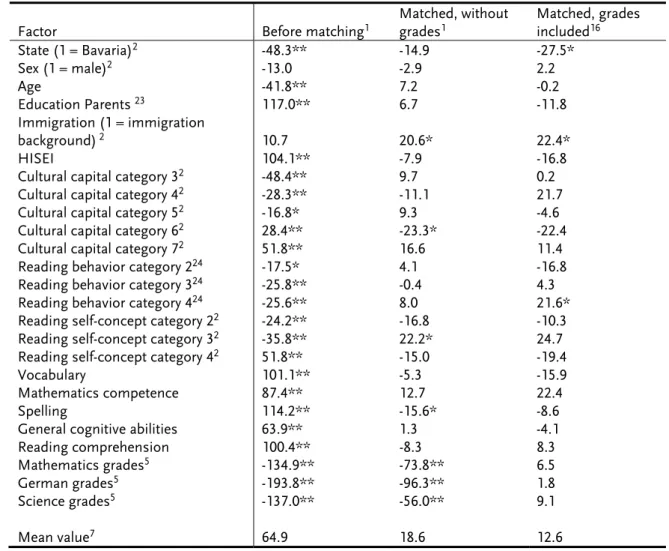
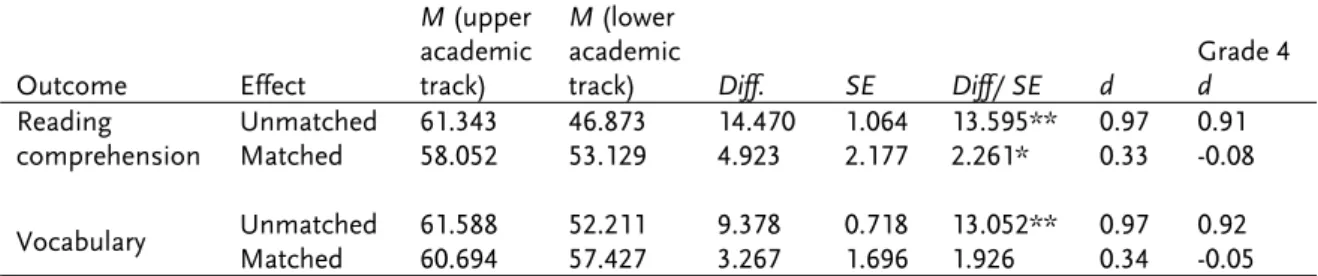
Morgan & Winship, 2007). Therefore, for each treatment case control cases were selected that were located within a particular distance – the radius – of the calculated propensity score. In cases in which more than one control student was located within the maximum acceptable distance around the treatment group student, the selected control cases were given equal weights. The radius was set at δ = 0.005. Treatment cases that did not have a possible counterpart within the control cases were said to be off the support and were not considered for further analysis. The same was true for control cases without possible counterparts from the treatment cases. Therefore, the interpretability of the treatment effect was limited to those for whom possible counterparts existed (common-support treatment effect for the treated). In other words, the estimated average effect of attending an upper academic track school (TG), in comparison to attending lower or middle academic track schools (CG), on the development of reading comprehension and vocabulary is only informative with regard to those students who typically attend an upper academic track school and for whom comparable counterparts who attend lower and middle academic track schools exist. As mentioned, students attending lower and middle academic track schools were grouped together because of their small sample size. After the matching procedure, balance with respect to the incorporated covariates and the overlap between the two groups was checked. Therefore, the standardized differences of the covariates between the two treatment groups before and after the matching procedure were computed. In the final step, the analysis of the outcomes, differences in reading comprehension and vocabulary in Grade 7 between the matched groups were tested. Propensity-Score- Matching was done with STATA 11 using the psmatch2 routine (Leuven & Sianesi, 2003).
Missing data. Missing data is a typical problem of research in the social sciences, especially in longitudinal studies. In the current study, missing data may have occurred on the one hand because parents did not give consent for their child to participate in the study. What is known from the literature is that active informed
parental consent is related to factors such as the degree of deviant behavior of the students, students’ scholastic performance, and the social and ethnic backgrounds of families (Courser, Shamblen, Lavrakas, Collins, & Ditterline, 2009; Esbensen, et al., 1996; Esbensen, Hughes Miller, Taylor, He, & Freng, 1999; Unger, et al., 2004). On the other hand, parents may have given their informed consent but students might not have been present on the testing day, might not have correctly answered the questions, or may have left the study after a certain amount of participation (dropout). Study dropout in particular may be a sign of educational problems such as repeating a year or changing school type, and therefore needs to be treated cautiously (van de Grift, 2009).
In other words, treatment-related attrition may be a serious threat to the internal validity of the estimated results (West & Thoemmes, 2010). In the first analysis, the data of all secondary school students in schools in which competence measurement took place and for whom parental consent was present were included in the analysis.
Missing data on measures of reading comprehension and vocabulary were replaced by multiple imputation (m = 5) using a broad set of auxiliary variables. Multiple imputation was implemented by using an R script by Robitzsch (personal communication, March 18, 2011) controlling the imputation with Partial Least Squares regression within MICE (van Buuren & Oudshoorn, 2000). In order to verify the results of the first descriptive analysis, a second descriptive analysis was run by which, again, a dataset to which multiple imputation was applied was used, but the analysis was restricted to students who were still actively participating in the study in Grade 7, who did not change their type of school, and who did not repeat a class during the time period under investigation. We will denote this reduced sample as the “active sample”
as students were still actively participating in the study in Grade 7. Finally, an EM algorithm that applied single imputation was used on the covariates that were used in the Propensity-Score-Matching. Although single imputation does not seem to be an adequate strategy in outcome analyses, it seems to be a sufficient and effective approach in the context of Propensity-Score-Matching (Stuart, 2010). The propensity score matching analysis was run exclusively using the active subsample of n = 658 students, for whom data from the primary school years were available and who were still active participants in the BiKS-8-14 longitudinal study in Grade 7.
Results
Developmental Differences in Reading Comprehension and Vocabulary
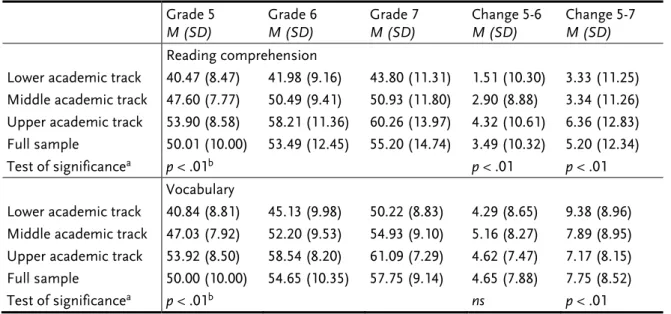
In order to trace interindividual differences in the development of reading comprehension and vocabulary, difference scores based on models of true intraindividual change were computed. The models were specified as baseline models, allowing for the analysis of differences in changes in reading comprehension and vocabulary between Grade 5 and Grade 6 (Change 6-5) as well as Grade 5 and Grade 7 (Change 7-5). A graphical illustration of the development of reading comprehension and vocabulary by type of school for the entire sample of secondary school students is depicted in Figures 2 and 3. The corresponding estimated results are presented in Table 1.
Table 1. Reading Comprehension and Vocabulary Development by School Track
Grade 5
M (SD)
Grade 6 M (SD)
Grade 7 M (SD)
Change 5-6 M (SD)
Change 5-7 M (SD)
Reading comprehension
Lower academic track 40.47 (8.47) 41.98 (9.16) 43.80 (11.31) 1.51 (10.30) 3.33 (11.25) Middle academic track 47.60 (7.77) 50.49 (9.41) 50.93 (11.80) 2.90 (8.88) 3.34 (11.26) Upper academic track 53.90 (8.58) 58.21 (11.36) 60.26 (13.97) 4.32 (10.61) 6.36 (12.83) Full sample 50.01 (10.00) 53.49 (12.45) 55.20 (14.74) 3.49 (10.32) 5.20 (12.34) Test of significancea p < .01b p < .01 p < .01 Vocabulary
Lower academic track 40.84 (8.81) 45.13 (9.98) 50.22 (8.83) 4.29 (8.65) 9.38 (8.96) Middle academic track 47.03 (7.92) 52.20 (9.53) 54.93 (9.10) 5.16 (8.27) 7.89 (8.95) Upper academic track 53.92 (8.50) 58.54 (8.20) 61.09 (7.29) 4.62 (7.47) 7.17 (8.15) Full sample 50.00 (10.00) 54.65 (10.35) 57.75 (9.14) 4.65 (7.88) 7.75 (8.52) Test of significancea p < .01b ns p < .01 Note. Sample size was n = 370 students in lower academic track schools, n = 323 in middle academic track schools, and n = 1,108 students in upper academic track schools.
aIt was tested whether estimates were equal between students attending lower, middle and upper academic track schools.
bMplus Type is General was used as Grade 5 reading comprehension/vocabulary was treated as manifest.
First, results indicated large differences in reading comprehension in Grade 5 between students in the different school tracks. Students attending upper academic track schools on average achieved the highest reading comprehension score, whereas students in the lower academic track schools achieved the lowest. Furthermore,
significant differences in the development of reading comprehension between different school tracks were found: Between Grade 5 and Grade 6, students in the upper academic track schools showed the largest increase in reading comprehension, followed by students attending middle academic track schools. The smallest increase was measured in the group of lower academic track students.2 A model constraint representing equal average reading comprehension development between the three type of schools was significant (Δχ2 = 12.212, df = 2, p < .01), indicating that developmental differences between school tracks are of statistical relevance. Regarding the development of reading comprehension for the full 2-year period between Grade 5 and Grade 7, we still found a clear statistically significant difference between students in the different school tracks (Δχ2 = 22.458, df = 2, p < .01). Again, students attending upper academic track schools showed the highest learning rate in comparison to lower and middle academic track students. The average learning rate of students attending lower academic track schools was comparable in size to the learning rate of the middle academic track students.
2 Due to the application of a different scaling and imputation procedure as well as the usage of different analytic models, the reported growth rates may slightly vary from the results reported by Pfost, Karing, Lorenz, and Artelt (2010).
Figure 2. Development of reading comprehension by type of school. Estimates are based on the full sample of secondary school students (cf. Table 1 for corresponding data).
Figure 3. Development of vocabulary by type of school. Estimates are based on the full sample of secondary school students (cf. Table 1 for corresponding data).
Regarding vocabulary, again, strong interindividual differences in Grade 5 between students attending the different types of schools were present. When tracing the development of vocabulary between Grade 5 and Grade 6, no differences in the learning rate between students attending different types of schools were found (Δχ2 = 1.220, df = 2, ns). However, when analyzing the long-term development of vocabulary between Grade 5 and Grade 7, significant differences occurred (Δχ2 = 10.144, df = 2, p < .01). Interestingly, the developmental pattern was different from the one found for reading comprehension. Whereas for reading comprehension, the highest learning rate was found for students attending upper academic track schools; for vocabulary, the highest learning rate was found for students attending lower academic track schools. This means that lower academic track students caught up to the performance of the better performing middle and upper academic track students who were comparable in their learning rates.
In summary, results based on the full sample of secondary school students provide evidence for a widening gap or fan-spread effect for reading comprehension between students attending different school tracks, whereas with regard to the development of vocabulary, the opposite seems true: On average, students attending lower academic track schools showed the largest gains in vocabulary, whereas the smallest gains were found for upper academic track students.
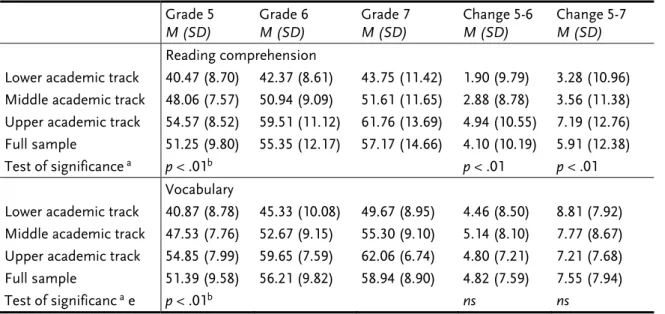
Then, the same two difference score models for reading comprehension and vocabulary were estimated, but analyses were restricted to the sample of students who were still actively participating in the BiKS study in Grade 7, who did not change their type of school, and who did not have to repeat a class. This restriction reduced the sample size by n = 443 (24.6%) students, leading to an effective sample size of n = 1,358 (75.4% of the full sample) students. The reduced or active sample was composed of n = 196 (formerly n = 370; 53.0%) lower academic track students, n = 267 (formerly n = 323; 82.7%) middle academic track students, and n = 895 (formerly n = 1,108, 80.8%) upper academic track students. The estimated model results for the active sample are presented in Table 2.
Table 2. Reading Comprehension and Vocabulary Development by School Track (Active Sample)
Grade 5
M (SD)
Grade 6 M (SD)
Grade 7 M (SD)
Change 5-6 M (SD)
Change 5-7 M (SD)
Reading comprehension
Lower academic track 40.47 (8.70) 42.37 (8.61) 43.75 (11.42) 1.90 (9.79) 3.28 (10.96) Middle academic track 48.06 (7.57) 50.94 (9.09) 51.61 (11.65) 2.88 (8.78) 3.56 (11.38) Upper academic track 54.57 (8.52) 59.51 (11.12) 61.76 (13.69) 4.94 (10.55) 7.19 (12.76) Full sample 51.25 (9.80) 55.35 (12.17) 57.17 (14.66) 4.10 (10.19) 5.91 (12.38) Test of significance a p < .01b p < .01 p < .01 Vocabulary
Lower academic track 40.87 (8.78) 45.33 (10.08) 49.67 (8.95) 4.46 (8.50) 8.81 (7.92) Middle academic track 47.53 (7.76) 52.67 (9.15) 55.30 (9.10) 5.14 (8.10) 7.77 (8.67) Upper academic track 54.85 (7.99) 59.65 (7.59) 62.06 (6.74) 4.80 (7.21) 7.21 (7.68) Full sample 51.39 (9.58) 56.21 (9.82) 58.94 (8.90) 4.82 (7.59) 7.55 (7.94)
Test of significanc a e p < .01b ns ns
Note. The estimates refer to students who were still actively participating in the BiKS study in Grade 7, who did not change their type of school, and who had not repeated a class during the time period under investigation (active sample). Sample size was n = 196 students in lower academic track schools, n = 267 in middle academic track schools, and n = 895 students in upper academic track schools.
aIt was tested whether estimates were equal between students attending lower, middle and upper academic track schools.
bMplus Type is General was used as Grade 5 reading comprehension/vocabulary was treated as manifest.
In comparison to the estimated results for the full sample (cf. Table 1), the estimations for the active sample (cf. Table 2) differed in two ways: First, the overall reading comprehension and vocabulary levels were about one tenth of a standard deviation higher in the reduced, active sample than in the full sample. This may be due to two causes. On the one hand, dropout was higher in lower academic track schools than in middle and upper academic track schools. On the other hand, especially within the upper academic track schools, students with lower achievement levels tended to drop out more often. Second, whereas in the first set of analyses, significant differences in the development of vocabulary between Grade 5 and Grade 7 between school tracks were found, analyses based on the active sample did not confirm this result (Δχ2 = 3.543, df = 2, ns). This difference might be attributable at least in part to a lower estimated vocabulary gain between Grade 5 and Grade 7 for students attending lower academic track schools in the active sample in comparison to the complete sample that included student dropouts. With regard to the development of reading comprehension, significant developmental differences in favor of students attending upper academic
track schools were found, confirming the results of the first analysis that was based on the data of all secondary school students.
The Effect of Institutional Differences in Learning Environment on the Development of Reading Comprehension and Vocabulary
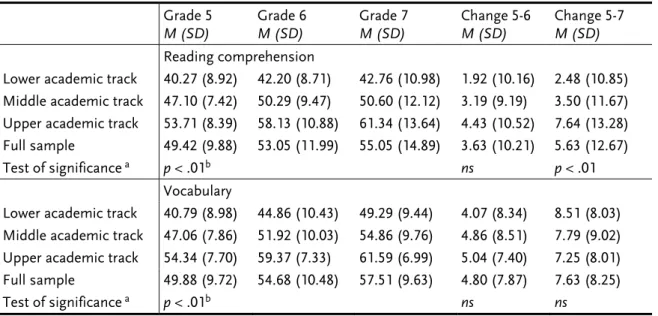
In order to test whether differences in the development of reading comprehension and vocabulary could be attributed to institutional differences in the learning environment, the selectivity of the students into the different school types had to be taken into account. Analyses were restricted to a subsample of n = 658 students, for whom information – inter alia test data – from the elementary school years was available and who were still active study participants in Grade 7 (active subsample). The developmental trends for reading comprehension and vocabulary for this longitudinal subsample of active secondary school students were comparable to the developmental trends for the full sample of active secondary school students (the full sample comprised also students that were not tested in primary school; cf. Tables 2 and 3).
Table 3. Reading Comprehension and Vocabulary Development by School Track (Active Elementary-Secondary-School Longitudinal Subsample)
Grade 5
M (SD)
Grade 6 M (SD)
Grade 7 M (SD)
Change 5-6 M (SD)
Change 5-7 M (SD)
Reading comprehension
Lower academic track 40.27 (8.92) 42.20 (8.71) 42.76 (10.98) 1.92 (10.16) 2.48 (10.85) Middle academic track 47.10 (7.42) 50.29 (9.47) 50.60 (12.12) 3.19 (9.19) 3.50 (11.67) Upper academic track 53.71 (8.39) 58.13 (10.88) 61.34 (13.64) 4.43 (10.52) 7.64 (13.28) Full sample 49.42 (9.88) 53.05 (11.99) 55.05 (14.89) 3.63 (10.21) 5.63 (12.67) Test of significance a p < .01b ns p < .01 Vocabulary
Lower academic track 40.79 (8.98) 44.86 (10.43) 49.29 (9.44) 4.07 (8.34) 8.51 (8.03) Middle academic track 47.06 (7.86) 51.92 (10.03) 54.86 (9.76) 4.86 (8.51) 7.79 (9.02) Upper academic track 54.34 (7.70) 59.37 (7.33) 61.59 (6.99) 5.04 (7.40) 7.25 (8.01) Full sample 49.88 (9.72) 54.68 (10.48) 57.51 (9.63) 4.80 (7.87) 7.63 (8.25)
Test of significance a p < .01b ns ns
Note. The estimates refer to the subsample of all secondary school students for whom data from the elementary school years were available. Furthermore, students were still actively participating in the BiKS study in Grade 7, did not change their type of school, and had not repeated a class during the time period under investigation (active sample). Sample size was n = 136 students in lower academic track schools, n = 150 in middle academic track schools, and n = 372 students in upper academic track schools.
aIt was tested whether estimates were equal between students attending lower, middle and upper academic track schools.
bMplus Type is General was used as Grade 5 reading comprehension/vocabulary was treated as manifest.