N EAR AND M ID -I NFRARED O BSERVATIONS OF THE
G AL ACTIC C ENTER
O
N THEN
ATURE OFD
IFFUSEE
MISSION ANDF
AINTC
OMPACTS
OURCESINAUGURAL-DISSERTATION
zur
Erlangung des Doktorgrades
der Mathematisch-Naturwissenschaftlichen Fakultät der Universität zu Köln
vorgelegt von
N
ADEENB
ASSAMI
ZZATS
ABHAaus Amman, Jordanien
Köln, 2015
Berichterstatter: Prof. Dr. Andreas Eckart Prof. Dr. Peter Schneider Tag der letzten mündlichen Prüfung: 5. Dezember 2014
A BSTRACT
The center of our Galaxy is made up of stars, stellar remnants, dust, molecular and ioni- zed gas, with a supermassive black hole at its heart. This black hole is surrounded by a small cluster of high velocity stars, known as the S-stars. One aim of this thesis is to cons- train the amount and nature of the stellar and dark mass associated with this cluster in the immediate vicinity of the black hole. I use near-infrared imaging to determine theKs- band luminosity function of the S-star cluster members, and the distribution of the diffuse background emission and the stellar number density counts around the central black ho- le. This allows one to determine the stellar light and mass contribution expected from the faint members of the cluster. I then use post-Newtonian N-body techniques to investigate the effect of stellar perturbations on the motion of S2, as a means of detecting the num- ber and masses of the perturbers. I find that the stellar mass derived from theKs-band luminosity extrapolation is much smaller than the amount of mass that might be present considering the uncertainties in the orbital motion of the star S2. Also the amount of light from the fainter S-cluster members is below the amount of residual light at the position of the S-star cluster after removing the bright cluster members. If the distribution of stars and stellar remnants is peaked near the supermassive black hole, observed changes in the orbital elements of S2 can be used to constrain both their masses and numbers. Based on simulations of the cluster of high velocity stars, I find that at a wavelength of 2.2µm, close to the confusion level for 8 m class telescopes, blend stars will occur. These line-of-sight clusterings will last for typically three years before they dissolve due to proper motions.
I also present the analysis of mid-infrared VISIR observations. Their field of views are centered on the major Galactic Center targets that we plan to observe with the MIRI in- strument aboard the James Webb Space Telescope (JWST). The value of these new ob- servations lies in the fact that they are the first and only data that cover a large field of view of the region with spatial resolutions better than Spitzer survey data. The spectral indices of the compact sources detected in our multi-band observations will aid in the identification of massive young stellar objects, and will allow the tracing of their spatial distribution and concentration. When combined with the current multi-wavelength sur- veys and future MIRI observations it will enable us to trace and draw a better picture of the past 8 Myr of cluster based star formation in the Galactic Center. Furthermore, I report
i
a curious convex-like mid-infrared feature at a distance of 0.68 pc (1700) from the position of the supermassive black hole. This feature resembles a stellar bow shock with a symme- try axis pointing toward the Center. I discuss the possible nature of this feature and the implications of its alignment with other dusty comet-like objects previously found inside the central parsec. All of these objects are remarkably aligned perpendicular to the plane of young mass-losing stars very close to the central SMBH. The lack of a larger number of similar objects in the field can be explained either by the short life span of massive stars and/or the intermittent nature of the responsible mechanism.
Z USAMMENFASSUNG
Das Zentrum unserer Galaxie setzt sich aus Sternen, Sternüberresten, Staub, molekularem und ionisiertem Gas zusammen. In deren Mitte befindet sich ein supermassives schwar- zes Loch. Dieses supermassive schwarze Loch ist unmittelbar von einer kleinen Anhäu- fung von Sternen mit hohen Geschwindigkeiten umgeben, den sogenannten S-Sternen.
Der erste Teil dieser Arbeit ist es die stellare und die dunkle (nicht sichtbare) Masse dieses Haufens und ihre Eigenschaften näher zu bestimmen. Anhand von Nahinfrarotaufnah- men ermittele ich dieKs-Band Leuchtkraftfunktion der S-Sternhaufen Sterne, die Vertei- lung der diffusen Hintergrundemission und die Sternanzahldichte in der Umgebung des supermassiven schwarzen Lochs. Auf diese Weise kann man den Beitrag der lichtschwä- cheren Sterne zur Gesamtleuchtkraft und -masse abschätzen. Darüber hinaus untersuche ich mit Hilfe von post-Newtonschen N-Teilchen Simulationen die Störung der Bahnbewe- gung von Stern S2 durch andere S-Sterne, um die Anzahl und Masse der störenden Sterne zu bestimmen. Hierbei stelle ich fest, dass die stellare Masse basierend auf der Extrapo- lation derKs-Band Leuchtkraft wesentlich kleiner ist als die Abweichungen der Bahnbe- wegung von S2 andeuten. Außerdem ist die Lichtmenge der lichtschwächeren S-Sterne geringer als die Restlichtmenge an der Stelle des S-Sternhaufens nach Abzug aller hellen S-Sterne. Unter der Annahme, dass die Verteilung der Sterne und Sternäberreste ihr Ma- ximum in der Nähe des supermassiven schwarzen Lochs erreicht, kann man die Massen und die Anzahl der (störenden) Sterne anhand der beobachten Änderungen der Bahnpa- rameter von S2 abschätzen. Meine Simulationen des Hochgeschwindigkeitssternhaufens zeigen, dass bei Beobachtungen bei einer Wellenlänge von 2.2µm und nahe an der Konfu- sionsgrenze für Teleskope der 8 m-Klasse einzelne Sterne sich überdecken können. Diese Anhäufungen entlang der Sichtlinie hält für gewöhnlich 3 Jahre an bevor sie sich auf Grund ihrer Eigenbewegung der Sterne wieder auflösen.
Der zweite Teil meiner Arbeit behandelt die Analyse von Aufnahmen im mittleren In- frarot mit VISIR von Hauptbeobachtungsobjekten im Galaktischen Zentrum, die wir auch mit dem MIRI Instrument an Bord des JWST zu beobachten beabsichtigen. Diese Beob- achtungen decken als erste und einzige ein großes Gesichtsfeld dieser Region mit einer höheren räumlichen Auflösung als die Spitzer Studie ab. Der Spektralindex der in unseren Multi-Band-Aufnahmen detektieren Punktquellen hilft bei der Identifizierung von massi-
iii
ven jungen stellaren Objekten und derer räumlichen Verteilung und Anhäufung. Die Kom- bination von aktuellen Multi-Wellenlängen-Studien und zukünftigen MIRI Beobachtun- gen wird uns ein tieferes Verständnis der Sternentstehung der letzten 8 Millionen Jahren in Sternhaufen im Galaktischen Zentrum in ermöglichen.
Im Zuge meiner Analyse der Daten im mittleren Infrarot fiel mir eine ungewöhnliche, konvex-förmige Struktur in einer Entfernung von 0.68 pc (17”) von der Position des su- permassiven schwarzen Lochs auf. Diese Struktur ähnelt einer Bugstoßwelle eines Sterns und ihre Symmetrieachse weist in Richtung des supermassiven schwarzen Lochs im Zen- trum. Ich erläutere die mögliche Natur dieser Erscheinung und die Bedeutung ihrer Ori- entierung in Bezug auf andere staubige, kometenartig geformte Objekte, die im zentralen Parsec bereits gefunden wurden. Bemerkenswerterweise zeigen all diese Objekte nahezu senkrecht auf die scheibenhafte Ansammlung junger, Masse-verlierender Sterne direkt um das supermassive schwarze Loch. Die geringe Zahl ähnlicher Objekte in dem Gebiet lässt sich durch die kurze Lebensspanne massiver Sterne und/oder das sporadische Auftreten des verantwortlichen Mechanismus erklären.
C ONTENTS
Contents v
1 General Introduction 1
1.1 The Milky Way . . . 1
1.2 The Galactic Center . . . 3
1.3 Observations in the Infrared . . . 9
Adaptive Optics in the Near Infrared . . . 12
Chopping/Nodding Technique in the Mid Infrared . . . 14
1.4 Dissertation Outline. . . 17
2 The Nature of Diffuse NIR Emission in the Inner Arcsecond 19 2.1 Introduction . . . 20
2.2 Observations and Data Reduction . . . 24
2.3 The Central Few Tenths of Parsecs . . . 24
KLF of the S-star Cluster . . . 25
The Diffuse NIR Background. . . 26
Extrapolating the KLF of the S-star Cluster . . . 28
Observational Limits on the Stellar Light and Mass . . . 30
Limits on the Stellar light . . . 31
Limits on the Stellar Mass . . . 31
2.4 Dynamical Probes of the Distributed Mass . . . 32
Fighting the Limits on the Power of Stellar Orbits. . . 40
Improving the Single Orbit Case . . . 40
Improving by Using Several Stars . . . 41
2.5 Simulating the Distribution of Fainter Stars . . . 41
2.6 Summary and Conclusion . . . 47
3 Mid Infrared Mapping of the Central Clusters 49 3.1 Introduction & Motivation . . . 49
3.2 Observations . . . 52
3.3 Data Reduction . . . 55
3.4 Results and Discussion . . . 56 v
3.5 Summary . . . 63
4 New MIR Bow Shock Source at the Galactic Center 69 4.1 Introduction . . . 69
4.2 Results. . . 73
The Extended Source X24. . . 73
Stellar Bow Shock Scenario. . . 75
Nature of the External Wind . . . 80
4.3 Summary and Conclusion . . . 83
5 Final Remarks 85
Bibliography 89
List of Figures 105
List of Tables 106
List of Acronyms 107
Acknowledgements 109
Erklärung 111
C H A P T E R
1
G ENERAL I NTRODUCTION
In early September, 2014, Nature published an article that adds another detail to our understanding of our place in the Universe. Tullyet al.(2014) study the distances and velocities of about 8000 galaxies. By removing the effect of cosmic expansion on these galaxies, they were able to derive a quantity called peculiar velocity that reflects gravita- tional perturbations. The resulting map showed that our galaxy the Milky Way (MW) is part of a supercluster they call "Laniakea", of which all the galaxies are moving inward within its boundary. Our location is in the outskirts of this supercluster close to another one called "Perseus-Pisces". Their findings shed light on the reason why our galaxy is moving at a rate of 600 km s−1towards the constellation of Centaurus (Dressleret al., 1987).
Not only are we located in the outskirts of the local supercluster, but we are also in the outskirts of the Milky Way, a fact that makes studying the plethora of activity in the Galactic Center all the more difficult. I will begin this dissertation by giving an overview of our Galaxy and the Galactic Center environment, and follow this up with a brief description of the infrared observational techniques I utilize to study the Galactic Center, the subject of this thesis.
1.1 The Milky Way
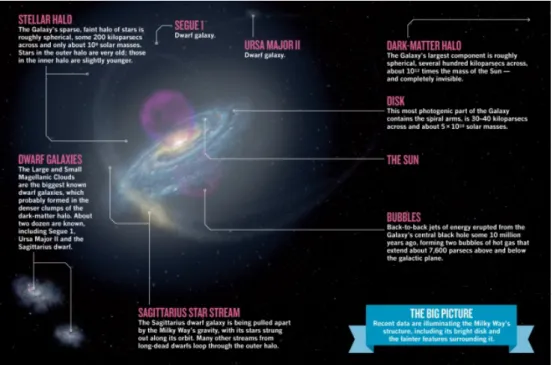
The Milky Way is a barred spiral galaxy that harbors about 300 billion stars and has a di- ameter of∼100 000 light years (see Fig.1.1). It is viewed across the night sky as a faint band of light entwined with dark lanes. It is this grand appearance that inspired the name,
1
Figure 1.1:Illustration of the Milky Way and its surroundings. Image credit:Finkbeiner(2012) Na- ture news feature.
the Milky Way, since our ancestors variously described it as a river, as a path, as milk. In Arabic, it is called "Darb el-Ttabbanah" or "Darb el-Llabbaneh" which translates to either literally the Milky Way, or the Hay Way. The Hay Way comes from the similarities ancient Arabs noticed between fallen hay and the way the band appears in the sky. This band of light is our Galaxy seen edge-on due to the presence of our Solar System in one of the outer arms of the Galaxy.
Besides the considerable number of stars, the MW also contains nebulae, gas clouds, dust lanes and dark clouds. Like any other galaxy, a dark matter halo surrounds our own where astronomers inferred its existence since the 1970s through the gravitational influ- ence it has on the rotation of the Galaxy. This halo has a spherical shape and a mass of about 1 trillion Suns and extends hundreds of thousands of light years or in another unit, hundreds of kiloparsecs, where 1 kpc∼3200 light year. There are also sub-halos of dark matter within the larger one. In addition to the dark matter, there are about two dozen dwarf galaxies that are believed to have been formed as a result of those dark-matter sub- halos pulling in gas which then form stars. Getting closer to the Galaxy itself, observations revealed the existence of faint streamers of stars that seem to trace the orbits of the dwarf galaxies as they were crossing the newly-formed Milky Way. One such streamer is illus- trated in Fig.1.1. Surrounding the disk of the MW (up to about 100 kpc) a faint, diffuse
1.2. The Galactic Center 3
halo of stars can be seen. It has a mass of roughly 109solar masses. Heavy element analy- sis shows that those stars located furthest from the MW are of older age than those closer to it. In fact, evidence points to there being two distinct halos where the outer one rotates against the Galaxy’s rotation while the younger inner one rotates in the same direction (Carolloet al.,2007).
The disk of the Galaxy is made of young massive blue stars, reddish HII regions (ionized clouds caused by young stars), young clusters and dust lanes and filaments, where star formation is taking place. This disk has a diameter of≤30 kpc and a thickness of∼1 kpc.
It is believed to have been formed as a result of the interaction between the infalling gas and the dwarf galaxies. As the matter grew in mass and movement around the center it flattened into a disk. The spiral arms visible today within that disk are thought to have been caused by density waves from the interactions between the stars and gas orbiting the center.
The Galaxy’s center is located at about 8 kpc from the Solar System. It consists of a spherical distribution of old stars (∼billion years old) called the bulge, and weighs about 1010Suns. These old stars appear red in comparison to the white/blue younger stars and star forming regions in the disk. Inside the bulge there is an indication for a weak bar (or triaxial bulge) about 3 kpc long. At the very heart of the stellar content of the bulge and the Galaxy lies a black hole with a mass of roughly 4 million solar masses. Though it is massive, Sagittarius A*, or shortly Sgr A*1, lies on the lower limit of supermassive black holes (SMBHs) as some of these galactic black holes can reach billions of solar masses.
In 2012, a group of astronomers (Sohnet al.,2012;van der Marelet al.,2012a,b) were able to predict the future of the Milky Way. They measured the position and proper motion of the neighboring Andromeda galaxy and found that it is separated from our own by about 770 kpc. What they also found is that both galaxies are on a collision course (with a speed of 109 km s−1) estimated to take place 6 billion years from now. The merging process will be gradual, over a billion years, where an elliptical galaxy will be born from the two spirals.
1.2 The Galactic Center
The Center of our Galaxy is made up of stars, stellar remnants, dust and molecular and ion- ized gas, with a supermassive black hole at its heart. These different components interact with each other and provide a very complex region of structures that have long motivated astronomers into developing new techniques and methods to better understand the phe- nomena and physical processes taking place there. The importance of studying our Galac- tic Center lies in it being the nearest galactic nucleus to us. It is located at about 8 kpc or
∼28000 light years. The nearest center of a similar galaxy to the MW is Andromeda’s (M31 or NGC 224), which is located at roughly 2.5 million light years from Earth.
1Sgr A* refers to the radio source believed to be associated with the supermassive black hole at the Center.
Figure1.2:CompositeimageofthecentralhalfofadegreeofourGalaxy,providedbytheHubbleSpaceTelescope,theSpitzerSpaceTelescope,andtheChandraX-rayObservatory.Imagecredit:NASA/JPL-Caltech/ESA/CXC/STScI.
1.2. The Galactic Center 5
Watching the faint band of the MW on a clear night one notices the dark lanes (of dust) that prevent most of the visible light of the stars from reaching us. These dust lanes are par- ticularly prominent when looking in the direction of the constellation Sagittarius, where the brightest region in our Galaxy, the Center, lies. However, switching to other wave bands one can peer through the dusty MW disk and see a completely different picture. The Cen- ter is bright in the radio, infrared and X-rays.
The nucleus of the MW spans about 100 pc (∼300 light years). Figure1.2shows the Center with a composite image taken using three different telescopes at three different wavelengths, two in the infrared and one in the X-ray. The brightest spot in the image is the location of the core of the Galaxy, Sagittarius A complex. The infrared light (red) reveals the considerable number of stars hiding in visible light behind the thick veil of dust toward the Center. The radiation from these stars heats the nearby gas and dust and causes it to glow (yellow), such as the different-shaped filaments seen across the image. The arcs to the left of the mosaic are bright due to the nearby massive stellar clusters, the Quintuplet and Arches cluster, warming up the gas. The presence of massive stars is not exclusive to the stellar clusters but rather spread across the mosaic as shown byWanget al.(2010) using theHubble Telescopelayer of the composite image of Fig.1.2(more details in Chapter3).
In fact, the complex gas structures seen in the mosaic are caused by the radiation and stellar winds of these massive stars. The X-ray view is quite different from the infrared one (blue and pink light). Here the higher energy emission is mostly originating from material being accreted into black holes and compact sources. The brightest region in the X-ray, Sagittarius A, is caused by diffuse gas heated to millions of degrees by outflows and winds from the SMBH, in addition to those from winds of giant stars and stellar explosions.
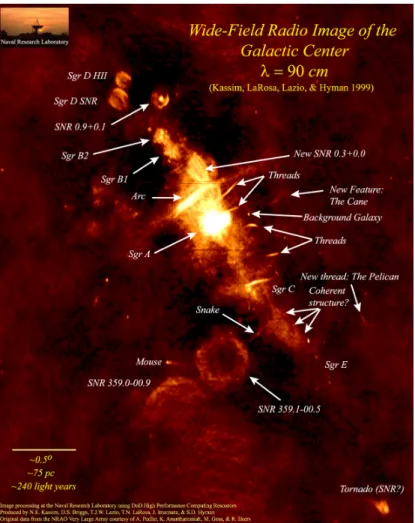
The Sagittarius A complex, a bright region in radio, is believed to trace matter orbiting the central black hole. One of the best images of the region is the long wavelength (∼1 m) map of the Center shown in Fig.1.3fromLaRosaet al.(2000). The image shows several supernova remnants and giant molecular clouds, such as Sgr B1 and B2. Also visible across are synchrotron emitting filaments. To get closer to the center and reveal more detailed structures, observing at shorter wavelengths with bigger telescopes becomes necessary.
The largest feature that can be seen as we get closer to the Center is Sgr A East. This shell- like feature extends about 30.5×20.5 or 10.5×8 pc and its non-thermal emission is bright in the radio as well as in the X-ray. It is believed to be a supernova remnant (SNR), though its location extremely close to the Galactic nucleus has led some to believe that it might not be a simple SNR but something more powerful. A more recent claim is that the hypothesized supernova actually expanded into a region of lower density cleared out by the winds of massive stars (Yusef-Zadeh and Morris,1987;Maedaet al.,2002;Fryeret al.,2006).
In projection, Sgr A East appears to enclose a three-armed structure called Sgr A West and a clumpy ring surrounding it. The clumpy molecular ring, known as the circum- nuclear disk (CND) (Fig.1.4) is estimated to have a mass of∼106solar masses, consist-
Figure 1.3:A radio (90 cm) image of the GC region spanning a distance of 1000 light-years (∼300 pc).
Image credit: NRAO/AUI and N.E. Kassim, Naval Research Laboratory.
ing of several dense clouds of molecular gas (up to 107cm−3Guestenet al.,1987;Jackson et al.,1993;Wrightet al.,2001;Herrnstein and Ho,2002) and warm (few 100 K) dust (Zylka et al.,1995). The CND, with a radius between 1.5 and 7 pc, is believed to be orbiting the nucleus and fed by gas infall from dense molecular clouds further away from the Center.
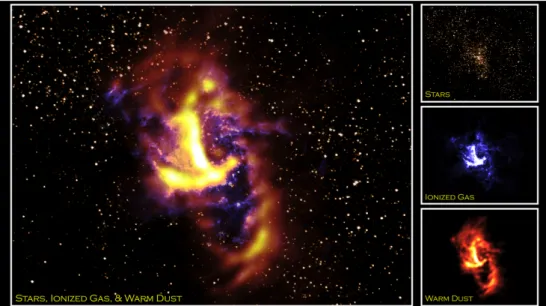
Sgr A West, also known as the "mini-spiral" can be seen in Fig.1.4as the three-armed structure of ionized gas and dust spanning over the central 3 pc. The emission is thermal in nature contrary to the one detected from Sgr A East. These structures are believed to be streamers of ionized matter (few tens of solar masses) on in-falling trajectories from the inner edge of the surrounding CND. This ionized gas appears to be orbiting the Center in a projected motion from east to west with a speed of about 100 km s−1at a distance of
∼3 light years (Yusef-Zadehet al.,1998). Assuming a Keplerian rotation around the center,
1.2. The Galactic Center 7
Figure 1.4: Multi-wavelength image of the Galactic Center obtained by different telescopes.
The infrared emission from stars by HST/NICMOS, ionized gas HST/NICMOS, and warm dust by SOFIA/FORCAST. The image covers the central 10 light years of the Galaxy. Image credit: Stars:
NASA/HST/NICMOS; Ionized Gas: NASA/HST/NICMOS; Warm Dust: NASA/DLR/USRA/DSI/FORCAST Team/Lauet al.(2013).
this corresponds to an enclosed mass of∼3.5×10⁶M¯. This was the first indication for the presence of a dark mass at the center of the Galaxy. The in-falling gas also interacts with the intense winds originating from the stars located in and within the streamers and forms bow shock-like feature. These streamers are designated as the northern arm, eastern arm and the western arc. The three arms have been modeled as three bundles of Keplerian orbits around the SMBH byZhaoet al.(2009), whileIronset al.(2012) prefer a model of one-armed spiral density wave.
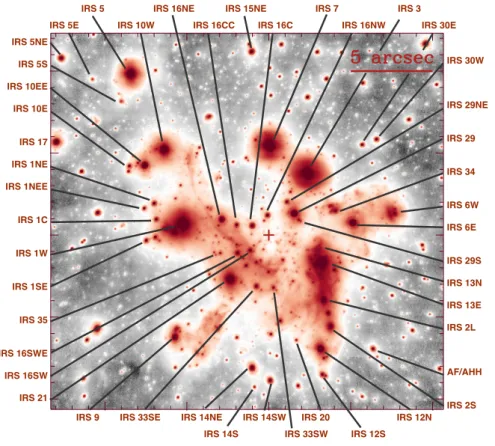
The nuclear stellar cluster (NSC) is what comes further in. Observations in the infrared have long shown the high density of stars at the heart of the Galaxy. However, tracing the orbits of individual stars, especially those closest to the densest region of the clus- ter, its center, only became possible with the aid of special techniques of Speckle imaging and the introduction of adaptive optics (AO) on 8–10 m class telescopes. Now we can reach resolutions as high as 40 mas in the near-infrared. The NSC population of stars in- cludes mostly main sequence stars (∼3M¯), super-giants, giants and Wolf-Rayet stars. The brightest are the IRS sources (see Fig.1.5) such as IRS 7, 3, 13, 16 and the sources embed- ded in the northern arm of the mini-spiral, which can be seen as well in Fig.1.5through its dust emission at 3.8µm. The cluster is dominated, as expected for a nuclear cluster, by old, late-type (red) giants, super-giants and asymptotic giant branch (AGB) stars. How- ever, spectroscopic observations revealed that some of the bright stars are hot early-types
IRS 5E IRS 10W IRS 16CC IRS 16C IRS 16NW IRS 30E IRS 5 IRS 16NE IRS 15NE IRS 7 IRS 3
IRS 14S IRS 33SW IRS 12S IRS 9 IRS 33SE IRS 14NE IRS 14SW IRS 20 IRS 12N
IRS 30W
IRS 29NE
IRS 29
IRS 34
IRS 6W IRS 6E
IRS 29S IRS 13N IRS 13E IRS 2L
AF/AHH
IRS 2S
IRS 5NE IRS 5S IRS 10EE IRS 10E
IRS 17 IRS 1NE IRS 1NEE
IRS 1C
IRS 1W
IRS 1SE
IRS 35
IRS 16SWE IRS 16SW IRS 21
Figure 1.5:L0-band (3.8µm) mosaic of the Galactic Center stellar cluster obtained with VLT NaCo in 2012. Most sources are identified based onViehmannet al.(2005). One arcsec translates to∼0.04 pc for an 8 kpc distance to the GC. The position of the supermassive black hole Sagittarius A* (Sgr A*) is marked by a cross. North is up and east is to the left.
(Krabbeet al.,1995;Genzelet al.,1996;Paumardet al.,2006;Tanneret al.,2006). They are
"HeI-stars" post main-sequence, blue super-giants and Wolf-Rayet (WR) stars with ages of 2–8 Myrs and zero age main-sequence stars (ZAMS) of masses 30–100M¯(Martinset al., 2007).
The dusty and dense IRS 13 complex, just about 0.1 pc from the position of the central black hole, reveals a concentrated HII emission in addition to X-rays. IRS 13E is made of three O/WR stars and possibly, though this is highly debatable, an intermediate mass black
1.3. Observations in the Infrared 9
hole (IMBH). The fainter IRS 13N has long been discussed as to whether it is composed of young stellar objects (YSOs) (e.g.Muži´cet al.,2008) or simply dust concentrations (Fritz et al.,2010). Recently,Jalaliet al.(2014) using hydrodynamical simulations showed that strong orbital compression of clumps orbiting the SMBH on an eccentric orbit leads the gas densities to increase and overcome the tidal density of the black hole, thereby allowing stars to form that are similar to those speculated to be in the IRS 13N complex.
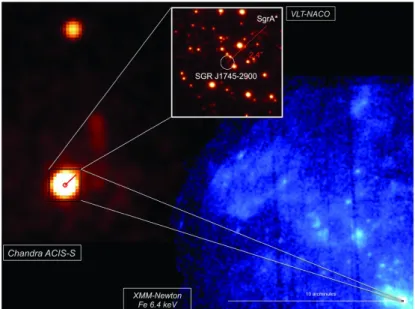
The "S-star cluster" (more details in Chapter2) located in the central arcsecond, cen- tered on the SMBH, is mainly made up of B-stars. A recently added member to the S- cluster is the fast moving cloud of gas and dust, G2, that is approaching the black hole on an eccentric orbit (Gillessenet al.,2012). It is speculated that the cloud will disrupt upon its closest approach to the SMBH and lead to increased activity, starting in the X-ray band, that could span months to years. However,Eckartet al.(2013) argue that the object is most probably a compact dusty object (they refer to it as a dusty s-cluster object, DSO) with a star at its core. This composition will cause the amount of matter from the cloud that is accreted onto the black hole much lower that anticipated.Phiferet al.(2013) also prefers a hidden star scenario. Many ground-based and space telescopes have turned their atten- tion to monitoring the activity of the galactic black hole, Sgr A*, in order to observe the disruption of the cloud live. Up to date, no increased activity of Sgr A* has been recorded besides the frequent modest flares across its observable spectrum. The increased moni- toring of the central region, especially in the X-rays, led to the recent discovery of a pulsar only 0.12 pc (0.38 light years) from the black hole. The discovery came when a very bright flare was recorded bySwiftin April, 2013 (Degenaaret al.,2013;Kenneaet al.,2013) (see Fig.1.6). Shortly afterwards,NuSTAR X-ray telescopeconfirmed the flaring object to be a magnetar with a spin rate of 3.76 seconds (Moriet al.,2013) that is gradually slowing down due to the presence of a high magnetic field that causes the pulsar to radiate energy faster than it normally does.Eatoughet al.(2013) infer from the pulsar’s large Faraday rotation (the rotation of the plane of polarization of the emission in the presence of an external magnetic field) a dynamically important magnetic field near Sgr A*. They use the strength of its magnetic flux to explain the observed emission, from radio to X-ray wavelengths, from the black hole. Evidence of such dynamically important magnetic fields threading the accretion disks of extragalactic supermassive black holes have been reported recently byZamaninasabet al.(2014).
1.3 Observations in the Infrared
William Herschel was the first to discover infrared (IR) radiation in 1800 when he mea- sured thermal radiation beyond the red portion of the visible light, hence the name in- frared. On the electromagnetic spectrum infrared radiation lies in the wavelength range of
∼1 – 1000µm (1 mm). In Astronomy the IR range is divided into subcategories of (i) near- infrared (NIR) (0.7–5µm); (ii) mid-infrared (MIR) (5–30µm); and (iii) far-infrared (FIR) (30 –1000µm). The Earth’s atmosphere only allows certain bands of radiation to pass through
Figure 1.6:Multiwavelength view of the field of SGR J1745-2900 and Sgr A*. The blue image shows the XMM-Newton 6.4 keV Galactic Center view (Pontiet al.,2013), and the black square is a500×500 box around the position of the magnetar. The inset shows the first Chandra ACIS observation of the source. The VLT/NaCo image in the near-infrared is in Ks-band (Schödelet al.,2009). Image credit:
Reaet al.(2013)
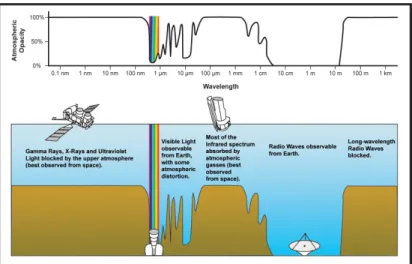
to the surface; they are called the atmospheric windows. Atmospheric opacity is essential for sustaining life on Earth, as it blocks most high energy radiation like X-rays, gamma rays and most of the ultraviolet light. Visible light passes through in addition to lower energy radio waves. Infrared radiation, on the other hand, gets for the most part absorbed by water vapor and also carbon dioxide and oxygen molecules in the atmosphere, and only reaches us in a few narrow ranges (see Fig.1.7). Infrared astronomy is the study of the Uni- verse in the infrared regime. Star forming regions and cool stars with surface temperatures of a few thousand degrees, and other celestial objects are mostly suited to be studied in the IR. The most important atomic and molecular transitions occur in the infrared. These are essential to understand the physical conditions and processes in planetary atmospheres, interstellar clouds, and in distant galaxies. Also the dust present in the heart of galaxies and stellar clusters absorbs the optical and ultraviolet light and re-emits it at the longer IR wavelengths. Circumstellar dusty regions are also bright in the infrared. Almost anything embedded in dust can be peered through with infrared eyes. As a local example in our own Solar System, the zodiacal light is the radiation from the dust particles that were created by evaporating comets and colliding asteroids. Another important application to infrared as- tronomy is the study of the early Universe, as the visible and ultraviolet light emitted that early in time is now red-shifted and can be only observed in the infrared. TheNASA/ESA James Webb Space Telescope (JWST)is especially designed to study that era.
1.3. Observations in the Infrared 11
Figure 1.7:Atmospheric electromagnetic transmittance or opacity. Image credit: NASA/JPL-Caltech
Ground-based observations in the NIR started as early as the 1960s. It was not till the 70s that observations at longer wavelengths became possible with the aid of high-flying airplanes. The first space-borne infrared telescope, theInfraRed Astronomical Satellite (IRAS), came into operation in 1983. The biggest problem with infrared astronomy is the emission from the atmosphere, which peaks at about 10µm. Therefore, ground-based telescopes are placed on high mountains in dry regions where the emission from astro- nomical objects does not get absorbed completely by the presence of water vapor. For the mid to far-IR regimes the only way is to use rockets, balloons, aircraft and space telescopes as some bands get absorbed completely by the Earth’s atmosphere.
Below I describe two of the techniques that are currently employed on ground-based telescopes to observe celestial objects in the near and mid-infrared. I am focusing on these two bands and, hence these two methods only, as they are the ones that will be addressed in this dissertation. The observations I use were taken using the European Southern Ob- servatory Very Large Telescope (ESO VLT)2. The VLT is situated on top of Cerro Paranal at an altitude of 2635 m in the Chilean Atacama desert. The site is particularly suitable for op- tical and infrared observations as the Atacama desert is considered one of the driest places on Earth. The telescope is one of world’s most advanced optical instruments, consisting of four Unit Telescopes (UTs; Antu, Kueyen, Melipal and Yepun) with primary mirros of 8.2 m diameter and four movable 1.8 m diameter Auxiliary Telescopes (ATs). The light of these individual telescopes can be combined to form a giant "interferometer" (VLTI) that can achieve resolutions up to 25 times finer than with the individual ones. The location of the VLT is most suitable to study the Center of our Galaxy as it is mostly visible from the southern hemisphere (see Fig.1.8).
2http://www.eso.org/public/teles-instr/paranal/
Figure 1.8:A panorama photo, taken by ESO Photo Ambassador Yuri Beletsky, that shows the view of the starry sky from the site of ESO’s Very Large Telescope (VLT) at Cerro Paranal during the total lunar eclipse of 21 December 2010. Image credit: ESO/Y. Beletsky.
I first start with the adaptive optics observing technique currently implemented on the VLT instrument NaCo. The Nasmyth Adaptive Optics System (NAOS) and the High- Resolution Near IR Camera (CONICA), in short NaCo, provides multimode, adaptive optics corrected observations in the range 1–5µm3.
Adaptive Optics in the Near Infrared
Atmospheric turbulence makes it rare for any telescope to reach its diffraction-limited resolution, which is determined by the diameter of its primary mirror and the observing wavelength (1.22λ/D). For example, the diffraction limit of the VLT at 2.2µm is 0.05700. Due to the presence of the atmosphere the equation becomesλ/r0∼0.700, where another factor comes into play, the Fried parameter. The Fried parameter represents the strength of the turbulence and is dependent on the wavelength byλ(6/5), e.g. at 2.2µm r0is about 60 cm. There is another important parameter for observations and that is the correlation or coherence time of the turbulence,τ0. This parameter is related tor0and for a wind speed of 10 m s−1,τ0∼60 ms at 2.2µm. The larger these two parameters are the more sta- ble the atmospheric conditions. Luckily for observing the Center, Sagittarius constellation culminates at the Zenith during the southern winter, which happens to be the most suited in terms of the weather conditions.
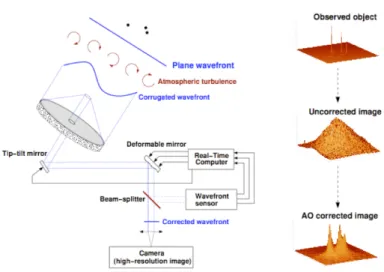
To improve the telescope’s resolution and bring it closer to its diffraction-limited value, a method called Adaptive Optics (AO) is employed to account for the atmospheric turbu- lence. AO does a real-time compensation to the wavefront of the observed astronomical sources by measuring these distortions on a known bright source called a guide star (GS).
A wavefront sensor measures the distortions on the otherwise flat wavefront coming from the star where they are processed by a real-time computer and fed into a deformable mir- ror to correct for them (see Fig.1.9). The image quality is determined by the Strehl Ratio
3The description and numbers mentioned are optimized for Paranal observing site of the VLT, and taken from NaCo manual: http://www.eso.org/sci/facilities/paranal/instruments/naco/doc/
VLT-MAN-ESO-14200-2761_v94.pdf
1.3. Observations in the Infrared 13
Figure 1.9:Principle of adaptive optics system. Image credit: ESO NaCo user manual.
(SR), which refers to the amount of light inside the diffraction-limited core compared to the total flux; i.e. the higher the ratio the better the image quality. ForKs-band obser- vations the optimum achieved SR is∼50%, while forL0it can reach as high as 70%. For shorter wavelengths,J-band, the SR may only reach a few percent.
In general a good AO correction depends on the observing conditions characterized by the seeing (²=0.98λ/r0Fried,1966), how bright the guide star is and its distance to the object of interest. The brighter and closer the GS is to the observing region the better the correction and the resulting point spread function (PSF) is closer to the diffraction limit. For example, observations of the central cluster utilize the presence of the NIR bright (Ks-band magnitude∼7) supergiant IRS 7, located about 5.600north of Sgr A*, as an AO guide star. Other fields of interest that do not have a nearby natural guide star can use the laser guide star (LGS)4. Adaptive optics works well with short-wavelength observations (shortward of 4.2µm), while for longer wavelengths the additional components associated with the AO system introduce higher IR background and the deformable mirror brings background fluctuations that do not cancel correctly.
All IR observations have to be corrected for sky emission and for detector cosmetics.
The sky background forλ≤2.2µm is caused by OH emission at an altitude of∼80 km and have to be sampled approximately every 2 hours of on-source observations. However, at longer wavelengths the thermal background of the atmosphere and telescope dominate
4LGS is an artificial source created by a Sodium Laser (589.5 nm) focused at 90 km altitude in the mesosphere.
The atomic sodium present at that height produces an artificial star of visual magnitude of 11.
and this means that the sky has to be sampled more frequently as the time scale of the fluctuations is short. The detector cosmetics can be minimized by a method calledjitter, which is done by taking several images offseted by a small value of the object of interest.
This way the astronomical sources do not always lie on the same position of the detector array. This method can also be used to estimate the sky background for non-crowded fields. Crowded fields on the other hand need a separate sky observations of a nearby field relatively devoid of sources. For the crowded Galactic Center (GC) field this is achieved by observing a dark cloud located about 40000north and 71300west of the Center.
After the images reach the user, data reduction steps have to be applied to make them suitable for science investigation. These steps involve:
• sky-subtraction: subtracting the sky frame from the object frames.
• flat-fielding: dividing the object frame by a map of the pixel response of the detector array.
• correcting for dead or bad pixels: done by replacing the bad/dead pixels with inter- polations from neighboring pixels.
Then the reduced images are shifted and stacked in a cube with a mean average to get a mosaic image of the celestial object of interest.
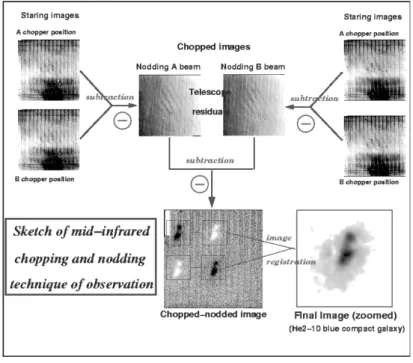
Chopping/Nodding Technique in the Mid Infrared
VISIR, the VLT spectrometer and imager for the mid-infrared, is the instrument used to obtain the MIR data I discuss in this thesis. It provides diffraction-limited imaging at high sensitivity in two MIR wavelength ranges: theN-band (≈8 – 13µm) and theQ-band (16.5 – 24.5µm). It also offers a slit spectroscopy with a spectral resolution between 150 and 30000 km s−15.
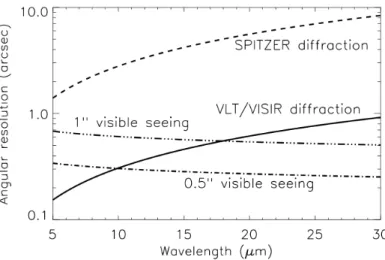
As the spatial resolution is either determined by the telescope’s mirror size (solid line in Fig.1.10following the relation 1.22λ/D) or the atmospheric seeing, one can derive the wavelength dependence of the seeing. This is done by the Roddier formula which ap- proximates the seeing by studying the spatial coherence radius of the atmosphere in the telescope beam,∝λ−0.2(see dot-dashed lines in Fig.1.10). According to the figure, for vis- ible seeing below 0.600VISIR is already providing diffraction limited images. Ideally, MIR observations are better performed with space-borne telescopes since they would be above the atmosphere and avoid its bright thermal background. However, the spatial resolution
5The description and numbers mentioned are optimized for Paranal observing site of the VLT, and taken from VISIR manual: http://www.eso.org/sci/facilities/paranal/instruments/visir/doc/
VLT-MAN-ESO-14300-3514_v89.pdf
1.3. Observations in the Infrared 15
Figure 1.10:VLT diffraction limit (solid line) versus seeing. The Roddier dependence is shown for two optical seeings (dashed-dot). Plotted for comparison is the Spitzer Space Telescope diffraction limits (dashed line). Image credit: ESO VISIR user manual.
achieved by ground-based observatories are usually higher than those by space telescopes due to the limited-size mirrors of the latter. For instance, VISIR can reach diffraction- limited resolutions of∼0.300(FWHM) in theN-band, an order of magnitude better than what is reached by theSpitzer Space Telescope (SST)(see Fig.1.10).
The two atmospheric windows,N andQbands, in the MIR can be seen in Fig.1.11.
Reading the transmission curve, one can see that theN-band window is almost entirely transparent in certain ranges, unlike theQ-band which can on average be only 60% trans- parent. Outside these two windows, the rest of the thermal radiation gets absorbed before reaching the surface by mainly H2O, CH4, CO2, CO, O2, O3 molecules. Besides absorb- ing the incoming infrared light, the atmosphere acts as a strong background emitter with a black-body curve at∼253 K. The telescope also emits thermal radiation, which for the VLT is at 283 K. For this reason, the VISIR detectors and the whole instrument are cooled to very low temperatures (few Kelvins for the detectors) to avoid internal background con- tamination.
To account for the MIR background of the sky and the telescope a method called chop- ping/nodding is implemented. It is a set of differential observations wherein the sec- ondary mirror of the telescope is moved at a rate faster than the background fluctuations between two positions on the sky. The first is on-source and measures the astronomical source in addition to the background; the second position is referred to as off-source and measures the background alone. For VISIR at Paranal, observing in theN-band requires a chopping frequency of 0.25 Hz while for theQ-band 0.5 Hz. The chopping technique
Figure 1.11:MIR atmospheric transmission at Paranal site computed for an altitude of 2600 m and 1.5 mm of precipitable water vapor at zenith. Image credit: ESO VISIR user manual.
Figure 1.12:Illustration of the chopping and nodding technique on observations of the blue compact galaxy He2-10. The galaxy only appears after chopping and nodding. Image credit: VISIR commis- sioning team, June 2004, from ESO VISIR user manual.
1.4. Dissertation Outline 17
accounts for the sky and telescope emission which is removed by subtracting the images taken at the two positions, i.e. on-source image - off-source image. However, changing the position of the secondary mirror introduces a residual background resulting from the optical path difference between the two chopper positions. This additional background is removed or mostly suppressed by nodding the whole telescope to an off-source posi- tion where again the same chopping cycle is repeated. This technique works well as this residual background varies on a time-scale longer than the sky background. After the im- ages from the two nodding positions are subtracted from each other, the resulting prod- uct can contain 3–4 images of the source depending on the settings used for the chop- ping/nodding of the telescope, see Fig.1.12for an illustration of the technique.
The reduction of mid-IR data is similar to NIR data (see previous section1.3). Besides the chopping and nodding corrections, bad or dead pixels have to be taken care of. Ac- cording to the ESO VISIR data reduction guidelines, there is usually no flat fielding done during the reduction of MIR data as the background fluctuations at mid IR wavelengths are large.
1.4 Dissertation Outline
This dissertation deals with Galactic Center data taken at two wavelengths regimes, near and mid-infrared, which I present in two corresponding chapters. Each of these chapters will have its own abstract, introduction, data and results then the discussion and conclu- sions.
Chapter 2
Here I analyze NIR 2.2µm images of the S-star cluster to study the diffuse emission surrounding the central black hole, Sgr A*. The chapter starts with a reference to the published works addressing the inner regions of the cluster in terms of stellar populations, distribution and dynamics. I then lay out the approach we follow to study the diffuse emission, and the attempt to explain it by a distribution of faint stars. The effect a dark mass of individual perturbers will have on the orbit of the star S2, around Sgr A*, is then explored. Finally, I simulate the line-of-sight cluster- ing of below-the-detection-limit stars and how they can be mistaken as new faint sources. The chapter ends with a discussion and summary of the results and their implications.
Chapter 3
This chapter lists the MIR data I use to study the faint compact sources in and around the nuclear star cluster and Quintuplet cluster. First I give an introduction to the regions and the properties that make them suitable and interesting for such an investigation. The details of the data and the reduction process are given be-
fore highlighting the main results obtained for the two regions. I then conclude the chapter with a summary and an outlook for future work.
Chapter 4
An interesting source was found while analyzing the mid-infrared mosaics of the central cluster. This source is worth further investigation for its morphology and location. The morphology resembles a bow shock caused by the interaction of a su- personic wind from a star with the surrounding medium. The location is interesting for the chance alignment of our source with other previously studied bow shocks and features that are closer to the central black hole, and were found to be caused by an external wind blowing from its direction. This chapter highlights the discus- sion of the long-sought jet/outflow from the SMBH and also the combined stellar wind of the central cluster.
Chapter 5
I conclude the dissertation by highlighting its main results and discussing their im- plications, while laying the ground for follow-up studies.
C H A P T E R
2
T HE N ATURE OF D IFFUSE NIR E MISSION IN THE
I NNER A RCSECOND
Sgr A*, the supermassive black hole at the center of the Milky Way, is surrounded by a small cluster of high velocity stars, known as the S-stars. I aim to constrain the amount and nature of stellar and dark mass associated with the cluster in the immediate vicinity of the black hole. I use near-infrared imaging to determine theKs-band luminosity func- tion of the S-star cluster members, and the distribution of the diffuse background emis- sion and the stellar number density counts around the central black hole. This allows us to determine the stellar light and mass contribution expected from the faint members of the cluster. We then use post-Newtonian N-body techniques to investigate the effect of stellar perturbations on the motion of S2, as a means of detecting the number and masses of the perturbers. I find that the stellar mass derived from theKs-band luminos- ity extrapolation is much smaller than the amount of mass that might be present consid- ering the uncertainties in the orbital motion of the star S2. Also the amount of light from the fainter S-cluster members is below the amount of residual light at the position of the S-star cluster after removing the bright cluster members. If the distribution of stars and stellar remnants is strongly enough peaked near Sgr A*, observed changes in the orbital elements of S2 can be used to constrain both their masses and numbers. Based on sim- ulations of the cluster of high velocity stars I find that at a wavelength of 2.2µm close to the confusion level for 8 m class telescopes blend stars will occur (preferentially near the position of Sgr A*) that last for typically 3 years before they dissolve due to proper motions.
19
2.1 Introduction
Using 8–10 m class telescopes, equipped with adaptive optics (AO) systems, at near- infrared (NIR) wavelengths has allowed us to identify and study the closest stars in the vicinity of the supermassive black hole (SMBH) at the center of our Milky Way. These stars, referred to as the S-star cluster, are located within the innermost arcsecond, orbit- ing the SMBH, Sagittarius A* (Sgr A*), on highly eccentric and inclined orbits. Up till now, the trajectories of about 20 stars have been precisely determined using NIR imaging and spectroscopy (Gillessenet al.,2009b,a). This orbital information is used to determine the mass of the SMBH and can in principle be used to detect relativistic effects and/or the mass distribution of the central stellar cluster (Rubilar and Eckart,2001;Zuckeret al.,2006;
Mouawadet al.,2005;Gillessenet al.,2009b).
One of the brightest members of that cluster is the star S2. It has the shortest observed orbital period of∼15.9 years, and was the star used to precisely determine the enclosed dark mass, and infer the existence of a∼4 million solar mass SMBH, in our own Galactic Center (GC;Schödelet al.,2002;Ghezet al.,2003). The first spectroscopic studies of S2, byGhezet al.(2003) and laterEisenhaueret al.(2005), revealed its rotational velocity to be that of an O8–B0 young dwarf, with a mass of 15M¯and an age of less than 106yrs. Later, Martinset al.(2008) confined the spectral type of S2 to be a B0–2.5 V main-sequence star with a zero-age main-sequence (ZAMS) mass of 19.5M¯. The fact that S2, along with most of the S-stars, is classified as typical solar neighborhood B2–9 V stars, indicates that they are young, with ages of 6–400 Myr (Eisenhaueret al.,2005). The combination of their age and the proximity to Sgr A* presents a challenge to star formation theories. It is still unclear how the S-stars were formed. Being generated locally requires that their formation must have occurred through non-standard processes, like formation in at least one gaseous disk (Löckmannet al.,2009) or via an eccentricity instability of stellar disks around SMBHs (Madiganet al.,2009). Alternatively, if they formed outside the central star cluster, about 0.3 parsec core radius (e.g.Buchholzet al.,2009;Schödelet al.,2007), there are several models that describe how they may have been brought in (e.g.Hansen and Milosavljevi´c, 2003;Kimet al.,2004;Levinet al.,2005;Fujiiet al.,2009,2010;Merrittet al.,2009;Gould and Quillen,2003;Peretset al.,2007,2009). For a detailed description of these processes seePerets and Gualandris(2010).
Stellar dynamics predict the formation of a cusp of stars at the center of a relaxed stellar cluster around a SMBH. This is manifested by an increase in the three dimensional stellar density of old stars and remnants towards the center with power-law slopes of 1.5 to 1.75 (Bahcall and Wolf,1976;Murphyet al.,1991;Lightman and Shapiro,1977;Alexander and Hopman,2009).
The steep power-law slope of 1.75 is reached in the case of a spherically symmetric single mass stellar distribution in equilibrium. For a cluster with differing mass composi-
2.1. Introduction 21
Figure2.1:Left:17.500×17.500NACOKs-bandmosaicofthecentralclusterzoomedintotheinner1–200regionaroundSgrA*.Theinnerregionis indicatedbyadashed(white)circle.Right:a)Mapofthediffusebackgroundlightwithinacircleof0.6900radiuscenteredonthepositionofSgrA*, shownhereasacrossatthecenter.TheprojectedorbitofthestarS2isover-plottedasanellipse.b)Thesamemapsmoothedbyconvolutionwitha GaussianbeamofFWHM=6pixels.Thecontourslevelsareat95%,90%,80%,70%,60%,50%,40%,30%,20%and10%ofthemaximumfluxvaluefor eachimage.
tion, mass segregation sets in, where the more massive stars sink towards the center, while the less massive ones remain less concentrated. This leads to the shallow density distri- bution of 1.5 (Bahcall and Wolf,1977). Later numerical simulations and analytical models confirmed these results (Freitaget al.,2006;Preto and Amaro-Seoane,2010;Hopman and Alexander,2006b). These steep density distributions were expected for the central cluster considering its age, which is comparable to the estimates of the two-body relaxation-time of 1–20 Gyr for the central parsec (Alexander,2005;Merritt,2010;Kocsis and Tremaine, 2011). However, observations of the projected stellar number density, which can be re- lated to the three dimensional density distribution, revealed that the cluster’s radial profile can be fitted by two power-law slopes. The slope for the whole cluster outside a radius of
∼600(corresponding to 0.22 parsec) was found to be as steep as 1.8±0.1, while inside the break radius the slope was shallower than expected and reached an exponent of 1.3±0.1 (Genzelet al.,2003;Schödelet al.,2007). These findings motivated the need to derive the density profiles of the distinct stellar populations, given that recent star formation (6 Myr, Paumardet al.,2006) at the GC gave birth to a large number of high-mass young stars that would be too young to reach an equilibrium state. Using adaptive optics and intermediate- band spectrophotometryBuchholzet al.(2009) found the distribution of late-type stars (K giants and later) to be very flat and even showing a decline towards the Center (for a radius of less that 600), while the early-type stars (B2 main-sequence and earlier) follow a steeper profile. Similar results were obtained later byDoet al.(2009) andBartkoet al.(2010).
These surprising findings required new models to explain the depletion in the num- ber of late-type giants in the central few arcseconds around the SMBH. Such attempts in- volved Smooth Particle Hydrodynamics (SPH) and Monte Carlo simulations which tried to account for the under density of giants by means of collisions with other stars and stellar remnants (Daleet al.,2009;Freitag,2008). Another explanation could be the dis- turbance of the cusp of stars after experiencing a minor merger event or an in-spiraling of an intermediate-mass black hole (IMBH), which then would lead to deviations from equilibrium; hence causing a shallower power-law profile of the cusp (Baumgardtet al., 2006). Merritt(2010) explains the observations by the evolution of a parsec-scale initial core model.
Mouawadet al.(2005) presented the first efforts to determine the amount of extended mass in the vicinity of the SMBH allowing for non-Keplerian orbits. Using positional and radial velocity data of the star S2, and leaving the position of Sgr A* as a free input pa- rameter, they provide, for the first time, a rigid upper limit on the presence of a possible extended dark mass component around Sgr A*. Considering only the fraction of the cusp massMS2apothat may be within the apo-center of the S2 orbit,Mouawadet al.(2005) find MS2apo/(MSMBH+MS2apo)≤0.05 as an upper limit. This number is consistent with more recent investigations of the problem (Gillessenet al.,2009a). Due to mass segregation, a large extended mass in the immediate vicinity of Sgr A*, if present, is unlikely to be dom- inated in mass of sub-solar mass constituents. It could well be explained by a cluster of
2.1. Introduction 23
high mass-to-light ratio (M/L) stellar remnants, which may form a stable configuration.
From the observational point of view, several attempts have been made recently to tackle the missing cusp problem.Sazonovet al.(2011) proposed that the detected 100sized thermal X-ray emission close to Sgr A* (Baganoffet al.,2001,2003) can be explained by the tidal spin-ups of several thousand late-type main-sequence stars (MS). They use theChan- draX-ray data to infer an upper limit on the density of these low-mass main-sequence stars. Furthermore, usingHubbleSpace Telescope (HST) data,Yusef-Zadehet al.(2012b) derived a stellar mass profile, from the diffuse light profile in the region<100around Sgr A*, and by that they explained the diffuse light to be dominated by a cusp of faint K0 dwarfs.
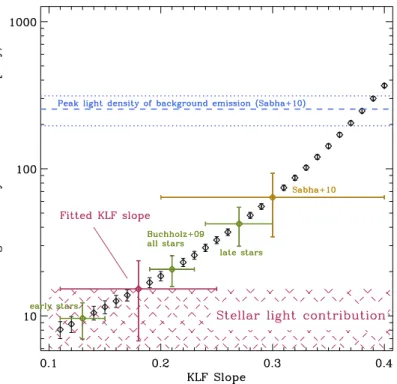
Up to now, the true distribution of the Nuclear Star Cluster, especially the S-stars, is yet to be determined. No investigations have confirmed or ruled out the existence of a cusp of relaxed stars and stellar remnants around Sgr A*, as predicted by theory. An excellent dataset to investigate the stellar content of the central arcsecond around Sgr A* is the NIR Ks-band (2.2µm) data (see Fig.2.1) used inSabhaet al.(2010), hereafter NS10. In that case I subtracted the stellar light contribution to the flux density measured at the position of Sgr A*. The aim of this work is then to analyze the resulting image of the diffuse NIR background emission close to the SMBH. This emission is believed to trace the accumula- tive light of unresolved stars (Schödelet al.,2007;Yusef-Zadehet al.,2012b). I explain the background light by extrapolating theKs-band luminosity function (KLF) of the innermost (1–200, corresponding to 0.05 parsecs for a distance of 8 kpc to the GC) members of the S- star cluster to fainterKs-magnitudes. I compare the cumulative light and mass of these fainter stars to the limits imposed by observations. We then extend our analysis to explore the possible nature of this background light by testing its effect on the observed orbit of the star S2. Furthermore, I simulate the distribution of the unresolved faint stars (Ks>18) and their combined light to produce line-of-sight clusterings that have a compact, close to stellar, appearance.
This chapter is structured as follows: Section2.2deals with a brief description of the observation and data reduction. I describe in Section2.3the method used and discuss the different observational limits employed to test our analysis. Exploring the possible contributors to the dark mass within the orbit of S2 is done in Section2.4. In Section2.5 I give the results obtained by simulating the distribution of faint stars and the possibility of producing line of sight clusterings that look like compact stellar objects. I summarize and discuss the implications of our results in Section2.6. I adopt throughout this chapter Σ(R)∝R−Γas the definition for the projected density distribution of the background light, withRbeing the projected radius andΓthe corresponding power-law index.
2.2 Observations and Data Reduction
The near-infrared (NIR) observations have been conducted at the Very Large Telescope (VLT) of the European Southern Observatory (ESO) on Paranal, Chile. The data were obtained with YEPUN, using the adaptive optics (AO) module NAOS and the NIR cam- era/spectrometer CONICA (briefly “NaCo"). The data were taken in theKs-band (2.2µm) on the night of 23 September 2004, and is one of the best available where Sgr A* is in a quiet state. Basic NIR data reduction steps have been applied (see Sect.1.3) to the individ- ual frames and then they were combined to form a mosaic of the Center (see Fig.2.1).
The flux densities were measured by aperture photometry with circular apertures of 66 mas radius. They were corrected for extinction, using AKs=2.46 derived for the in- ner arcsecond from Schödelet al.(2010). Possible uncertainties in the extinction of a few tenths of a magnitude do not influence the general results obtained in this chapter.
The flux density calibration was carried out using zero points for the corresponding cam- era setup and a comparison to knownKs-band flux densities of IRS16C, IRS16NE (from Schödelet al.,2010; alsoBlumet al.,1996) and to a number of the S-stars (Witzelet al., 2012).
2.3 The Central Few Tenths of Parsecs
In NS10 I gave a stringent upper limit on the emission from the central black hole in the presence of the surrounding S-star cluster. For that purpose, three independent methods were used to remove or strongly suppress the flux density contributions of these stars, in the central∼200, in order to measure the flux density at the position of Sgr A*. All three methods provided comparable results, and allowed a clear determination of the stellar light background at the center of the Milky Way, against which Sgr A* has to be detected.
The three methods, linear extraction of the extended flux density, automatic and iterative point spread function (PSF) subtraction were carried out assuming that the extracted PSF in the central few arcseconds of the image is uniform. Investigations of larger images (e.g.
Buchholzet al.,2009) show that on scales of a few arcseconds the constant PSF assumption is valid, while for fields≥1000the PSF variations have to be taken into account.
Figure2.2is a map of the 51 stars adopted from the list in Table 3 of NS10. The stars are plotted relative to the position of Sgr A*. The surface number density of these detected stars, within a radial distance of about 0.500from Sgr A*, is 68±8 arcsec−2, with the uncer- tainty corresponding to the square-root of that value. This value agrees with the central number density of 60±10 arcsec−2given byDoet al.(2009). Extrapolating the KLF allows us to test if the observed diffuse light across the central S-star cluster, or the amount of unaccounted dark mass, can be explained by stars.
2.3. The Central Few Tenths of Parsecs 25
Figure 2.2:Map of the 51 stars listed in Ta- ble 3 from NS10. The color of each star in- dicates its Ks-magnitude. The size of each symbol is proportional to the flux of the cor- responding star. The position of Sgr A* is in- dicated by a cross at the center.
KLF of the S-star Cluster
Figure2.3 shows the KLF histogram derived for the stars detected in the central field, (Fig.2.2). I improve the KLF derivation by choosing a fixed number of bins that allows for about 10 sources per bin while providing a sufficient number of points to allow for a clear linear fit. The Red Clump (RC)/Horizontal Branch (HB) stars, aroundKs≈14.5, are in one bin, so the RC/HB bump is visible there (Schödelet al.,2007). For estimating the uncertainty, I randomized the start of the first bin in an interval betweenKs=13.0 to 14.2 and repeated the histogram calculation 105 times. The number of sources in each bin was then determined by taking the average of all iterations and the uncertainties were subsequently derived from the standard deviation. I derive a least-square linear slope of dlog(N)/d(Ks)=α=0.18±0.07, which compares well with the KLF slope of 0.3±0.1 de- rived in NS10 and also with the KLF slope of 0.21±0.02 found for the inner field (R<600) byBuchholzet al.(2009). For the magnitudes up toKs=17.50 within the central 0.6900 radius, I detect no significant deviation from a straight power-law. This implies that the completeness is high and can be compared to the∼70% value derived for magK =17 by Schödelet al.(2007) where the authors introduced artificial stars into their NIR image and attempted re-detecting them. However, forKs=17.50 to 18.25 the stellar counts drop quickly to about 20% of the value expected from the straight power-law line; hence the lastKs-bin is excluded from the linear fit.
Maíz Apellániz and Úbeda(2005) propose an alternative way of binning when dealing with stellar luminosity and initial mass functions (IMF). Their method is based on choos- ing variable sized bins with a constant number of stars in each bin. They find that variable sized binning introduces bias-free estimations that are independent from the number of
Figure 2.3:KLF histogram of the stars de- tected in the central field, derived from the 23 September 2004 data. The dashed line indicates the linear fit of the KLF slope of α=0.18±0.07. The vertical dotted line (red) represents the current detection limit for faint Ks-magnitudes.
stars per bin. Their method is applicable to small samples of stars. I apply their method to our KLF calculation and getd(log(N)/δKs)/d(Ks)=0.12±0.09, consistent with the fixed sized binning method.
The Diffuse NIR Background
The methods I used in NS10 to correct for the flux density contribution of the stars in the central 200have revealed a faint extended emission around Sgr A* (NS10 Figures 3b, 4b and 5). I detected∼1.3 mJy (obtained by correcting the∼2 mJy we quote in NS10 for the AKs=2.46 I use here) at the center of the S-star cluster. With a radius of 100(about twice the FWHM of the S-star cluster) for the Point Spread Function (PSF) used for the subtrac- tion, we showed that a misplacement of the PSF for about only five stars, located within one FWHM of Sgr A*, would contribute significantly to the measured flux at the center.
For a median brightness of about 1.3 mJy for these stars, a 1 pixel∼13 mas positional shift of each of these stars towards Sgr A* would be required to explain all the detected
∼1.3 mJy at the center i.e. 0.26 mJy from each star. InSabhaet al.(2011) I showed that a displacement larger than a few tenths of a pixel would result in a clear and identifiable characteristic plus/minus pattern in the residual flux distribution along the shift direction.
For a maximum positional uncertainty of 1 pixel, I showed that the independent shifts of the five stars can be approximated by a single star experiencing five shifts in a random walk pattern. This resulted in calculating a total maximum contribution of 0.26 mJy from all the five stars to the center, which translates to about 20–30% of the flux density. Thus, more than two thirds of the extended emission detected towards Sgr A* could be due to faint stars, at or beyond the completeness limit reached in the KLF, and associated with the∼0.5–100diameter S-star cluster.
2.3. The Central Few Tenths of Parsecs 27
Figure 2.4: Azimuthal average of the dif- fuse background emission as derived from manual PSF subtracted 23 September 2004 image. The squares (mean flux and1σun- certainty per pixel) have been calculated in annuli of 39.8 mas (3 pixels) width. The black dashed line marks a fit to the data points with an exponential decrease of 0.14.
The diffuse background emission I detect (see Fig.2.1a) could be compared to the pro- jected distribution of starsΣ(R)∝R−Γ, withRbeing the projected radius. I found that the distribution of the azimuthally averaged residual diffuse background emission, centered on the position of Sgr A*, not to be uniform but in fact decreases gently as a function of radius (see Figure 7 in NS10) with a power-law indexΓdiffuse=0.20±0.05. In this inves- tigation I re-calculate the azimuthally averaged background light from the iterative PSF subtracted image alone. The azimuthally averaged background light is plotted as a func- tion of projected radius from Sgr A* in Fig.2.4. In this new calculation I find the power-law index to have a value ofΓdiffuse=0.14±0.07. Both results are consistent with recent investi- gations concerning the distribution of number density counts of the stellar populations in the central arcseconds, derived from imaging VLT and Keck data. For the central few arc- secondsBuchholzet al.(2009),Doet al.(2009) andBartkoet al.(2010) find aΓ∼1.5±0.2 for the young stars, but an even shallower distribution for the late-type (old) stars with Γ∼0.2±0.1. A detailed discussion concerning the different populations and their distri- bution is given inGenzelet al.(2003);Schödelet al.(2007);Buchholzet al.(2009);Doet al.
(2009) andBartkoet al.(2010).
The small value I obtain for the projected diffuse light exponentΓdiffuseand the high degree of completeness reached aroundKs=17.5, makes this data set well suited for an- alyzing the diffuse background light. Especially in investigating the role of much fainter stars, beyond the completeness limit, in the observed power-law behavior of the back- ground.