doi: 10.3389/feart.2019.00175
Edited by:
Aleksey Sadekov, The University of Western Australia, Australia
Reviewed by:
Lennart Jan De Nooijer, Royal Netherlands Institute for Sea Research (NIOZ), Netherlands Christine Barras, Université d’Angers, France Howard Spero, University of California, Davis, United States
*Correspondence:
Nicolaas Glock nglock@geomar.de
Specialty section:
This article was submitted to Biogeoscience, a section of the journal Frontiers in Earth Science
Received:29 January 2019 Accepted:19 June 2019 Published:12 July 2019
Citation:
Glock N, Liebetrau V, Vogts A and Eisenhauer A (2019) Organic Heterogeneities in Foraminiferal Calcite Traced Through the Distribution of N, S, and I Measured With NanoSIMS: A New Challenge for Element-Ratio-Based Paleoproxies? Front. Earth Sci. 7:175.
doi: 10.3389/feart.2019.00175
Organic Heterogeneities in
Foraminiferal Calcite Traced Through the Distribution of N, S, and I
Measured With NanoSIMS: A New Challenge for Element-Ratio-Based Paleoproxies?
Nicolaas Glock1* , Volker Liebetrau1, Angela Vogts2and Anton Eisenhauer1
1GEOMAR Helmholtz Centre for Ocean Research Kiel, Kiel, Germany,2Leibniz Institute for Baltic Sea Research Warnemünde, Rostock, Germany
Oceanic oxygen decline due to anthropogenic climate change is a matter of growing concern. A quantitative oxygen proxy is highly desirable in order to identify and monitor recent dynamics as well as to reconstruct pre-Anthropocene changes in amplitude and extension of oxygen depletion. Geochemical proxies like foraminiferal I/Ca ratios seem to be promising redox proxies. Nevertheless, recent studies on microanalyses of benthic foraminiferal I/Ca ratios at the Peruvian oxygen minimum zone (OMZ) measured with secondary-ion mass spectrometry (SIMS) revealed a possible association of iodine with organic accumulations within the test. Here, we present a new study on the micro- distribution of nitrogen, sulfur, and iodine within the test walls ofUvigerina striatafrom the Peruvian OMZ measured with Nano-SIMS. A quantification of the foraminiferal I/Ca ratios from our NanoSIMS study is in good agreement with quantitative results from a previous SIMS study. Additionally, we compared uncleaned specimens with specimens that have been treated with an oxidative cleaning procedure. Both nitrogen and sulfur, which are used as tracer for organic matter, show a patchy distribution within the test walls of the uncleaned specimens and a statistically significant correlation with the iodine distribution. This patchy organic-rich phase has a different geochemical signature than the pristine calcitic parts of the test and another phase that shows a banding-like structure and that is characterized by a strong sulfur enrichment. All three elements, sulfur, nitrogen, and iodine, are strongly depleted in the cleaned specimens, even within the massive parts of the test walls that lack the connection with the test pores. These results indicate that the organic parts of the test walls are located inside a microporous framework within the foraminiferal calcite. This has to be considered in the interpretation of geochemical proxies on foraminiferal calcite, especially for microanalytical methods, since the chemical signature of these organic parts likely alters some element-to-calcium ratios within the foraminiferal test.
Keywords: foraminifera, biogenic calcite, organic heterogeneities, Nano-SIMS, iodine, nitrogen, sulfur, cleaning
INTRODUCTION
Due to their unique mechanism of calcification bilamellar, rotaliid foraminifers imprint the physical and chemical signatures of the surrounding water masses into their calcitic tests (Erez, 2003). This makes fossil calcitic foraminiferal tests ideal archives for geochemical paleoreconstructions and various foraminiferal element-to-Ca ratios have extensively been used to reconstruct past environmental conditions in the oceans. A few prominent examples are the use of Mg/Ca ratios for temperature (Nürnberg et al., 1996; Rosenthal et al., 1997; Hastings et al., 1998; Lea et al., 1999;Elderfield and Ganssen, 2000;Lear et al., 2002) and boron isotopes fractionation for pH reconstructions (Spivack et al., 1993;Sanyal et al., 1995, 2001;Palmer et al., 1998;Pearson and Palmer, 2000; Palmer and Pearson, 2003; Ni et al., 2007;
Foster, 2008; Kasemann et al., 2009; Rollion-Bard and Erez, 2010;Rae et al., 2011). Due to the ongoing ocean deoxygenation (Schmidtko et al., 2017), several redox-sensitive element-to- calcium ratios in foraminiferal calcite have been brought to attention as possible paleoproxies for past redox conditions. The most prominent ones are the Mn/Ca (Munsel et al., 2010; Ní Fhlaithearta et al., 2010, 2018; Glock et al., 2012; Groeneveld and Filipsson, 2013; McKay et al., 2015; Barras et al., 2018;
Petersen et al., 2018;Guo et al., 2019) and the I/Ca ratios (Lu et al., 2010, 2016; Glock et al., 2014, 2016; Taylor et al., 2017;
Hoogakker et al., 2018).
Despite the unique biomineralization mechanism of foraminifers, paleoreconstructions using their tests as archives can be hampered by several contaminant phases. The tests of fossil foraminifers are often covered with diagenetic coatings that might overprint the original geochemical signatures within their pristine calcite (Pena et al., 2005, 2008). Nearly four decades ago, rigorous cleaning procedures have been developed to remove such metal oxide coatings by a reductive cleaning step (Boyle, 1981). Later, an additional oxidative cleaning step was developed to remove organic contaminations (Boyle and Keigwin, 1985). Over the years, cleaning techniques have been more and more optimized for standard application like the use of Mg/Ca ratios for paleotemperature reconstructions (Barker et al., 2003;Yu et al., 2007). Diagenetic contaminant phases have been identified as Mn carbonates as well as Mn- and Fe-rich oxyhydroxides using microanalyses such as laser ablation-ICP- MS (LA-ICP-MS) or electron microprobe (EMP) mapping (Pena et al., 2005, 2008). Mn/Ca and Fe/Ca ratios therefore have often been used as indicators for diagenetic overprint of the samples (Boyle, 1983;Boyle and Keigwin, 1985;Delaney, 1990;
Ohkouchi et al., 1994; Lea, 1999). A recent study also showed that distributions of elements with a high affinity to organic matter, such as I, in foraminiferal calcite, might be strongly influenced by the organic matrix of foraminiferal tests, even after extensive oxidative cleaning prior to the analyses (Glock et al., 2016). Iodine is strongly redox sensitive and the iodide (I−) to iodate (IO3−) system has a reduction potential close to O2 in seawater (Rue et al., 1997;Brewer and Peltzer, 2009).
Thus, it has been suggested that the I/Ca ratio in carbonates might be used as a paleoproxy for O2 since only IO3− seems to be incorporated into the crystal lattice (Lu et al., 2010;
Feng and Redfern, 2018). Organo-iodine, I−, and IO3− are the dominant dissolved iodine species in aquatic systems (Gong and Zhang, 2013). Organo-iodine in sediments, accompanied by organo-bromine, is used to reconstruct past primary productivity (Pedersen and Price, 1980). Organo-iodine in sediments can show a contrasting behavior to organo-bromine, though, which is explained by differences in the amount of the two halogens absorbed by seston in the euphotic zone (Price and Calvert, 1977). Nevertheless, inclusions of organics in foraminiferal tests are of particular interest for some paleoproxies. The fractionation of stable nitrogen isotopes (δ15N) in organic matter is widely used as a proxy for different processes in the nitrogen cycle, particularly for denitrification (Altabet and Francois, 1994;
Salvatteci et al., 2016). These reconstructions are sometimes hampered by the fact that early diagenesis is influencing δ15N of bulk organic matter in sediments (Ren et al., 2009, 2012).
Since the organic inclusions in fossil foraminiferal tests are better preserved than the bulk organic matter, modern studies started to measureδ15N on foraminiferal tests after preferential dissolution of the test calcite (Altabet and Francois, 1994). An alternative proxy for past N-budgets that is not influenced by diagenetic processes is the pore density of denitrifying benthic foraminifera that likely take up nitrate through their test pores (Glock et al., 2011, 2018).
In this study, we mapped the distribution of N and S as tracers for the organic heterogeneities on cross sections of Uvigerina striata specimens from the Peruvian margin using Nano- secondary-ion mass spectrometry (NanoSIMS). We compared the distributions of these elements with the I distribution to analyze if there is a correlation of I with the organic rich parts within the foraminiferal calcite. Finally, we compared the element distributions on uncleaned specimens with individuals treated with an intensive oxidative cleaning procedure, which is supposed to remove organic contaminations from the test calcite. We hypothesize that the cleaning procedure substantially influences the distribution of these elements within the tests and that there is a covariation between these elements, which are all associated with organic matter. Furthermore, the chemical signature of these organic heterogeneities might shift the element-to-calcium ratios measured in the foraminiferal test, if not cleaned properly.
MATERIALS AND METHODS Sampling Procedure
The samples that have been used for this study have already been described in detail byGlock et al. (2016). One sediment core from the Peruvian continental margin was recovered using a video- guided multiple corer in 2008 during the R.V. Meteor Cruises M77/1 (M77/1-455/MUC-21; 78◦19.230W; 11◦00.000S; 465 m).
After retrieval, the multicorer tube was transferred to a constant temperature (4◦C) laboratory immediately. Supernatant water was removed, and the core was pushed out of the multicorer tube and cut into 1-cm-thick slices. These sediment samples were transported to and stored at GEOMAR, Kiel, Germany, at a temperature of 4◦C.
Foraminiferal Studies
Sediments were sieved over a 63-µm mesh and dried as described inGlock et al. (2016). The benthic foraminiferal speciesU. striata was used for this study and picked from the>400-µm fraction of the sediment residue. We used specimens 1, 2, 4, 7, 9, and 10 from the study by Glock et al. (2016). Species from the genusUvigerinaare often found to live infaunal (Fontanier et al., 2006), although the sedimentary microhabitat at the Peruvian oxygen minimum zone (OMZ) is very compressed and most of the living foraminifera are living in the upper 3 mm of the sediment column (Mallon, 2012;Glock et al., 2013). If a proxy for oxygen depletion like foraminiferal I/Ca is studied, it is important that the foraminiferal species not only survives anoxia but also calcifies under these conditions. Several foraminiferal species are able to denitrify under oxygen depletion (Risgaard- Petersen et al., 2006;Piña-Ochoa et al., 2010;Woehle et al., 2018) and there is evidence for calcification under anoxia (Nardelli et al., 2014).U. striatais able to denitrify and foraminifera from the Peruvian OMZ prefer nitrate over oxygen as an electron acceptor (Glock et al., 2019), making it a suitable species to study paleoproxies for oxygen depletion. The specimens employed here were not stained with rose Bengal, since this dye contains a high amount of iodine (chemical equation: 4,5,6,7-tetrachloro- 20,40,50,70- tetraiodofluorescein). The individuals were collected from replicate cores that have been used for the studies by Mallon et al. (2012) and Glock et al. (2013). These studies analyzed the distribution of living benthic foraminifera in the Peruvian OMZ. We picked only pristine individuals. Since the population densities in the Peruvian OMZ can be very high (96.1 individuals/cm3at this sampling location afterGlock et al., 2013), it is very likely that the used specimens were alive during sampling.
Cleaning Protocols
Half of the picked individuals were embedded without cleaning while the other batch was undergoing the whole cleaning procedure as described below. The cleaning has been applied on whole tests of individual specimens before they have been embedded into the resin for the preparation of the cross-sections. A more detailed description of the cleaning procedure can be found inGlock et al. (2016). Complete single foraminiferal specimens were rinsed three times with ethanol in perfluoralkoxy-polymere (PFA) vials to remove adsorbed clay particles. Each rinsing step was followed by ultrasonication for 1 min. Afterwards, to remove the ethanol, the vials were rinsed twice with reverse osmosis water (ROW). An oxidative reagent was freshly mixed by adding 100µl of 30% H2O2 to 10 ml of a 0.1 M NaOH (p.a., RothTM) solution. Subsequently, 350 µl of the 0.3% H2O2/0.1 M NaOH solution was added to each vial. The vials were kept for 15 min in a 92◦C water bath to remove contaminating organic matter. This step was repeated, using 350µl of the fresh oxidative reagent. Finally, the vials were placed a further 20 s in the ultrasonic bath and rinsed twice with ROW, and the foraminiferal specimens were individually collected over a 125-µm mesh stainless steel sieve rinsed with ethanol and dried.
Preparation of Foraminiferal Cross-Sections
For this study, we used the same foraminiferal cross-sections as in the study from Glock et al. (2016). These were prepared at GEOMAR in Kiel. The foraminiferal specimens were vacuum- embedded in Araldite (TM) epoxy resin. For a complete description of the grinding and polishing procedure, we refer to the methodology in Glock et al. (2016). The final polishing step used a grain size of 1 µm. A lab internal aragonitic coral standard (Pocillopora damicornis) was embedded within the same cross-section. A homogenized powder of this coral has been analyzed for I/Ca by ICP-MS in a previous study (2.59µmol/mol;
sd = 3.2%;n= 70;Glock et al., 2014). Also, the heterogeneity of this coral has been studied before in detail (Glock et al., 2016). All specimens and the coral fragment were embedded in the same 1-inch block of Araldite and underwent the same polishing procedures. Thus, we assume embedding/polishing related changes to the samples, if any occurred, to be similar for all specimens. The cleaned specimens were bleached before the embedding and polishing procedure. Thus, there is supposed to be no systematic bias of the cleaning protocol on the topography of the cross-sections after embedding, grinding, and polishing of the samples. Supplementary Figure S1 shows secondary electron mappings before the analyses close to the measurement spots before the NanoSIMS analyses. Measurement spots for specimen 9, measurement 1 and specimen 10, measurement 1 are shown. One of the secondary electron maps is close to a SIMS measurement spot of a previous study using the Cameca IMS-1280 (Glock et al., 2016). The topography differences on the polished samples are even lower than the ones caused by the old SIMS measurement. All backscattered electron (BSE) micrographs for this study have been done on the JEOL JXA 8200 Electron Probe Microanalyzer at GEOMAR in Kiel.
NanoSIMS Analyses
The samples were coated with ca. 40 nm carbon with a Cressington carbon coater 108 carbon/A (Watford, United Kingdom). SIMS imaging was performed using a NanoSIMS 50L instrument (Cameca, Paris, France) at the Leibniz-Institute for Baltic Sea Research Warnemünde (IOW).
Areas for analysis were selected based on microscopic pictures of the CCD camera within the NanoSIMS 50L, and secondary electron maps were recorded with the NanoSIMS 50L. Inspection of these micrographs revealed a surface flatness in the sub- micrometer to micrometer range (see also section “Preparation of Foraminiferal Cross-Sections”). However, great care was taken to employ the flattest areas for the analyses to prevent any influence of topography on the results.
A 133Cs+ primary ion beam was used to erode and ionize atoms of the sample. Images of secondary electrons,
18O−, 12C14N−, 32S−, 40Ca16O−, and 127I− were recorded simultaneously using mass detectors equipped with electron multipliers (Hamamatsu). The 12C14N− and 40Ca16O− polyanions were used as tracers for 14N and 40Ca, since the ionization efficiency is too low for the mono-anions, using a 133Cs+ primary ion beam. The mass resolving power was
adjusted to be sufficient to suppress interferences at all masses allowing, e.g., the separation of 12C14N− from interfering ions such as 12C21H2−
. Prior to the analysis, sample areas of 30µm×30µm were sputtered for 10 min with 1 nA to erode the carbon, clean the surface, and reach the steady state of secondary ion formation. The primary ion beam current during the analysis was 15 pA; the scanning parameters were 512 pixels×512 pixels for areas of 20µm×20µm, with a dwell time of 250µs per pixel. For each element mapping, 105 planes were analyzed.
Data analysis was performed with the Look@NanoSIMS software (Polerecky et al., 2012). The planes were checked for inconsistencies and accumulated. Planes with obvious artifacts (stripes or black spots) were removed and not used for accumulation. The ratios of 32S−/40Ca16O−, and
127I−/40Ca16O− and12C14N−/40Ca16O− have been calculated based on the accumulated dataset using ion counts. Regions of interest (ROIs) for further analyses were defined on the accumulated dataset based on the distribution of the
32S−/40Ca16O−ratios.12C14N−/40Ca16O−,32S−/40Ca16O−, and
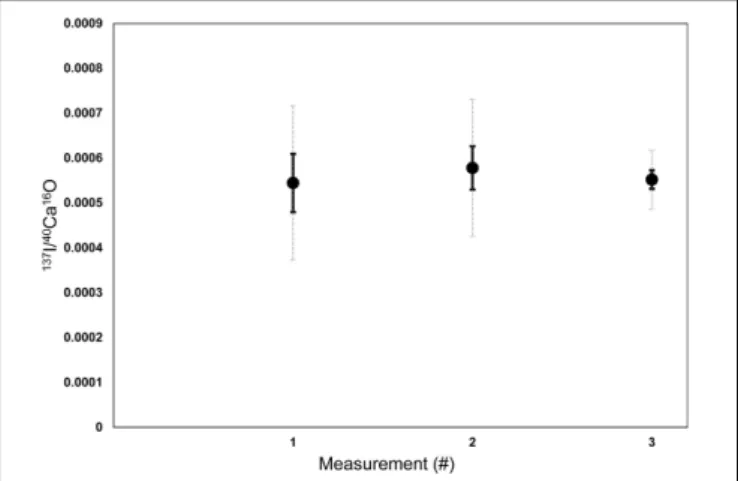
127I−/40Ca16O− ratios were calculated based on the ion counts averaged over the ROIs. Kruskal–Wallis tests have been performed between the different ROIs of each analyses to test if there are significant difference between the medians of the different element ratios or if the ROIs represent the same phases within the foraminiferal calcite. The pixel size (#) of all ROIs is shown in Supplementary Table S1. A 3σ confidence limit was used to exclude all data points with mean count rates lower than a triple of the Poisson Error. This concerned only127I−/40Ca16O− ratios and only 14 of 137 datapoints had to be discarded. The lab internal aragonitic coral standard was analyzed three times under the same settings on different days to be able to correct for instrument drift. On each of the coral mappings, 7–10 ROIs were defined with pixel sizes between 480 and 1,800 (see Supplementary Table S1) to determine mean127I−/40Ca16O− ratios for each measurement. The results indicate that the measurements were stable between the different measurement sessions (Figure 1). The 32S−/40Ca16O− and 127I−/40Ca16O− ratios were relatively homogeneously distributed on the coral standard, while the 12C14N−/40Ca16O− ratios showed some slight bandings (Supplementary Figure S2also shows the ROIs for this measurement). For further analyses, the coral was used as a matrix-matching standard to normalize foraminiferal I/Ca ratios in the same way as it has been used for a previous SIMS study (Glock et al., 2016).
RESULTS
We focused our analyses on three uncleanedU. striataspecimens (specimens 7, 9, and 10 from Glock et al., 2016) and three additional specimens, treated with an oxidative cleaning procedure to remove organic contaminants (specimens 1, 2, and 4 from Glock et al., 2016). In total, we did seven NanoSIMS element mappings on the uncleaned specimens and five analyses on the cleaned specimens. Electron micrographs of the different cross-sections and the locations of the NanoSIMS mappings are shown in Supplementary Figure S3. The distributions of
FIGURE 1 |Raw counts of (cps/cps) of127I−/40Ca16O−measured on various ROIs of three different Nano-SIMS mappings on a lab internal coral standard (P. damicornis). The three different mappings were measured on three different days to assess the stability and potential drift effect of the machine between different measurement sessions. On each of the coral mappings, 7–10 ROIs were defined with pixel sizes between 480 and 1800 to determine the mean
127I−/40Ca16O−ratios for each measurement. Error bars in black are standard errors of the mean between the different ROIs (1 SEM). Dashed error bars in light gray are standard deviations between the mean in the different ROIs (1 SD). The results indicate that there were no significant drifts between the measurement sessions, since the mean ratios are reproducible within the SEM.
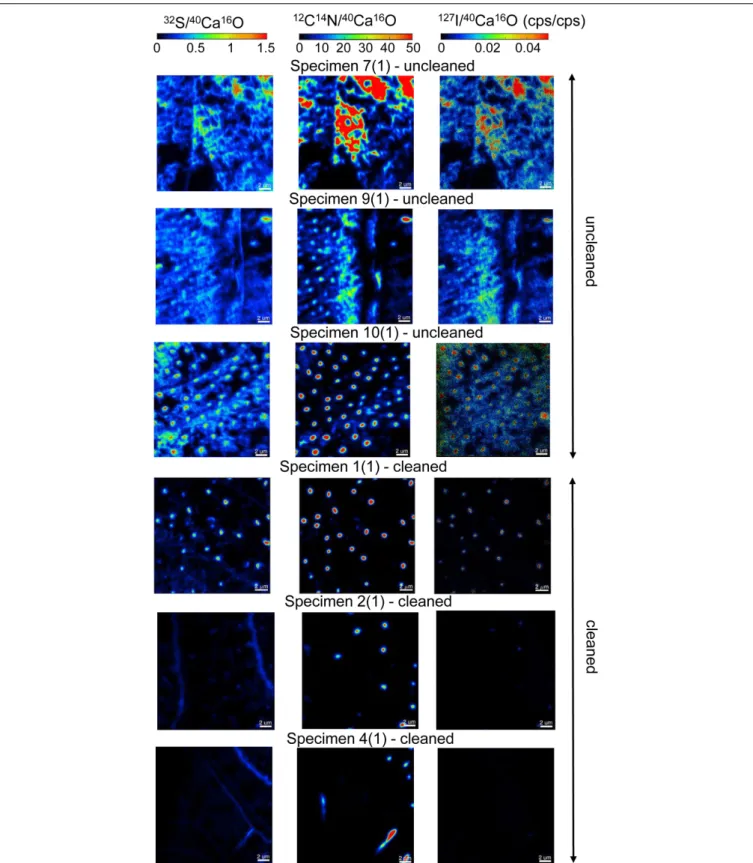
the 12C14N−/40Ca16O−, 32S−/40Ca16O−, and 127I−/40Ca16O− ratios were substantially different between the cleaned and uncleaned specimens (Figure 2). Although the specimens have been cleaned as intact specimens (“from outside”), the element distributions were strongly influenced even within the center of the test walls by the cleaning procedure. Red–Green–Blue plots of12C14N−,40Ca16O−, and32S−, respectively, point out these differences even better and reveal different distinct phases within the foraminiferal tests: low-organic calcite with low amounts of N, calcite with discrete S bandings, organic-rich calcite with high amounts of N, and test pores low in Ca (Figure 3). BSE micrographs overlain by a NanoSIMS map of the32S−/40Ca16O− distribution for a cleaned and an uncleaned specimen are shown in Figure 4. To assess the influence of topography-related artifacts on the element ratios, a comparison of the40Ca16O− and18O−distributions between two cleaned and two uncleaned specimens is shown in the supplement (Supplementary Figure S4). The40Ca16O− and18O− distributions in these mappings do not mirror the distribution of the other element ratios.
Topography artifacts can be seen at the boundary of the calcite to the resin and sometimes around the test pores. These areas have been avoided for further detailed analyses.
Distinct32S− bandings that were not that strongly enriched in 12C14N− have been found on several element mappings (Figure 3). We defined three different classes of ROIs depending on the distributions of the32S−/40Ca16O−ratios for our further analyses. Class 1 represents regions of the lowest32S−/40Ca16O− ratios, possibly free of influence from the organic heterogeneities in the tests. Class 2 represents the distinct 32S− bandings
FIGURE 2 |A comparison of six NanoSIMS mappings on cross-sections of three different uncleanedU. striataspecimens and three specimens that have been treated by an oxidative cleaning before embedding for the preparation of the cross-sections. Different isotope ratios are shown:32S−/40Ca16O−(Left),
12C14N−/40Ca16O−(Middle), and127I−/40Ca16O−(Right). The individual ion ratios use the same scaling on all element-maps for a better direct comparison of the analyses. Note the distinct differences of the element distributions between the cleaned and uncleaned specimens. The oxidative cleaning procedure affected all elements (S, N, and I) by removing parts of the organic matrix from within the foraminiferal calcite. Note that the mappings shown here were located within the foraminiferal calcite, showing no signal from the resin.
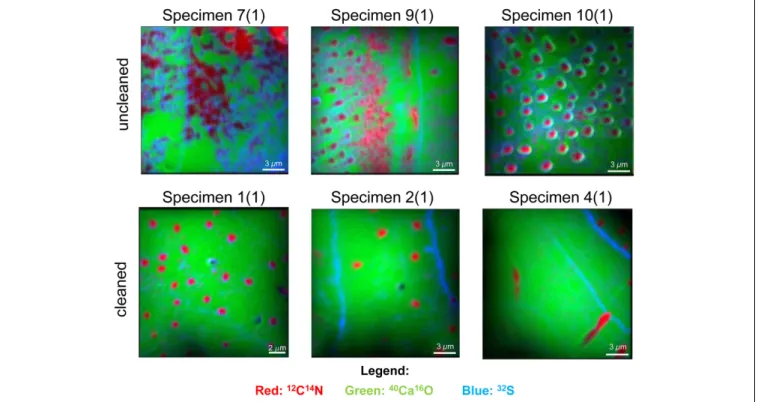
FIGURE 3 |Red–Green–Blue pictures of six NanoSIMS mappings on cross-sections of three different uncleanedU. striataspecimens and three specimens that have been treated by an oxidative cleaning before embedding for the preparation of the cross-sections. The distribution of12C14N−is indicated in red,32S−is marked in blue, and40Ca16O−is marked in green.12C14N−is a tracer for hotspots of organic matter and also enriched within the test pores of the foraminifers.
Blue bandings indicate discrete32S−bandings and likely indicate the position of the original primary organic membrane (POM). Bright green areas indicate regions of “pristine” CaCO3with low content of organic matter. Note the strong impact of cleaning on the distribution of the organic matrix within the foraminiferal calcite.
Note that the mappings shown here were located within the foraminiferal calcite, showing no signal from the resin.
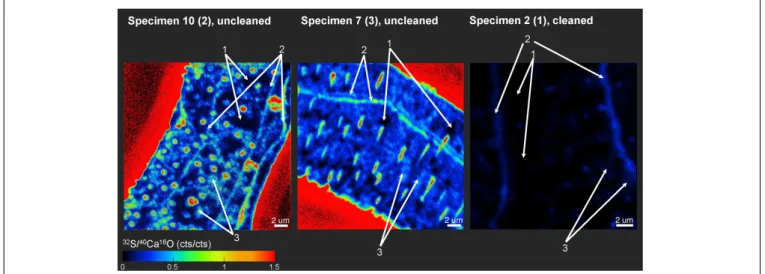
FIGURE 4 |Backscattered electron (BSE) micrographs of twoU. striataspecimens, overlain by the distribution of the32S−/40Ca16O−ratios. The figure shows a comparison of an uncleaned specimen with a specimen that has been treated by an oxidative cleaning procedure before the embedding for the preparation of the cross-sections. Both NanoSIMS mappings show parts of the epoxy resin from outside the foraminiferal calcite (signal in bright red due to the absence of Ca in the resin).
while class 3 represents the highest 32S−/40Ca16O− ratios outside these bandings that is supposed to represent organic- rich heterogeneities of the test. According to Geerken et al.
(2019), the edges of the test pores and the edges of the test walls show the strongest topography differences on foraminiferal cross-sections after measurements with NanoSIMS. Since these topography differences likely impact the ion yield during the
NanoSIMS measurements, test pores and wall edges were avoided for the definition of ROIs.Figure 5 shows a visual definition of the different classes. For the uncleaned samples, all class 1 ROIs showed32S−/40Ca16O− ratios<0.2 cps/cps and all class 3 ROIs showed ratios>0.2 cps/cps. For the cleaned samples, all class 1 ROIs showed32S−/40Ca16O− ratios<0.035 cps/cps and all class 3 ROIs showed ratios>0.035 cps/cps. A summary of all
FIGURE 5 |Example of how ROIs for Nano-SIMS analyses were defined between three different classes. ROIs were defined according to the32S−/40Ca16O− distributions. Class 1 represents regions of the lowest32S−/40Ca16O−ratios, possibly free of influence from the organic matrix in the tests. Class 2 represents the distinct32S−bandings, while class 3 represents the highest32S−/40Ca16O−ratios outside these bandings. For the uncleaned samples, all class 1 ROIs showed
32S−/40Ca16O−ratios<0.2 cps/cps and all class 3 ROIs>0.2 cps/cps. For the cleaned samples, all class 1 ROIs showed32S−/40Ca16O−
ratios<0.035 cps/cps and all class 3 ROIs>0.035 cps/cps. Class 2 ROIs were defined when obvious sulfur bandings were visible. Note that the mapping on specimen 2 (1) was completely located within the foraminiferal calcite, showing no signal from the resin. In the other two specimens, parts of the epoxy resin from outside the foraminiferal calcite were mapped (signal in bright red due to the absence of Ca in the resin).
defined ROIs and the Kruskal–Wallis tests for each analysis can be found in the supplement (Supplementary Figure S5). Within individual analyses, ROIs from different classes were in 113 of 120 cases plotting in different rankings in the Kruskal–Wallis tests, indicating that these classes have significantly different chemical signatures. Sometimes, classes 2 and 3 had overlaps in their signature. While the Kruskal–Wallis tests revealed significant differences for the 32S−/40Ca16O− ratios between the three classes, the12C14N−/40Ca16O−and127I−/40Ca16O−ratios were sometimes not distinguishable anymore between the Kruskal–
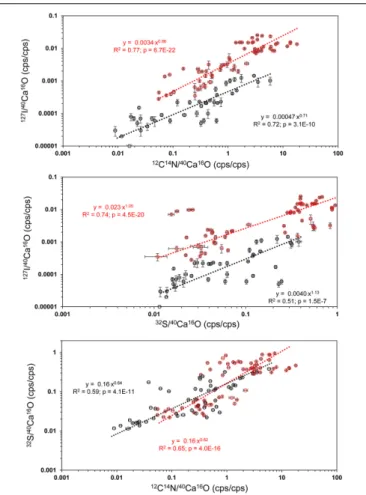
Wallis rankings. By comparing all ROIs on all individuals, we found significant power law relationships between the
12C14N−/40Ca16O− and 127I−/40Ca16O− ratios, between the
32S−/40Ca16O− and 127I−/40Ca16O− ratios, and between the
12C14N−/40Ca16O−and32S−/40Ca16O−ratios (Figure 6). Since within these relationships both variables are independent, the reduced major axis algorithm was used for the regressions reducing both the x- andy-errors (Warton et al., 2006). These regressions were performed using the PAST 3 software (Hammer et al., 2001). All power regressions were highly significant (p < 0.005). A table of all data points for all ROIs can be found in theSupplementary Table S1.Supplementary Figure S6 shows the depth profile of the element ratios through all planes for all ROIs of two different mappings. Although there were fluctuations in the element ratios within the different ROIs that likely represent heterogeneities within the depth of the sample, there was no coherent trend of the different element ratios with the depth of the sample. This indicates that the organic heterogeneities are not preferably destroyed by the ion beam.
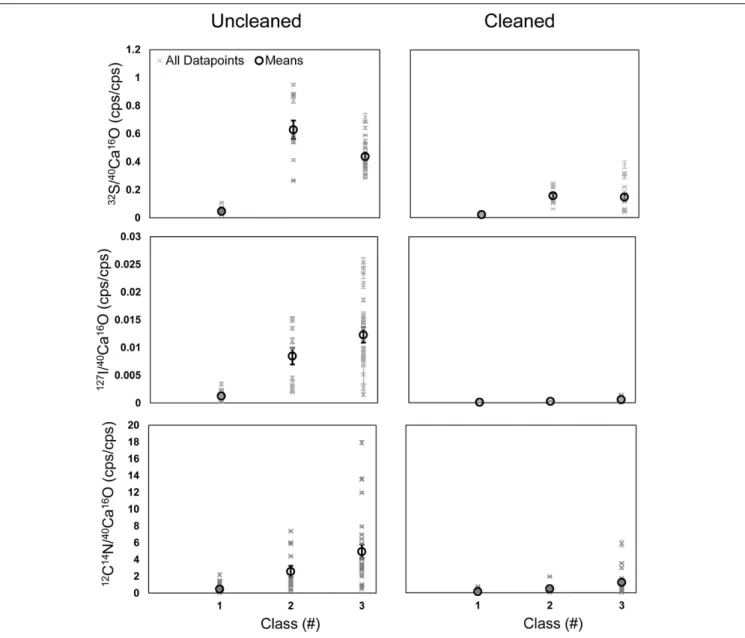
A further comparison of all data points shows that the element ratios are typically elevated in the phases of classes 2 and 3 compared to the phase of class 1 (Figure 7). These differences
were less pronounced in the cleaned specimens. Class 2 shows the highest enrichment in 32S− on the uncleaned specimens but lower 12C14N− and 127I− than class 3. In the cleaned specimens, 32S− is comparable in classes 2 and 3, which are both higher than class 1 (Figure 7). A comparison between uncleaned and cleaned specimens shows that the element ratios in all three phases are lower within the cleaned specimens (Figure 7). Student’s t-tests (two-sided, homoscedastic) were performed to compare the element ratios between the different classes and to compare the impact of cleaning on the different classes. All three element ratios were significantly lower within each class on the cleaned compared to the uncleaned specimens (p < 0.01). All element ratios in class 1 on the uncleaned specimens were significantly lower than in the other two classes (p < 0.01). While the 32S−/40Ca16O− ratios on the uncleaned specimens were significantly higher in class 2 compared to class 3 (p < 0.01), there was no significant difference between class 2 and 3 for the12C14N−/40Ca16O−and
127I−/40Ca16O− ratios (p> 0.05). On the cleaned specimens, the 32S−/40Ca16O− ratios were significantly lower in class 1 compared to classes 2 and 3 and significantly higher in class 2 compared to class 3 (p < 0.01). The 12C14N−/40Ca16O− and127I−/40Ca16O− ratios on the cleaned specimens were not significantly different between classes 1 and 2 (p > 0.05) but significantly lower in class 1 compared to class 3, indicating that the heterogeneity has not been removed quantitatively by the cleaning. Classes 2 and 3 on the cleaned specimens show a different signature for the 127I−/40Ca16O− ratios (p= 0.014) but not for the 12C14N−/40Ca16O− ratios (p = 0.07). Lateral profiles on different element maps through the S bandings (class 2) indicate that the microdistribution of the12C14N−/40Ca16O−,
32S−/40Ca16O−, and 127I−/40Ca16O− ratios is similar in both
FIGURE 6 |Power regressions between the12C14N−/40Ca16O−and
127I−/40Ca16O−ratios, between the32S−/40Ca16O−and127I−/40Ca16O− ratios, and between the12C14N−/40Ca16O−and32S−/40Ca16O−ratios from all ROIs on all Nano-SIMS element mappings made onU. striatafrom the Peruvian OMZ. All power regressions show a comparison between cleaned (black) and uncleaned specimens (red). For a summary of all ROIs, see Supplementary Material(Supplementary Figure S1). The reduced major axis (RMA) algorithm was used for the regressions reducing both thex- and y-errors (Warton et al., 2006), due to the independence of both variables.
These regressions were performed using the PAST 3 software (Hammer et al., 2001).
uncleaned and cleaned specimens, although the relative height and broadness of the peaks varies for the different elements (Supplementary Figure S7).
The offset in the 127I−/40Ca16O− ratios between cleaned and uncleaned specimens can reach a factor of 1,000 on some ROIs. The SIMS data with a coarser spatial resolution from Glock et al. (2016) found offsets between 10 and 100 times.
Finally, we quantified the I/Ca ratios using the matrix matching coral standard with known quantitative I/Ca ratio. The I/Ca ratios quantified using NanoSIMS are similar to the I/Ca ratios quantified using SIMS on the same specimens, indicating a good consistency between both approaches (Figure 8), and also to the ICP-MS data from Glock et al. (2014). The mean I/Ca ratio of all measurements on cleaned specimens was 1.4 µmol/mol while the mean I/Ca ratio on the uncleaned specimens was 32.0 µmol/mol. The differences become more
distinct when comparing the different phases (Classes 1–3). The most extreme differences in the I/Ca ratios have been found between Class 1 on the cleaned specimens (0.6±0.2µmol/mol;
1 standard error of the mean; SEM) and class 3 on the uncleaned specimens (55.4 ± 5.6 µmol/mol; 1 SEM). We have to note that the quantitative data have to be treated with care, since they are only a one-point calibration. The count ratio from the NanoSIMS may not respond linearly to differences in concentration over this range. Nevertheless, the good agreement of the NanoSIMS data of this study with the ICP-MS data from Glock et al. (2014) and the SIMS data from Glock et al. (2016) suggests that the NanoSIMS data can be used for quantitative analyses if a range of well-characterized standard materials is available. While the
127I−/40Ca16O−ratios and the32S−/40Ca16O−ratios of the coral standard show a more homogenous distribution than those of the foraminiferal samples, the 12C14N−/40Ca16O− ratios show banding-like maxima on the coral (Supplementary Figure S2).
DISCUSSION
Studies on heterogeneities and contaminations in foraminiferal calcite so far mainly focused on inorganic components.
Microanalyses with LA-ICP-MS and EMP identified some digenetic contaminant phases as Mn carbonates and as Mn- and Fe-rich (oxyhydr)oxides (Pena et al., 2005, 2008). Only recently, SIMS analyses showed that foraminiferal calcite can be interveined by a contaminant phase, rich in iodine (Glock et al., 2016). Since oxidative cleaning removed a major amount of this contamination, even within the massive center of the calcitic test walls, this phase might be associated with organics and is located within a microporous framework, allowing the cleaning reactants to intrude deeply into the calcite (Glock et al., 2016). Our new NanoSIMS results show that Iodine in tests of U. striatafrom the Peruvian OMZ indeed significantly correlates with nitrogen, a tracer for organic matter (Figure 6). Element mappings on cross-sections ofU. striataspecimens show that this nitrogen rich phase is deeply interveining the calcitic walls and that it is removed if the specimens were treated with an oxidative cleaning procedure before the preparation of the cross-sections for the NanoSIMS analyses (Figures 2, 3). The concentrations of nitrogen, sulfur, and iodine are strongly reduced within the cleaned specimens (Figure 7). Additionally, there is an offset between the iodine vs. nitrogen power regressions, depending if the specimens were cleaned or not but the correlation is still significant (Figure 6). This indicates that the oxidative cleaning removes a major amount of the organic contaminant phase but it does not remove it entirely.
Our results reveal a new challenge on geochemical paleoproxies that use foraminifera as archives. The cleaning procedures that are routinely applied for analyses of trace elements in foraminiferal calcite have been optimized over decades (fromBoyle, 1981toYu et al., 2007). Nevertheless, the protocols for the oxidative cleaning were optimized for elements, which are mainly associated with inorganic contaminant phases, especially Mg, but also Sr, Cd, or Mn (Boyle and Keigwin, 1985;
FIGURE 7 |Means (black) and all data points (black) for the12C14N−/40Ca16O−,32S−/40Ca16O−, and127I−/40Ca16O−ratios measured on all ROIs on all Nano-SIMS element mappings made onU. striatafrom the Peruvian OMZ. We compared uncleaned specimens(Left)with specimens that have been treated by an oxidative cleaning before embedding for the preparation of the cross-sections(Right). Additionally, three different phases within the foraminiferal calcite were compared (class 1–3; seeFigure 4). Class 1 represents regions of the lowest32S−/40Ca16O−ratios, possibly free of influence from the organic matrix in the tests.
Class 2 represents the distinct32S−bandings, while class 3 represents the highest32S−/40Ca16O−ratios outside these bandings that is supposed to bear the organic matrix.
Barker et al., 2003;Yu et al., 2007). There has been a systematic study on the influence of oxidative and reductive cleaning on microanalyses of Mg and Ba in planktic foraminifera using LA-ICP-MS (Vetter et al., 2013). This study showed that parts of the inner and outer surfaces of the tests are removed during the cleaning procedure, but they did not show any differences in Ba/Ca or Mg/Ca ratios within the center of the walls (Vetter et al., 2013). Both elements Mg and Ba are cations replacing the cation (Ca) in the calcite lattice and are possibly not associated with organic heterogeneities. The few studies focusing on the efficiency of oxidative cleaning on foraminiferal calcite did not focus on elements like B, Li, and I (Boyle and Keigwin, 1985;
Barker et al., 2003). This is important, since, for example, B and Li are not influenced by reductive removal of inorganic (oxyhydr)oxide coatings (Yu et al., 2007) and might possibly be associated with organic heterogeneities within the test instead.
Our study shows that I and S are certainly associated with organic matter within the foraminiferal calcite. In previous studies, the cleaning procedures for the determination of foraminiferal I/Ca use the same protocols, which have been developed and are routinely applied for the determination of foraminiferal Mg/Ca (Lu et al., 2010, 2016; Glock et al., 2014, 2016; Taylor et al., 2017;Hoogakker et al., 2018). Our NanoSIMS results show that this cleaning procedure is not sufficient, at least if it is applied
FIGURE 8 |A comparison of quantitative I/Ca ratios (µmol/mol) measured on the same six specimens ofU. striatafrom the Peruvian OMZ with NanoSIMS (this study) and SIMS (Glock et al., 2016). Specimens 1, 2, and 4 were treated with an oxidative cleaning procedure before embedding for the preparation of the cross-sections, while specimens 7, 9, and 10 are uncleaned.
to intact foraminiferal specimens without crushing them into shards before cleaning. There are traces of the organic phase visible within the cleanedU. striataspecimens (Figures 2–5,7), and even in the cleaned specimens, there is still a correlation between I and N, although there is an offset to the uncleaned specimens (Figure 6). Despite the fact that the cleaning might be more efficient if the foraminifers are broken to small shards prior to analyses, which is routinely done for wet chemical bulk analyses, there is no study, yet, showing that this contaminant phase is entirely removed. Even trace amounts of the organic phase can have a strong impact on the results, since the I/Ca content can be between 10 and 1,000 times higher in uncleaned specimens (our new results andGlock et al., 2016). Thus, it is likely that paleorecords of foraminiferal I/Ca, using the standard protocols for Mg/Ca, might be influenced not only by the redox conditions but also by factors like the preservation of organic matter in the sediments and primary productivity. Indeed, organo-iodine in sediments has been used as a paleoproxy for primary productivity (Pedersen and Price, 1980). Organo-iodine is exported to the sediments through the uptake by seston in the euphotic zone (Price and Calvert, 1977). This should be also kept in mind by using planktonic foraminifers as archives for I/Ca.
A new challenge for several upcoming paleoproxies, like I/Ca or B/Ca (and B-isotopes), will be to establish efficient adapted cleaning protocols as it has been done over decades for Mg/Ca.
It is still enigmatic how the cleaning reactants intrude deeply into the calcitic walls removing the organic phase even in parts clearly separated from the test pores (Figures 2,3). A similar observation has been found for the Fe distribution in tests of Bolivina spissa from the Peruvian OMZ (Glock et al., 2012).
Hotspots of Fe observed within the test walls of uncleaned B. spissa were absent in cleaned specimens. An early study on planktonic foraminifers revealed that an early stage natural and experimental dissolution of the tests progressively opens a puzzle- like pattern of microtubules within the test walls (Bé et al., 1975). It is likely that the organic heterogeneities we observed are interlinked within the calcitic walls and have a connection to the outside.Vetter et al. (2013)showed that oxidative cleaning can
also remove some of the pore calcite. This might explain some of the differences between our cleaned and uncleaned specimens.
Nevertheless, some areas for the NanoSIMS mapping showed only a few or even no test pores (e.g., specimens 4 and 7 on Figures 2, 3). While the uncleaned specimen 7 still shows the organic-rich heterogeneities and the cleaned specimen 4 was affected by the cleaning in the same way as the other specimens on the more porous regions of the tests, we can exclude the idea that the cleaning solution only intrudes through the test pores.
Considering the patchy distribution of organics within the calcite of U. striata, revealed by our NanoSIMS mappings, we hypothesize that this organic phase is related either to rest amounts of foraminiferal cytoplasm, provided that all specimens were alive during sampling, or to the organic matrix that is involved in the calcite precipitation of the foraminifer. The distribution of this matrix might determine the shape of the foraminiferal test. Different layers of this organic matrix have been described in detail for the planktonic foraminiferal species Orbulina universa, including the primary organic membrane (POM), inner organic layer (IOL), and outer organic layer (OOL) (Spero, 1988). The oxidative cleaning might progressively remove this matrix and opens the puzzle-like microtubule structures observed by Bé et al. (1975), allowing the reactants from our study to intrude into the calcite. Nevertheless, there are also indications that these heterogeneities do not reflect the protein fraction of the organic matrix. The heterogeneities we found are strongly enriched in S. Two fractions of organic material have been extracted from Heterostegina depressa that made a total 0.1–0.2 weight % of the total test (Weiner and Erez, 1984).
One of these fractions consists of heavily sulfated polysaccharides (glycosaminoglycans) and the other one consisted mainly of proteins. While the protein fraction contains only very little S as in aspartate, glutamate, or serine, the other fraction of the organic matrix, (i.e., the glycosaminoglycans) contains about 16 weight
% S (Weiner and Erez, 1984). It is likely that the organic-rich heterogeneities we found in the uncleaned specimens represent these heavily sulfated polysaccharides that are also found in the calcite of sea urchins and molluscs (Weiner, 1982, 1984).
A study using a coupled atom probe tomography/time of flight (TOF)-SIMS approach on planktonic foraminifera analyzed the boundary between organic and inorganic parts of the foraminiferal tests (Branson et al., 2016). The authors suggested that the composition of the cations on the organic surface may be important in defining the energetics of carbonate nucleation on organic templates, although they have previously considered passive spectator ions in biomineral templating (Branson et al., 2016). The distribution of the organic parts (Branson et al., 2016) visualized in their study strongly differ from our results on the uncleaned specimens. This is likely related to the fact that they used a similar bleaching technique before their analyses as we did on the cleaned specimens. It is also likely that the heavily sulfated polysaccharides of the organic matrix have been removed during the bleaching process in the study ofBranson et al. (2016).
Although the interpretation that the highly N- and S-enriched heterogeneities represent the glycosaminoglycans of the organic matrix, there might be an alternative explanation for the high S concentration in these parts. Benthic foraminifera from
the oxygen-depleted Santa Barbara Basin are often associated with endo- and ectobionts that are potentially H2S oxidizers (Bernhard et al., 2000; Bernhard, 2003). Since our samples are also from an anaerobic environment (i.e., the Peruvian OMZ), this might be an alternative explanation for the strong S enrichments in the uncleaned specimens. It is also possible that the patchy phase 3 represents small, organic-rich sediment particles that have been enclosed into the test calcite as it has been suggested byGlock et al. (2016).
While the organic heterogeneities might be challenging for some foraminiferal geochemical paleoproxies focusing on elements bound in the calcite lattice, they actually proved useful for paleoproxies that are directly associated with the organic parts of the test. A good example is the analysis of organic bound δ15N in fossil foraminifers (Ren et al., 2009, 2012). Sedimentary δ15N records can be a powerful tool to decipher past changes in the oceanic budget and cycling of fixed N and to estimate past processes in the N cycle, such as denitrification, N fixation, or N utilization (Altabet and Francois, 1994; Ren et al., 2009;
Salvatteci et al., 2016). Nevertheless, bacterial remineralization can alter the δ15N of bulk sedimentary organic N relative to the N exported from the surface ocean (Altabet and Francois, 1994) and also be contaminated by terrestrial input (Schubert and Calvert, 2001). Theδ15N signature in the organic-rich parts of foraminiferal tests is well preserved in fossils and less influenced by such early diagenesis or contaminations (Ren et al., 2009, 2012). For such studies, the organic inclusions are isolated by a preferential dissolution of the calcitic parts of the tests andδ15N is analyzed on the organic residue. Our NanoSIMS mappings reveal how complex the distribution of this matrix is (Figures 2,3). It is not just located around an isolated POM and possibly even composed out of different phases as indicated by the different S signatures (classes 1–3 inFigure 7). Theδ15N signature, located in the organic test parts of planktic foraminifera, is correlated to δ15N of the foraminiferal cytoplasm (Ren et al., 2012). In benthic foraminifera, δ15N of the biomass is also influenced by the food source, the availability of different food sources, and the position within the food chain (Nomaki et al., 2008;
Wukovits et al., 2018). It might thus be possible to identify past changes in food sources or benthic ecology by analyzing δ15N in the organic heterogeneities enclosed in tests of fossil benthic foraminifera.
The heterogeneities consist of two different phases with different S signatures. As described in the Section “Materials and Methods,” we distinguished between three different classes during the definition of the ROIs on the NanoSIMS mappings for further analyses (Figure 5). Class 1 is always low in S, N, and I and likely represents parts of pristine calcite with only small traces of organic matter (Figure 7). Class 2 represents discrete S bandings and the phase with the highest S concentrations (Figure 7). These bandings are still visible on the cleaned specimens (Figures 2, 3). While on the uncleaned samples all three elements show the lowest concentrations in class 1, class 2 has significantly higher S/Ca ratios than class 3 (see Figure 7).
Studies on S in foraminiferal calcite on bleached foraminifera that have been treated with a similar cleaning procedure as the specimens in our study show that the sulfur in the tests
is likely associated with sulfate replacing the carbonate ion in the calcite lattice (Paris et al., 2014; van Dijk et al., 2017).
The S bandings in bleached Amphistegina lessonii specimens are located close to the organic layers of the POM but not directly located in the organic matrix proteins (van Dijk et al., 2017). The POM is a very thin organic layer between layers of calcite when foraminifera form or add chambers to their tests (Spero, 1988; Hemleben et al., 1989). These layers are often surrounded by “bandings” in so-called “bilamellar” foraminiferal species, and these bandings are also enriched in Mg (Nürnberg, 1995;Eggins et al., 2004). A recent study showed that the Mg bandings in A. lessonii andAmmonia tepidaare also enriched in Na, K, S, P, and N but the metal bands are significantly broader than the bands for the organic tracers S, P, and N (Geerken et al., 2019). Similar bandings represent day–night cycles in planktonic foraminifera (Fehrenbacher et al., 2017).
Previous EMP analyses revealed that these bandings are also enriched in Mg in benthicUvigerinaspecies from the Peruvian OMZ (Glock et al., 2012). Fehrenbacher et al. (2017) already pointed out the fact that benthic foraminifera from below the photocline possessing such laminations is enigmatic since they are not supposed to be affected by day–night cycles. Lateral profiles through the S bandings (class 2) of the NanoSIMS mappings on different U. striata specimens indicate that the microdistribution of N, S, and I is similar (Supplementary Figure S7). Both N and I are enriched in the S bandings on cleaned and uncleaned specimens. The third class (i.e., class 3) defined in our ROIs represents a N-rich organic phase, which is not located in a distinct banding but shows a very patchy distribution. This phase has the highest contribution to the I contamination of all three classes (Figure 7). Even within the cleaned specimens, this phase is still enriched in N compared to class 1 (Figure 7). We hypothesize that class 3 represents the glycosaminoglycans of the organic matrix as found by Weiner and Erez (1984)as mentioned above. The fact that class 2 is still strongly enriched in S, even on the cleaned specimens, indicates that S is actually also bound in the crystal lattice of the primary calcite close to the POM. It is possible that the S bound in foraminiferal calcite can be used to study past S cycling, if proper cleaning procedures are developed to remove the contaminations by organic heterogeneities. Previous studies already pointed out that the inorganic S within foraminiferal tests can be used as proxy for sulfate concentrations or pCO2 (Paris et al., 2014;
van Dijk et al., 2017).
CONCLUSION
We identified patchy organic heterogeneities phase, enriched in N, S, and I in cross-sections of the calcitic test walls of the benthic foraminifer U. striata from the Peruvian OMZ using element mapping with NanoSIMS. This phase was partly removed on specimens that have been treated by oxidative cleaning before embedding for the preparation of the cross-sections. Since the I/Ca ratio in this phase can be 10 to 1,000 times higher than in pristine cleaned parts of the calcite, this might challenge the foraminiferal I/Ca-based redox proxy as well as other
foraminiferal geochemical proxies based on elements with a high affinity to organics. Our study further reveals that the cleaning reactants intrude deeply into the calcitic walls and remove the organic matrix even in parts clearly separated from the test pores.
This matrix likely interveins the calcitic walls and is certainly connected to the outside, allowing the cleaning reactants to progressively remove the microtubular matrix framework from the outside. This patchy organic-rich phase shows a different chemical signature than the typical bandings of organically enriched calcite within bilamellar foraminiferal species that represent the POM.
AUTHOR CONTRIBUTIONS
NG, VL, and AE designed the research strategy. NG took and cleaned the samples, prepared the cross sections, and wrote the manuscript. AV and NG conducted the NanoSIMS measurements. All authors contributed to the discussion of data and interpretation.
FUNDING
Funding was provided by the Deutsche Forschungsgemeinschaft (DFG) through the SFB 754 “Climate–Biogeochemistry
Interactions in the Tropical Ocean.” The NanoSIMS at the Leibniz Institute for Baltic Sea Research in Warnemünde (IOW) was funded by the German Federal Ministry of Education and Research (BMBF), grant identifier 03F0626A.
ACKNOWLEDGMENTS
The scientific party on the R/V METEOR cruise M77 is acknowledged for their general support and advice in multicorer operation and sampling. The cleaning procedures were done in the clean lab of Dirk Nürnberg, where Nadine Gehre always gave support when problems occurred in this lab.
We thank Jutta Heinze for providing the lab internal coral standard. Mario Thöner is acknowledged for assistance in the electron microprobe to provide the BSE pictures of our measurement spots.
SUPPLEMENTARY MATERIAL
The Supplementary Material for this article can be found online at: https://www.frontiersin.org/articles/10.3389/feart.
2019.00175/full#supplementary-material
REFERENCES
Altabet, M. A., and Francois, R. (1994). Sedimentary nitrogen isotopic ratio as a recorder for surface ocean nitrate utilization.Glob. Biogeochem. Cycles8, 103–116. doi: 10.1029/93GB03396
Barker, S., Greaves, M., and Elderfield, H. (2003). A study of cleaning procedures used for foraminiferal Mg/Ca paleothermometry.Geochem. Geophys. Geosyst.
4:8407. doi: 10.1029/2003GC000559
Barras, C., Mouret, A., Nardelli, M. P., Metzger, E., Petersen, J., La, C., et al. (2018).
Experimental calibration of manganese incorporation in foraminiferal calcite.
Geochim. Cosmochim. Acta237, 49–64. doi: 10.1016/j.gca.2018.06.009 Bé, A., Morse, J., and Harrison, S. (1975). “Progressive dissolution and
ultrastructural breakdown of planktonic foraminifera,” in Dissolution of Deepsea Carbonates. Cushman Foundation for Foraminiferal Research Special Publication No.13, eds W. V. Sliter, A. W. H. Beì, and W. H. Berger (Washington, DC: Cushman Foundation for Foraminiferal Research), 25–55.
Bernhard, J. M. (2003). Potential symbionts in bathyal foraminifera.Science299, 861–861. doi: 10.1126/science.1077314
Bernhard, J. M., Buck, K. R., Farmer, M. A., and Bowser, S. S. (2000). The Santa Barbara Basin is a symbiosis oasis.Nature403:77. doi: 10.1038/47476 Boyle, E. A. (1981). Cadmium, zinc, copper, and barium in foraminifera tests.Earth
Planet. Sci. Lett.53, 11–35. doi: 10.1016/0012-821X(81)90022-4
Boyle, E. A. (1983). Manganese carbonate overgrowths on foraminifera tests.
Geochim. Cosmochim. Acta47, 1815–1819. doi: 10.1016/0016-7037(83)90029-7 Boyle, E. A., and Keigwin, L. D. (1985). Comparison of Atlantic and Pacific paleochemical records for the last 215,000 years: changes in deep ocean circulation and chemical inventories.Earth Planet. Sci. Lett.76, 135–150. doi:
10.1016/0012-821X(85)90154-2
Branson, O., Bonnin, E. A., Perea, D. E., Spero, H. J., Zhu, Z., Winters, M., et al. (2016). Nanometer-scale chemistry of a calcite biomineralization template: implications for skeletal composition and nucleation. Proc.
Natl. Acad. Sci. U.S.A. 113, 12934–12939. doi: 10.1073/pnas.15228 64113
Brewer, P. G., and Peltzer, E. T. (2009). OCEANS: limits to marine life.Science324, 347–348. doi: 10.1126/science.1170756
Delaney, M. L. (1990). Miocene benthic foraminiferal Cd/Ca records: South Atlantic and western equatorial Pacific.Paleoceanography5, 743–760. doi: 10.
1029/PA005i005p00743
Eggins, S. M., Sadekov, A., and De Deckker, P. (2004). Modulation and daily banding of Mg/Ca inOrbulina universatests by symbiont photosynthesis and respiration: a complication for seawater thermometry?Earth Planet. Sci. Lett.
225, 411–419. doi: 10.1016/J.EPSL.2004.06.019
Elderfield, H., and Ganssen, G. (2000). Past temperature andδ18O of surface ocean waters inferred from foraminiferal Mg/Ca ratios.Nature405, 442–445.
doi: 10.1038/35013033
Erez, J. (2003). The source of ions for biomineralization in foraminifera and their implications for paleoceanographic proxies.Rev. Mineral. Geochem.54, 115–149. doi: 10.2113/0540115
Fehrenbacher, J. S., Russell, A. D., Davis, C. V., Gagnon, A. C., Spero, H. J., Cliff, J. B., et al. (2017). Link between light-triggered Mg-banding and chamber formation in the planktic foraminiferaNeogloboquadrina dutertrei.
Nat. Commun.8:15441. doi: 10.1038/ncomms15441
Feng, X., and Redfern, S. A. T. (2018). Iodate in calcite, aragonite and vaterite CaCO3: insights from first-principles calculations and implications for the I/Ca geochemical proxy.Geochim. Cosmochim. Acta236, 351–360. doi: 10.1016/J.
GCA.2018.02.017
Fontanier, C., Mackensen, A., Jorissen, F. J., Anschutz, P., Licari, L., and Griveaud, C. (2006). Stable oxygen and carbon isotopes of live benthic foraminifera from the Bay of Biscay: microhabitat impact and seasonal variability.Mar.
Micropaleontol.58, 159–183. doi: 10.1016/J.MARMICRO.2005.09.004 Foster, G. L. (2008). Seawater pH, pCO2 and [CO2–3] variations in the Caribbean
Sea over the last 130 kyr: a boron isotope and B/Ca study of planktic foraminifera.Earth Planet. Sci. Lett.271, 254–266. doi: 10.1016/J.EPSL.2008.
04.015
Geerken, E., de Nooijer, L. J., Roepert, A., Polerecky, L., King, H. E., and Reichart, G. J. (2019). Element banding and organic linings within chamber walls of two benthic foraminifera.Sci. Rep.9:3598. /doi10.1038/s41598-019-40298-y Glock, N., Eisenhauer, A., Liebetrau, V., Wiedenbeck, M., Hensen, C., and Nehrke,
G. (2012). EMP and SIMS studies on Mn/Ca and Fe/Ca systematics in benthic foraminifera from the Peruvian OMZ: a contribution to the identification of