https://doi.org/10.5194/bg-16-1147-2019
© Author(s) 2019. This work is distributed under the Creative Commons Attribution 4.0 License.
Planktonic foraminiferal spine versus shell carbonate Na incorporation in relation to salinity
Eveline M. Mezger1, Lennart J. de Nooijer1, Jacqueline Bertlich2, Jelle Bijma3, Dirk Nürnberg2, and Gert-Jan Reichart1,4
1Department of Ocean Systems, Royal Netherlands Institute for Sea Research, and Utrecht University, Texel, the Netherlands
2GEOMAR Helmholtz Centre for Ocean Research Kiel, Wischhofstr. 1–3, 24148 Kiel, Germany
3Alfred-Wegener-Institut Helmholtz-Zentrum für Polar- und Meeresforschung, Am Handelshafen 12, 27570 Bremerhaven, Germany
4Department of Earth Sciences, Faculty of Geosciences, Utrecht University, Heidelberglaan 2, 3584 CS Utrecht, the Netherlands
Correspondence:Eveline M. Mezger (eveline.mezger@nioz.nl) Received: 21 October 2018 – Discussion started: 25 October 2018
Revised: 20 February 2019 – Accepted: 4 March 2019 – Published: 20 March 2019
Abstract. Sea surface salinity is one of the most impor- tant parameters to reconstruct in paleoclimatology, reflect- ing amongst other things the hydrological cycle, paleoden- sity, ice volume, and regional and global circulation of wa- ter masses. Recent culture studies and a Red Sea field study revealed a significant positive relation between salinity and Na incorporation within benthic and planktonic foraminiferal shells. However, these studies reported varying partitioning of Na between and within the same species. The latter could be associated with ontogenetic variations, most likely spine loss. Varying Na concentrations were observed in different parts of foraminiferal shells, with spines and regions close to the primary organic sheet being especially enriched in Na. In this study, we unravel the Na composition of differ- ent components of the planktonic foraminiferal shell wall using electron probe micro-analysis (EPMA) and solution ICP-MS. A model is presented to interpret EPMA data for spines and spine bases to quantitatively assess differences in composition and contribution to whole-shell Na/Ca signals.
The same model can also be applied to other spatial inho- mogeneities observed in foraminiferal shell chemistry, like elemental (e.g., Mg, Na, S) banding and/or hotspots. The rel- ative contribution of shell carbonate, organic linings, spines and spine bases to whole-shell Na chemistry is considered quantitatively. This study shows that whereas the high Na areas may be susceptible to taphonomic alterations, the Na
chemistry of the shell itself seems relatively robust. Compar- ing both shell and spine Na/Ca values with salinity shows that shell chemistry records salinity, albeit with a very mod- est slope.
1 Introduction
Salinity is one of the most popular parameters to reconstruct in paleoceanography, driving, together with temperature, the thermohaline circulation and reflecting regional hydrologi- cal cycling. Whereas temperature can be reconstructed by a variety of proxies (e.g.,U37k0: Prahl and Wakeham, 1987;
foraminiferal Mg/Ca: Elderfield and Ganssen, 2000; Lea et al., 1999; Nürnberg et al., 1996; foraminiferalδ18O: e.g., Za- chos et al., 2001; Elderfield and Ganssen, 2000 and TEX86: Schouten et al., 2002), equally reliable proxies for salinity are still under development (Wit et al., 2013; Mezger et al., 2016;
Allen et al., 2016; Rohling and Bigg, 1998; Schouten et al., 2006). A number of approaches have been proposed to re- construct salinity, including a combination of stable isotopes (δ18O from foraminiferal shells orδD of long-chain ketones) with independent reconstructions of sea surface temperature (e.g., Mg/Ca orU37k0, Elderfield and Ganssen, 2000; Schouten et al., 2006); foraminiferal Ba/Ca (Weldeab, 2007), dinoflag- ellate cyst morphology (e.g., Verleye et al., 2012; Mertens
et al., 2012), and δD of long-chain ketones and alkenones (e.g., Vasiliev et al., 2017). However, uncertainties associated with the indirect controls on these proxy signals or preserva- tion issues result in (large) errors in the reconstructed salinity (Rohling, 2007). This can be circumvented by a more direct approach, related to elements determining seawater salin- ity (e.g., Cl, Na). Even though Na is considered as a con- servative element in seawater, recent culture studies and a Red Sea field study reveal a significant positive relation be- tween salinity and Na incorporation within benthic (Wit et al., 2013; Geerken et al., 2018) and planktonic (Allen et al., 2016; Mezger et al., 2016; Bertlich et al., 2018) foraminiferal shells. This relation between salinity and Na incorporation, potentially related to an increase in the Na+/Ca2+activity ratio with salinity, is not only observed for foraminiferal cal- cite (Allen et al., 2016; Mezger et al., 2016; Wit et al., 2013), but also for barnacles and Atlantic oyster shells (Rucker and Valentine, 1961; Gordon et al., 1970) and inorganically pre- cipitated calcium carbonate (Kitano et al., 1975; Ishikawa and Ichikuni, 1984).
Previous studies on the incorporation of Na into bio- genic and inorganic calcite varied in reported partition coeffi- cients, despite similar conditions (White, 1978; Ishikawa and Ichikuni, 1984; Kitano et al., 1975). These differences are not only observed between inorganic and biogenic studies, but also between and within the same foraminiferal species, either growing in culture or the natural environment (Mezger et al., 2016; Allen et al., 2016; Wit et al., 2013; Bertlich et al., 2018). Recently, Mezger et al. (2018) studied the preser- vation of the Na-salinity signal of theG. ruberandT. sac- culifer species through the water column, comparing sed- imentary and water-column-collected specimens (0–500 m) of the Red Sea. It was found that Na/Ca values decrease with water depth, thereby aligning the lower Na/Ca from the sur- face sediment samples with those observed in culture stud- ies (Allen et al., 2016; Wit et al., 2013; Mezger et al., 2018;
Bertlich et al., 2018). The loss of spines, highly enriched in Na (Branson et al., 2016; Mezger et al., 2016), during settling in the water column is hypothesized to be the controlling factor of the decreasing Na/Ca values, as foraminifera shed their spines before gametogenesis (Bé, 1980). Furthermore, it has been suggested that calcite growth rate (Busenberg and Plummer, 1985), temperature (Allen et al., 2016), environ- mental differences between field and controlled growth ex- periments (Wit et al., 2013; Allen et al., 2016; Mezger et al., 2016), life stages (Mezger et al., 2018) ageing/leakage (Yoshimura et al., 2017), or organic linings (Yoshimura et al., 2017; Branson et al., 2016) affect Na incorporation. The in- homogeneous inter-shell distribution of sodium, partially due to life stage, could influence measured Na values (Geerken et al., 2018; Branson et al., 2016; Mezger et al., 2018) and po- tentially explain part of the observed differences. Similar to reports for other inter-shell element distributions (e.g., Mg:
Sadekov et al., 2005; Hathorne et al., 2009; Kunioka, 2006), Na appears to occur in bands of alternating high and low con-
centrations (Geerken et al., 2018). However, the thickness and intensity of these bands is not similar between species (Geerken et al., 2018). For the planktonic speciesGlobigeri- noides ruberandTrilobatus sacculifer, elevated concentra- tions of Na are also observed in regions where the spines meet the rest of the shell wall (Branson et al., 2016; Mezger et al., 2018), close to the primary organic sheet (POS). This may indicate that different species vary in their calcification mechanisms: i.e., spines and gametogenic (GAM) calcite in planktonic species may be precipitated by different biomin- eralization pathways and hence may have various element compositions (Steinhardt et al., 2015; Nürnberg et al., 1996;
Sadekov et al., 2005). Clearly, the internal Na distribution influences measured Na/Ca values and is hence important for the potential application of foraminiferal shell Na/Ca for salinity reconstructions. In this study, different parts of planktonic foraminiferal shells are distinguished geochem- ically to quantify the relative contribution of shell calcite, spine calcite and organic linings on the total foraminiferal Na/Ca. We use high-resolution quantitative electron probe micro-analysis (EPMA) to distinguish differences in element composition between different parts of the shell and scan- ning electron microscopy (SEM) to determine the relative contribution of spines (thickness, density) of surface water specimens. Not only field-collected surface water specimens (Mezger et al., 2016), but also culturedT. sacculifer(Bertlich et al., 2018), Red Sea water column and surface sedimentT.
sacculiferandG. ruberspecimens (Mezger et al., 2018) are measured for comparison. Furthermore, we assess the impact on the foraminiferal shell chemistry of the organic linings by isolating these linings and analyzing their Na/Ca. These data are subsequently evaluated along a (surface water) salinity gradient, considering the potential impact of taphonomic al- terations to evaluate the proxy potential of foraminiferal shell Na/Ca values.
2 Methods
Living Red Sea field-collected T. sacculifer and G. ruber specimens were collected in May 2000 during R/VPelagia cruise 64PE158 (Mezger et al., 2016). Core-top and box- core (upper 0–1 cm) specimens from similar locations were collected during different cruises as described in Siccha et al. (2009). CulturedT. sacculifer specimens were collected at 3–8 m water depth 1.6–3.2 km off the south coast of Cu- raçao and off the west coast of Barbados, after which they were grown in filtered seawater with salinities ranging from 26 to 45 (Nürnberg et al., 1996; Bijma et al., 1990; Bertlich et al., 2018). To study the relative contribution of Na in dif- ferent parts of the shell to the total Na/Ca composition, high- resolution quantitative EPMAs were performed at Utrecht University (Sect. 2.1). Spine thickness and densities (number of spines per surface area) were derived by scanning electron microscopy (Sect. 2.2). For the chemical analyses of organic
linings (Sect. 2.3), foraminifera within the size fraction of 250–355 µm for T. sacculiferand 100–355 µm forG. ruber were collected from calcareous ooze, retrieved by a gravity core at the Walvis ridge (similar to the material used for the NFHS-1, Mezger et al., 2016).
2.1 Electron probe micro-analysis (EPMA)
The Na/Ca composition of the spines and shells collected from the Red Sea water column as well as core tops were measured at a high spatial resolution using EPMA (Table 1).
Several specimens of both species were selected and embed- ded in resin (Araldite 20/20) in a vacuum chamber. Multi- net-collected specimens were isolated directly upon low tem- perature ashing for spine analysis, transferred without siev- ing to preserve the spines and embedded in resin as well (Mezger et al., 2018). After drying for at least 48 h in an oven at approximately 50◦C, the specimens embedded in resin were polished. This polishing was performed until the center of the shell was reached, as potential differences in element incorporation related to the 3-D structure of foraminiferal shells are still not well known. Upon polishing, samples were cleaned by rinsing 3 times with double de-ionized water and coated with carbon after drying. Element mapping for Na and Ca of cultured specimens ofT. sacculifer(Bertlich et al., 2018) as well as Red Sea-derived specimens ofG. ruberand T. sacculiferwas performed with an electron microprobe at Utrecht University (JEOL JXA-8530F Field Emission Elec- tron Probe Microanalyzer). Maps were generated with a fo- cused electron beam, a beam current of 10 nA and an accel- erating voltage of 7 kV. The dwell time was set at 300 ms and pixel sizes ranged between 0.2 and 0.43 µm. Counts, repre- senting current strength, were converted to elemental ratios using analyses on standard material. We used jadeite for Na, foraminiferal calcite for Ca and forsterite for Mg, assuming a linear dependency of concentration (in mass %) on the sig- nal and a constant background. Background intensities, mea- sured for the same (foraminiferal) samples with similar set- tings, were subtracted from total element intensities before converting to mass %. Single points were eliminated from further analyses when the Ca mass percentage of that spot was below 30 %. Unfortunately, this (EPMA) method did not allow for chlorine (Cl) measurements, being present in sea- water in similar concentrations as Na and therefore poten- tially also a suitable proxy for salinity, since their concentra- tions in calcite are much lower (∼40 times) than those of Na (Kitano et al., 1975).
In this article, we refer to “whole-shell” for total shell mea- surements including high Na regions such as spines (e.g., laser ablation measurements in Mezger et al., 2016), and
“shell-only” when spine (base) regions are excluded from analysis. For the elemental analyses of the foraminiferal shell, regions of the shell not containing spines (shell-only) were selected that included potential banding, but excluded Na hotspots, which were observed near spine bases (e.g.,
Figs. 1 and S1 in the Supplement). Deconvolving the “true”
maximum Na values within the mixed spine signal is chal- lenging, as the EPMA Na/Ca signal has a limited resolution.
Values hence consist of shell calcite values, as well as pixel- averaged mixed signals and the real spine signal. Because of the limited size of the spines and spine bases only a few of the analyses will capture spine carbonate, while more analy- ses capture a mixture of both spine and ontogenetic carbonate and most analyses will show ontogenetic carbonate only. In the discussion, we suggest how the limited data of the spine chemistry can still be interpreted (Sect. 4.2).
The similarity between Na/Ca EPMA measurements of the same culturedT. sacculiferspecimens performed at GE- OMAR in Kiel, grown at different salinity and temperature conditions (for standards and measurements: Bertlich et al., 2018), and Utrecht University was used to assess consis- tency of the measurements, which was between 101.8 % and 106.4 % for the line scans and between 101 % and 122 % for the maps (concentrations from Utrecht compared to Kiel).
These values are a conservative estimate, as the selection of the lines and regions to compare are never identical to previous measurements on the same shell (Fig. S2). Details for these cultured specimens can be found in Bijma et al.
(1990). Elemental analysis on JCP-1 powder (n=6) (Okai et al., 2002) was included, with similar settings as the sam- ple measurements, to assess accuracy (sample and reference) of Sr (99.3 %), Mg (106.3 %), S (103.4 %) and Na (85 %).
Although the error on the Na quantification is considerable, offsets are minor compared to the ranges studied here.
2.2 Scanning electron microscopy
Surface structures of foraminifera, including spine density, length and width, were quantified using scanning electron microscopy (Hitachi High-Tech TM3000 TableTop scanning electron microscope). However, as a consequence of sam- pling (plankton pump, sieving) and sample preparation (low temperature ashing – LTA; Mezger et al., 2016; Fallet et al., 2010), many of the spines (partially) broke off and the to- tal spine lengths could not be determined and not used for further calculations. Spine density was calculated from pic- tures of a 50 µm×50 µm square, focusing on the F-2 cham- ber (antepenultimate chamber) and, if that is not available, the final or penultimate chamber. We used the surface-water- collected specimens for two species (G. ruberandT. sac- culifer), which were measured previously for their Na/Ca composition with laser ablation laser ablation quadrupole inductively coupled plasma mass spectrometry (LA-Q-ICP- MS) (Mezger et al., 2016). Previously ablated areas were avoided, but using these exact specimens allows comparison of the previously published whole-shell data (respectively shells including spine(s) (bases)) with the here-presented spine distributions. The number of spines was determined by counting the number of pores, as these morphological fea- tures are more robust. This quantification is based on the as-
Table 1.List of characteristics of the EPMA measurements, excluding the multi-nets. The phrase “in situ” indicates that the measured chambers were not grown in culture, but formed in the natural environment 1.6–3.2 km off the south coast of Curaçao (S=∼35.9) before sampling. “PP” refers to Red Sea plankton pump samples, “CT” to Red Sea core-top samples and “exp” to experiments.
Position Species PP/CT/exp Magnification HFW (total pixel size T S picture pixel (µm) (◦C)
width in µm)
31Jan_1 G. ruber PP 2500 48 0.24 29.4 37.3
31Jan_2 G. ruber PP 2500 48 0.24 29.4 37.3
31Jan_3 T. sacculifer PP 2500 48 0.24 29.4 37.3
31Jan_4 T. sacculifer PP 2500 48 0.27 29.4 37.3
31Jan_5 T. sacculifer PP 2500 48 0.24 29.4 37.3
31Jan_6 T. sacculifer PP 2500 48 0.27 26.3 39.6
31Jan_7 G. ruber CT 2500 48 0.24 26.7 39.8
31Jan_8 T. sacculifer CT 1600 75 0.38 26.7 39.8
31Jan_9 T. sacculifer CT 2300 52 0.26 26.7 39.8
2Feb_1 G. ruber CT 1700 48 0.24 26.7 39.8
2Feb_2 G. ruber PP 2000 54 0.27 26.3 39.6
1Feb_1 T. sacculifer T-exp 1400 86 0.43 23.5 36
1Feb_2 T. sacculifer T-exp 2000 60 0.30 19.5 33
1Feb_3 T. sacculifer T-exp 2500 48 0.24 19.5 33
1Feb_4 T. sacculifer T-exp 1700 71 0.35 in situ in situ
1Feb_5 T. sacculifer T-exp 1400 86 0.34 26.5 33
2Feb_1 T. sacculifer S-exp 1700 71 0.35 in situ in situ
2Feb_2 T. sacculifer S-exp 2222 54 0.30 in situ in situ
2Feb_3 T. sacculifer S-exp 2500 48 0.24 in situ in situ
2Feb_4 T. sacculifer S-exp 2222 54 0.30 26.5 45
2Feb_5 T. sacculifer S-exp 1800 67 0.33 in situ in situ
2Feb_6 T. sacculifer S-exp 2200 55 0.27 in situ in situ
3Feb_1 G. ruber CT 1700 48 0.24 26.7 39.8
3Feb_2 G. ruber PP 2000 54 0.27 26.3 39.6
sumption that a spine is or was present at every corner of the cancellated (hexagonal) shell structure around each pore for these species (Bé, 1980). The thickness of the round spines was measured at the base of the spine. This effectively avoids potential pitfalls of the method associated with tapering of spines (Fig. 2). Foraminiferal size was measured as described by Mezger et al. (2016).
2.3 Organic linings
For isolation of organic linings, 257G. ruberspecimens and 150T. sacculiferspecimens were selected from a calcareous ooze isolated from a gravity core recovered from the Walvis ridge (similar to the material used for the NFHS-1: Mezger et al., 2016). After isolation of the specimens, samples were treated to remove organic matter on the outside of the shell with buffered 1 % hydrogen peroxide in a heated water bath at 90◦C. Thereafter, samples were crushed lightly to enable clay particle removal from the inside of the shell by ultra- sonication. The calcite shells were subsequently dissolved in a glass beaker filled with 0.1 M ultrapure weak acetic acid, leaving these overnight to dissolve. After visual inspection of the dissolution of the shells, organic linings (OLs) were isolated, centrifuged and rinsed 3 times with ultrapure water.
Weights were determined after drying the isolated linings in a laminar cabinet at room temperature. In total, 0.04 mg OL was isolated from 5.66 mgT. sacculifer shells (0.7 %), and 0.02 mg OL from 4.95 mg G. ruber (0.4 %). After drying and weighing, the isolated OL was destructed in a PTFE tube overnight in an oxidative acid mixture (0.09 mL ultra- pure HNO3and 0.01 mL ultrapure perchloric acid) in a 70◦C water bath. The sample was brought to near dryness before being transferred to a PTFE digestion tube with 0.075 mL ultrapure HNO3 and kept at 150◦C for 12 h. After cool- ing down another aliquot of 0.05 mL ultrapure perchloric acid was added and left to react at 180◦C on a thermostatic block. After the samples were inspected for total destruction the sample was diluted to 2.5 mL with ultrapure water and small amounts of ultrapure HNO3. The elemental composi- tion was subsequently measured with a Thermo Fisher Sci- entific iCAP-Q. Elements were quantified using their rele- vant isotopes (23Na,24Mg,43Ca and88Sr, respectively). Cal- ibration standards used were taken up in a similar matrix (1 mol L−1HNO3). OL quantifications were based on back- calculating original shell and OL weights.
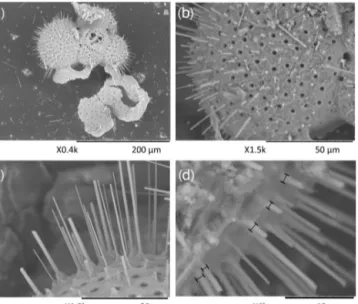
Figure 1.Example of a backscattered electron overview image of an embedded and polishedG. ruberplankton tow specimen, with the white square indicating the close-up region(a), and the Na/Ca(b)and Mg/Ca(c)EPMA images of this close-up showing the relative distribution of both elements within the shell. Whereas Na appears to be mainly concentrated in the spine (base), Mg mainly occurs in clear bands sloping upwards towards the spine and somewhat lower in the spine region (Mezger et al., 2018).
Figure 2.Example of SEM-images of the foraminiferal specimens studied here:(a)example of a laser-ablatedT. sacculiferspecimen, (b) spine count area in the F-2 chamber, (c)close-up of spines, showing the tapering shape of spines and(d)spine width measure- ments at the base of the spines.
3 Results 3.1 EPMA 3.1.1 Shell Na/Ca
Generally, Na is rather homogeneously distributed through- out the shell, although Na hotspots are observed in spines and near the spine bases (Figs. 1, S1). Banding is not ob-
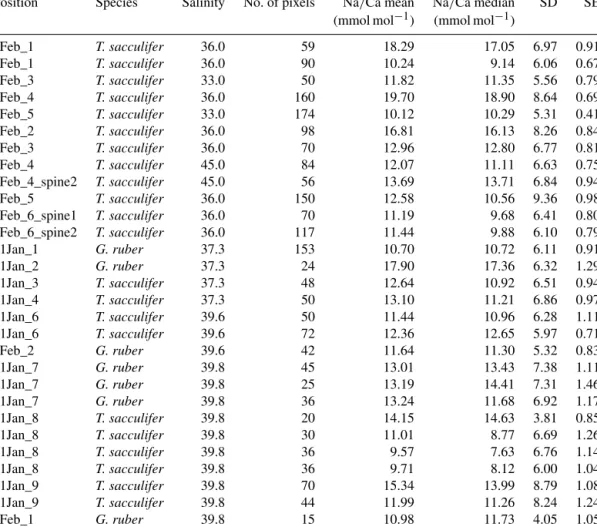
served for any of the specimens from plankton pumps, core tops or multi-nets, except for one specimen ofT. sacculifer (Supplement Sect. S3, specimen 31-4). Several areas from shell cross sections were selected in such a way to avoid ar- eas enriched in Na (“shell-only”). This basically excludes areas with spines and spine bases. Plankton pump shell- onlyG. ruberNa/Ca values range from 5.6±0.18 to 7.7± 0.25 mmol mol−1 (averages and standard errors) for a Red Sea surface water salinity of 37.3 and between 5.91±0.21 and 6.39±0.29 for a Red Sea surface water salinity of 39.6 (Table 2). For plankton pump-collectedT. sacculifer, shell- only Na/Ca values range between 6.12±0.20 and 6.83± 0.13 mmol mol−1for a Red Sea surface water salinity of 37.3 and between 6.12±0.15 and 6.75±0.31 for a Red Sea surface water salinity of 39.6 (Table 2). Shells collected from the 0 to 100 m water depth interval show Na/Ca values forT. sac- culiferranging from 5.6±0.12 to 7.1±0.10 mmol mol−1and forG. ruberbetween 5.95±0.13 and 8.42±0.18 (Table 3).
Core-top shell-only Na/Ca values range from 5.41±0.17 to 6.84±0.25 mmol mol−1forG. ruberand from 5.52±0.14 to 6.22±0.23 mmol mol−1forT. sacculifer(Table 2). All quan- titative EPMA maps for Na in the shells and spines are shown in the Supplement section.
3.1.2 Spine Na/Ca
For the multi-net-derived samples we were able to directly measure spine Na/Ca values on spines sticking out of the shell. Within the spines a considerable variability in Na/Ca values is observed, but not with a consistent zonation or trend. SpineG. ruberNa/Ca values for the multi-nets (S=∼
39.8) range from 10±1.3 to 23.5±1.9 mmol mol−1, whereas T. sacculiferNa/Ca values range from 10.7±0.8 to 24.9±
Table 2.Overview of EPMA shell measurements of different parts of the shell for core tops and plankton pumps.
Position Species PP/CT Salinity No. of pixels Na/Ca mean Na/Ca median SD SE (mmol mol−1) (mmol mol−1)
31Jan_7 G. ruber CT 39.8 1512 5.45 4.28 3.55 0.10
31Jan_7 G. ruber CT 39.8 810 5.45 5.32 3.42 0.13
31Jan_7 G. ruber CT 39.8 549 5.41 4.05 3.75 0.17
31Jan_7 G. ruber CT 39.8 630 5.76 4.48 3.70 0.16
31Jan_8 T. sacculifer CT 39.8 310 6.02 5.63 3.91 0.23
31Jan_8 T. sacculifer CT 39.8 368 6.18 5.83 3.97 0.21
31Jan_8 T. sacculifer CT 39.8 180 5.69 4.10 4.14 0.31
31Jan_8 T. sacculifer CT 39.8 405 6.22 5.91 3.98 0.23
31Jan_8 T. sacculifer CT 39.8 288 5.98 5.90 3.76 0.24
31Jan_9 T. sacculifer CT 39.8 864 5.52 4.25 3.74 0.14
31Jan_9 T. sacculifer CT 39.8 851 5.78 4.37 3.89 0.14
3Feb_1 G. ruber CT 39.8 288 6.84 6.34 4.16 0.25
3Feb_1 G. ruber CT 39.8 350 6.72 6.27 4.22 0.23
3Feb_1 G. ruber CT 39.8 774 6.36 5.96 3.95 0.15
3Feb_1 G. ruber CT 39.8 644 6.39 6.00 4.03 0.17
31Jan_1 G. ruber PP2 37.3 420 5.75 5.40 3.78 0.20
31Jan_1 G. ruber PP2 37.3 444 5.66 4.27 3.84 0.20
31Jan_1 G. ruber PP2 37.3 468 5.89 5.40 4.03 0.20
31Jan_1 G. ruber PP2 37.3 468 5.60 4.31 3.72 0.18
31Jan_1 G. ruber PP2 37.3 546 6.62 5.91 4.38 0.20
31Jan_1 G. ruber PP2 37.3 420 6.61 6.02 4.12 0.20
31Jan_2 G. ruber PP2 37.3 476 7.73 6.98 5.03 0.25
31Jan_2 G. ruber PP2 37.3 476 7.66 7.27 4.98 0.25
31Jan_3 T. sacculifer PP2 37.3 406 6.77 6.20 4.50 0.14
31Jan_3 T. sacculifer PP2 37.3 338 6.81 6.34 4.22 0.17
31Jan_3 T. sacculifer PP2 37.3 351 6.29 5.97 4.03 0.15
31Jan_3 T. sacculifer PP2 37.3 450 6.86 6.18 4.26 0.17
31Jan_3 T. sacculifer PP2 37.3 540 6.12 5.75 3.90 0.20
31Jan_4 T. sacculifer PP2 37.3 1584 6.37 5.97 4.09 0.23
31Jan_4 T. sacculifer PP2 37.3 858 6.32 5.93 3.82 0.22
31Jan_4 T. sacculifer PP2 37.3 720 6.50 5.99 4.41 0.22
31Jan_4 T. sacculifer PP2 37.3 768 6.36 5.95 4.01 0.18
31Jan_5 T. sacculifer PP2 37.3 858 6.83 6.10 4.48 0.13
31Jan_5 T. sacculifer PP2 37.3 756 6.54 5.98 4.23 0.15
31Jan_5 T. sacculifer PP2 37.3 204 6.48 5.94 4.21 0.16
31Jan_6 T. sacculifer PP7 39.6 357 6.44 5.72 4.44 0.17
31Jan_6 T. sacculifer PP7 39.6 476 6.49 5.97 4.41 0.15
31Jan_6 T. sacculifer PP7 39.6 261 6.12 5.52 4.01 0.15
31Jan_6 T. sacculifer PP7 39.6 208 6.75 6.25 4.51 0.32
3Feb_2 G. ruber PP7 39.6 1053 6.20 5.88 4.08 0.23
3Feb_2 G. ruber PP7 39.6 735 5.91 5.60 3.88 0.20
3Feb_2 G. ruber PP7 39.6 780 6.32 5.93 3.99 0.26
3Feb_2 G. ruber PP7 39.6 6952 6.39 6.05 4.07 0.29
1.9 mmol mol−1. Intra-specimen spine variability is more than 200 % for both G. ruber and T. sacculifer (highest and lowest average spine Na/Ca values, Tables 4, 5). Spine Na/Ca values are consistently much higher compared to shell Na/Ca values (e.g., Fig. 3, Tables 2–5). Comparing shell- based Na/Ca values with the Na/Ca values measured on spines for the same specimen, forT. sacculiferspines are 2 to 4.3 times higher and forG. ruberspines are 1.4 to 2.5 times
higher (Tables 2–5). No correlation is observed between spine and shell-based Na/Ca values for neither species.
For several specimens we were able to measure both spines and spine bases. The EPMAs show a clear difference in Na/Ca values between spines and spine bases. The spine bases show values in between the high spine and low shell Na/Ca values. Still, as the spine bases are surrounded by foraminiferal shell calcite, this possibly results in mixing sig-
Table 3.Overview of multi-net Na/Ca shell values. Similar superscript numbers indicate that these are measurements from the same speci- men.
Position Species No. of pixels Na/Ca mean Na/Ca median SD SE (mmol mol−1) (mmol mol−1)
0001_11 T. sacculifer 2898 7.09 6.77 4.58 0.10
0001_11 T. sacculifer 1568 6.96 6.33 4.78 0.13
0002_11 T. sacculifer 903 6.61 5.67 4.32 0.15
0002_31 T. sacculifer 1060 6.76 6.69 4.14 0.13
0002_42 T. sacculifer 2652 6.13 5.27 4.06 0.08
0002_83 T. sacculifer 609 6.08 5.17 4.25 0.17
0002_83 T. sacculifer 587 6.30 5.25 4.79 0.20
0002_11 T. sacculifer 1109 6.79 6.54 4.38 0.13
0002_124 T. sacculifer 567 5.80 5.09 4.18 0.18
0002_124 T. sacculifer 1567 5.73 4.89 4.10 0.10
0002_13 T. sacculifer 1150 5.55 4.91 3.93 0.12
0004_242 T. sacculifer 966 6.26 5.50 4.18 0.13
0004_7 G. ruber 777 8.42 7.43 5.04 0.18
0004_7 G. ruber 913 8.07 7.52 4.84 0.16
0004_125 G. ruber 1299 6.82 6.65 4.32 0.12
0004_135 G. ruber 1195 6.90 6.65 4.37 0.13
0004_146 G. ruber 1361 7.12 6.81 4.27 0.12
0004_15 G. ruber 1013 5.95 5.18 4.08 0.13
0004_16 G. ruber 2479 6.78 6.58 4.47 0.09
0004_176 G. ruber 1248 6.88 6.47 4.62 0.13
0004_186 G. ruber 1665 5.97 5.04 4.09 0.10
0004_196 G. ruber 439 6.29 5.33 4.13 0.20
0004_226 G. ruber 850 6.64 6.23 4.55 0.16
Figure 3. Comparison between spine Na/Ca values (green columns) and shell Na/Ca values (blue columns) within the same specimen (specimen 0002_13,T. sacculifer, Table 3) and EPMA- map indicating the regions represented by the histograms (white box: shell; green box: spine). The turquoise color represents the overlap region of the spine and shell histogram (not the spine base).
Clearly, spine Na/Ca values are higher compared to shell Na/Ca values.
nals between spine base and shell carbonate due to the reso- lution of the analyses, which would decrease values for the
spine base. Clearly, Na/Ca values will also depend on the selected cross section analyzed with EPMA. The distribution plots for the spine base Na/Ca values show a clear difference from the shell-only areas and generally higher values (Sup- plement Sects. S2 and S3).
3.2 SEM measurements of spine morphology and densities
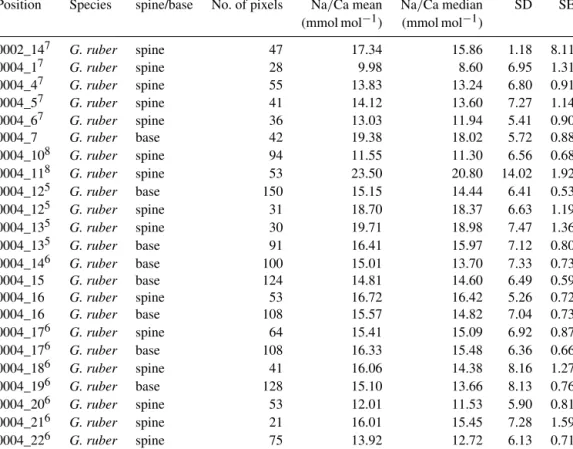
In total, 125G. ruberand 38T. sacculiferspecimens were analyzed for their spine widths and spine density at the shell surfaces. In general, the number of spines is higher for G.
ruber compared to T. sacculifer, whereas spine thickness is lower (Fig. 4). Spine density varied from 0.09 to 0.30 spines µm−2 forT. sacculiferand from 0.12 to 0.30 spines µm−2forG. ruber(Fig. 4). Spine widths show a high vari- ability between and within specimens, ranging from 0.89 to 3.96 µm forT. sacculifer and from 0.56 to 3.78 µm for G.
ruber. A weak positive correlation is observed forG. ruber andT. sacculifer between spine width and the size of the foraminiferal shell (G. ruber:R2=0.04,p <0.0001;T. sac- culifer:R2=0.04,p=0.004, based on Shapiro–Wilk test;
Fig. 4). Spine width correlates negatively with salinity, based on weighted averages of the widths per salinity group for both species (G. ruber:R2=0.35,p <0.0001;T. sacculifer:
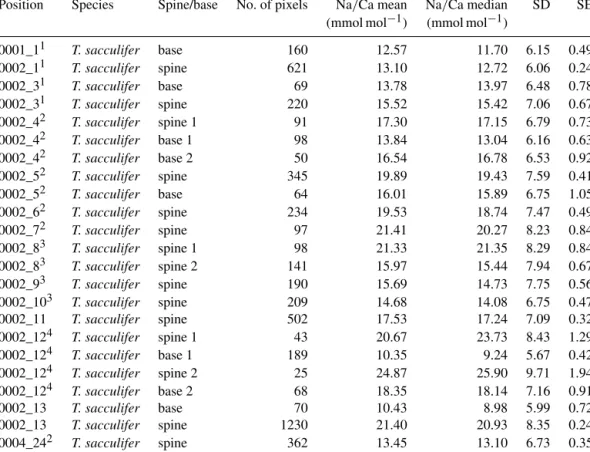
Table 4.Overview of spine and spine base Na/Ca values forT. sacculifermulti-nets. Similar superscript numbers indicate that these are measurements from the same specimen.
Position Species Spine/base No. of pixels Na/Ca mean Na/Ca median SD SE (mmol mol−1) (mmol mol−1)
0001_11 T. sacculifer base 160 12.57 11.70 6.15 0.49
0002_11 T. sacculifer spine 621 13.10 12.72 6.06 0.24
0002_31 T. sacculifer base 69 13.78 13.97 6.48 0.78
0002_31 T. sacculifer spine 220 15.52 15.42 7.06 0.67
0002_42 T. sacculifer spine 1 91 17.30 17.15 6.79 0.73
0002_42 T. sacculifer base 1 98 13.84 13.04 6.16 0.63
0002_42 T. sacculifer base 2 50 16.54 16.78 6.53 0.92
0002_52 T. sacculifer spine 345 19.89 19.43 7.59 0.41
0002_52 T. sacculifer base 64 16.01 15.89 6.75 1.05
0002_62 T. sacculifer spine 234 19.53 18.74 7.47 0.49
0002_72 T. sacculifer spine 97 21.41 20.27 8.23 0.84
0002_83 T. sacculifer spine 1 98 21.33 21.35 8.29 0.84
0002_83 T. sacculifer spine 2 141 15.97 15.44 7.94 0.67
0002_93 T. sacculifer spine 190 15.69 14.73 7.75 0.56
0002_103 T. sacculifer spine 209 14.68 14.08 6.75 0.47
0002_11 T. sacculifer spine 502 17.53 17.24 7.09 0.32
0002_124 T. sacculifer spine 1 43 20.67 23.73 8.43 1.29
0002_124 T. sacculifer base 1 189 10.35 9.24 5.67 0.42
0002_124 T. sacculifer spine 2 25 24.87 25.90 9.71 1.94
0002_124 T. sacculifer base 2 68 18.35 18.14 7.16 0.91
0002_13 T. sacculifer base 70 10.43 8.98 5.99 0.72
0002_13 T. sacculifer spine 1230 21.40 20.93 8.35 0.24
0004_242 T. sacculifer spine 362 13.45 13.10 6.73 0.35
R2=0.46,p <0.0001) (Fig. 4). Furthermore, a negative cor- relation is observed between Na/Ca values and spine width (G. ruber:R2=0.016,p=0.006;T. sacculifer:R2=0.03, p=0.006).
A significant negative correlation is observed between foraminiferal shell size and the number of spines for both species (G. ruber: R2=0.17, p <0.0001; T. sacculifer:
R2=0.38,p <0.0001; Fig. 4). Between salinity and spine density both species show a negative significant correlation (G. ruber:R2=0.24,p <0.0001;T. sacculifer:R2=0.18, p=0.006; Fig. 4). However, average spine density values for G. ruberare not statistically different for the different salinities and therefore no correlation is observed between salinity and spine density (studentttest between data points;
p >0.78 forG. ruber). ForT. sacculifer, in contrast, spine density values differ statistically significantly for the highest salinity compared to the other salinities (40.1, p <0.0375).
The lowest salinity forT. sacculifercould not be taken into account for these calculations, because it only consisted of one single data point. No significant correlation is found be- tween Na/Ca and spine density (G. ruber:R2=0.02,p= 0.1;T. sacculifer:R2=0.004,p=0.7).
3.3 Organic linings
The minor and trace elemental composition of the iso- lated organic linings is similar for T. sacculifer and G.
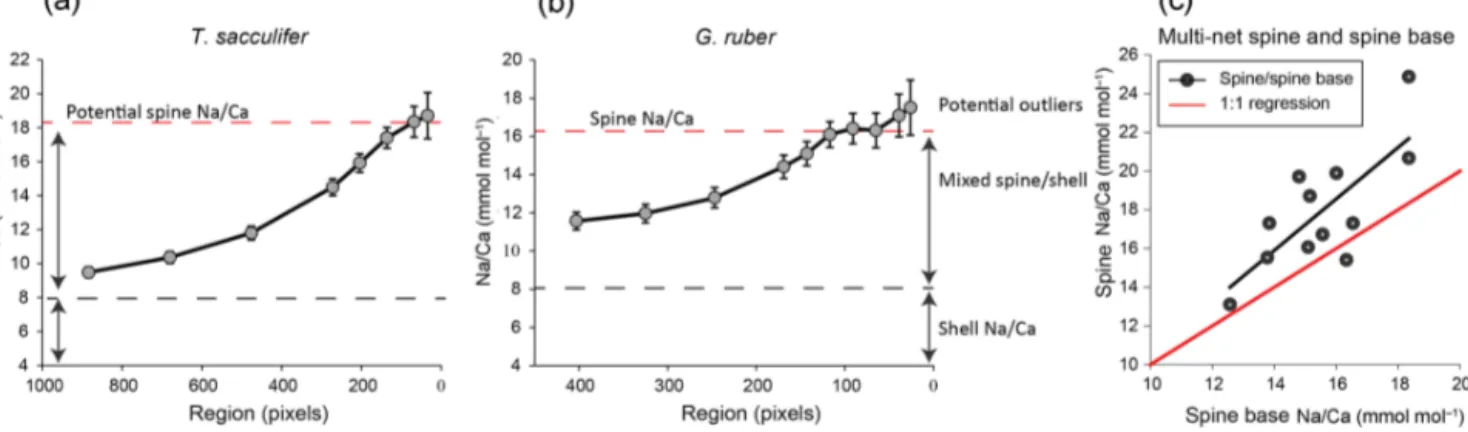
ruber (Table 7). Although concentrations of Na and Mg seem enriched within the isolated organics (Table 7), when calculating their contribution to the whole-shell elemen- tal composition, Na from the linings contributes only 5.61 ppm, or 0.024 mmol mol−1forG. ruberand 12.03 ppm, or 0.052 mmol mol−1, for T. sacculifer to the whole-shell Na/Ca. For Mg values the contributions from the iso- lated linings to the total shell concentration are 37.68 ppm, or 0.16 mmol mol−1, for G. ruber, and 69.25 ppm, or 0.28 mmol mol−1, forT. sacculifer. There is no measurable Ca concentration in the organic linings.
4 Discussion
Shell-only (i.e., spine-free) Na/Ca values ofG. ruber and T. sacculifer, collected in the Red Sea from surface waters, the water column and the sediment surface, all fall within the range of previously established calibrations (Geerken et al., 2018; Allen et al., 2016; Wit et al., 2013) (Fig. 5). Aver- age values reported here are, however, somewhat higher than
Table 5.Overview of spine and spine base Na/Ca valuesG. rubermulti-nets. Similar superscript numbers indicate that these are measure- ments from the same specimen.
Position Species spine/base No. of pixels Na/Ca mean Na/Ca median SD SE (mmol mol−1) (mmol mol−1)
0002_147 G. ruber spine 47 17.34 15.86 1.18 8.11
0004_17 G. ruber spine 28 9.98 8.60 6.95 1.31
0004_47 G. ruber spine 55 13.83 13.24 6.80 0.91
0004_57 G. ruber spine 41 14.12 13.60 7.27 1.14
0004_67 G. ruber spine 36 13.03 11.94 5.41 0.90
0004_7 G. ruber base 42 19.38 18.02 5.72 0.88
0004_108 G. ruber spine 94 11.55 11.30 6.56 0.68
0004_118 G. ruber spine 53 23.50 20.80 14.02 1.92
0004_125 G. ruber base 150 15.15 14.44 6.41 0.53
0004_125 G. ruber spine 31 18.70 18.37 6.63 1.19
0004_135 G. ruber spine 30 19.71 18.98 7.47 1.36
0004_135 G. ruber base 91 16.41 15.97 7.12 0.80
0004_146 G. ruber base 100 15.01 13.70 7.33 0.73
0004_15 G. ruber base 124 14.81 14.60 6.49 0.59
0004_16 G. ruber spine 53 16.72 16.42 5.26 0.72
0004_16 G. ruber base 108 15.57 14.82 7.04 0.73
0004_176 G. ruber spine 64 15.41 15.09 6.92 0.87
0004_176 G. ruber base 108 16.33 15.48 6.36 0.66
0004_186 G. ruber spine 41 16.06 14.38 8.16 1.27
0004_196 G. ruber base 128 15.10 13.66 8.13 0.76
0004_206 G. ruber spine 53 12.01 11.53 5.90 0.81
0004_216 G. ruber spine 21 16.01 15.45 7.28 1.59
0004_226 G. ruber spine 75 13.92 12.72 6.13 0.71
results from Bertlich et al. (2018). Red Sea sediment surface Na/Ca values measured by LA-ICP-MS and EPMA from the same specimens compare well (Mezger et al., 2018, Fig. 5).
However, for the specimens collected from the sea surface, the EPMA-derived shell-only Na/Ca values are much lower than those from the LA-ICP-MS analyses (Fig. 5). When measuring whole-shell chemistry using LA-ICP-MS, all dif- ferent shell components contribute to the signal including the Na-rich spines and spine bases. It is therefore hypothesized that spine loss is responsible for the observed offset in abso- lute Na/Ca between specimens from surface water and those from deeper in the water column (Mezger et al., 2018). The fact that the shell-only Na/Ca values between core-top and surface water specimens are similar confirms this hypothesis (Fig. 5).
Several recent studies showed foraminiferal Na/Ca values to vary with salinity (Geerken et al., 2018; Wit et al., 2013;
Allen et al., 2016; Mezger et al., 2016, 2018; Bertlich et al., 2018) (Fig. 5). The slopes of these calibrations and absolute Na/Ca values, however, differ between studies (Geerken et al., 2018; Allen et al., 2016; Wit et al., 2013; Delaney et al., 1985; Mezger et al., 2016, 2018; Bertlich et al., 2018).
Whereas some offsets may be due to inter-species differ- ences, potentially also caused by variability of morphos- pecies and genotypes (e.g., Schiebel and Hemleben, 2017;
Steinke et al., 2005), other offsets reflect variability within one species. Whereas potential differences in Na incorpora- tion between different morpho- and genotypes require further study, studies focusing on intra-shell variability in Na/Ca have shown that there are also large differences in Na/Ca within single shells (Branson et al., 2016; Geerken et al., 2018; Yoshimura et al., 2017; Mezger et al., 2018). There- fore, part of all this variability may be explained by un- even contributions of various parts of the foraminiferal shell, which means that the Na/Ca composition of these parts needs to be determined independently. This allows the calcu- lation of relative contributions of different parts of the shell to the whole-shell Na/Ca composition from previous stud- ies. Based on suggestions made before, we focus here on the contribution of organic linings, spines and spine bases to the overall Na composition of the foraminiferal shell.
4.1 Organic linings
Using TOF-SIMS and an atom probe, Branson et al. (2016) found Na concentrations to be enriched at foraminiferal spine bases and in (the proximity of) the organic linings. Values in the enriched areas appear approximately 1.3 times higher compared to the shell inOrbulina universa(Branson et al., 2016). Geerken et al. (2018) discovered that Na preferen-
Figure 4. Results from the SEM spine density and width counts forG. ruber(red closed circles) andT. sacculifer(blue open circles) specimens, with standard errors indicated and enveloped into a 95 % certainty interval, with(a)number of spines versus the size (µm) of the foraminiferal specimen these were counted on,(b)spine width (µm) versus the size (µm) of the specimen these were counted on,(c)number of spines versus salinity,(d)spine width versus salinity,(e)number of spines and the measured whole-shell Na/Ca composition and(f)spine width versus the measured whole-shell Na/Ca composition.
tially occurs in bands with concentrations 1.1–1.75 times higher compared to the surrounding layers with lower Na/Ca values. These bands seem to coincide with Mg-rich bands, which have previously been linked to the proximity of or- ganic linings (Branson et al., 2016; Geerken et al., 2018).
Although this coincidence suggests that high Na is indeed linked to the organic calcifying matrix, the values measured on the isolated linings also indicate that their relative con- tribution to the overall shell Na/Ca is negligible (Table 7).
Still, the higher concentrations of these linings might explain (part of the) observed banding pattern, as the absolute con-
centration within the linings is similar to or higher than that of the shell carbonate. One potential pitfall of the method used here for isolating the organic linings is that minor and trace metals adsorbed and/or loosely bound to the organic linings could have been removed during the rinsing phases of the isolation.
When not directly related to the organic layers, zones of high Mg and high Na may be indirectly coupled via pro- cesses responsible for the banding. For planktonic species, chamber formation (usually at night) may be responsible for the observed banding (Fehrenbacher et al., 2017; Spero et
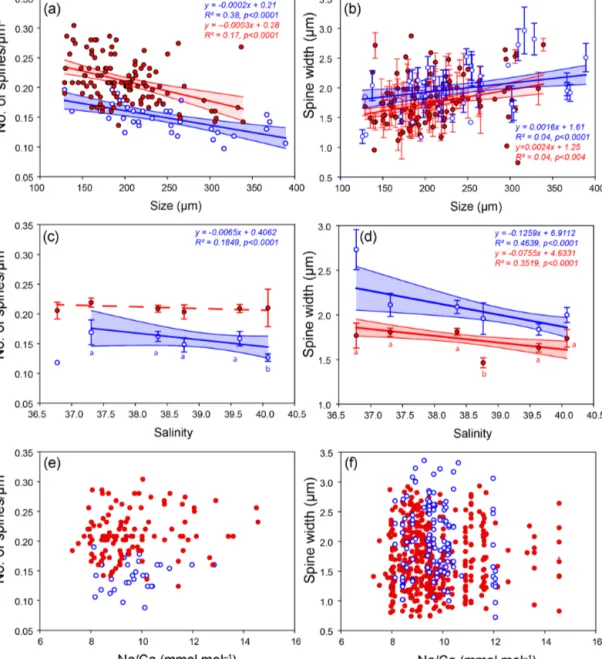
Table 6.Overview spine base measurements of cultured and field-collected specimens (Table 1).
Position Species Salinity No. of pixels Na/Ca mean Na/Ca median SD SE (mmol mol−1) (mmol mol−1)
1Feb_1 T. sacculifer 36.0 59 18.29 17.05 6.97 0.91
1Feb_1 T. sacculifer 36.0 90 10.24 9.14 6.06 0.67
1Feb_3 T. sacculifer 33.0 50 11.82 11.35 5.56 0.79
1Feb_4 T. sacculifer 36.0 160 19.70 18.90 8.64 0.69
1Feb_5 T. sacculifer 33.0 174 10.12 10.29 5.31 0.41
2Feb_2 T. sacculifer 36.0 98 16.81 16.13 8.26 0.84
2Feb_3 T. sacculifer 36.0 70 12.96 12.80 6.77 0.81
2Feb_4 T. sacculifer 45.0 84 12.07 11.11 6.63 0.75
2Feb_4_spine2 T. sacculifer 45.0 56 13.69 13.71 6.84 0.94
2Feb_5 T. sacculifer 36.0 150 12.58 10.56 9.36 0.98
2Feb_6_spine1 T. sacculifer 36.0 70 11.19 9.68 6.41 0.80
2Feb_6_spine2 T. sacculifer 36.0 117 11.44 9.88 6.10 0.79
31Jan_1 G. ruber 37.3 153 10.70 10.72 6.11 0.91
31Jan_2 G. ruber 37.3 24 17.90 17.36 6.32 1.29
31Jan_3 T. sacculifer 37.3 48 12.64 10.92 6.51 0.94
31Jan_4 T. sacculifer 37.3 50 13.10 11.21 6.86 0.97
31Jan_6 T. sacculifer 39.6 50 11.44 10.96 6.28 1.11
31Jan_6 T. sacculifer 39.6 72 12.36 12.65 5.97 0.71
3Feb_2 G. ruber 39.6 42 11.64 11.30 5.32 0.83
31Jan_7 G. ruber 39.8 45 13.01 13.43 7.38 1.11
31Jan_7 G. ruber 39.8 25 13.19 14.41 7.31 1.46
31Jan_7 G. ruber 39.8 36 13.24 11.68 6.92 1.17
31Jan_8 T. sacculifer 39.8 20 14.15 14.63 3.81 0.85
31Jan_8 T. sacculifer 39.8 30 11.01 8.77 6.69 1.26
31Jan_8 T. sacculifer 39.8 36 9.57 7.63 6.76 1.14
31Jan_8 T. sacculifer 39.8 36 9.71 8.12 6.00 1.04
31Jan_9 T. sacculifer 39.8 70 15.34 13.99 8.79 1.08
31Jan_9 T. sacculifer 39.8 44 11.99 11.26 8.24 1.24
3Feb_1 G. ruber 39.8 15 10.98 11.73 4.05 1.05
al., 2015). Here banding in Na is only reported in one EPMA image, but not conclusive in other maps (e.g., Fig. 1, Supple- ment Sect. S2, specimen 31-4). Furthermore, the visual ab- sence of organic linings in the EPMA images from this study is most likely due to the relatively low contribution (0.4 %–
0.7 %) of the organic linings for these species to the total shell weight. Potentially the expression of banding is also re- lated to the absolute Na concentrations of the shell, as band- ing in Ammonia tepida(lower in Na) was less pronounced than inAmphistegina lessonii(Geerken et al., 2018). Accord- ingly, the banding in planktonic foraminifera may also be less pronounced and hence not detectable within our approach. Ir- respective of this, the relative contribution of these bands can be considered minor in comparison with the other zones of high Na/Ca values such as the spines and spine bases, which are also clear within the limited resolution of our analytical approach.
4.2 Unraveling spines and spine base Na/Ca
Several studies showed that Na/Ca in foraminiferal shells is not homogeneously distributed but is present at higher
concentrations in bands and also at the (bases of) spine(s) (Branson et al., 2016; Mezger et al., 2018). Accordingly, Na hotspots at spines and spine bases were selected to quantify Na/Ca values and compare these values with Na/Ca mea- sured on shell-only areas. Furthermore, the preservation state of spine bases were studied, as these might still partially re- main after spine shedding processes (Bé, 1980).
Spines sticking out of the shell showed Na/Ca to be con- sistently much higher than shell Na/Ca values from the same specimens. Spine base regions were selected based on backscattered and secondary electron images (Supple- ment Sects. S1–3). Analyses from spine base areas, however, are likely influenced by mixing with lower Na/Ca values from adjacent regions. During EPMAs, the electron beam ex- cites both areas/volumes in the region close to the interface between spine base and surrounding low-Na shell calcite.
Moreover, EPMAs target a 2-D surface, whereas the spine is not necessarily oriented parallel to the sampling surface.
Hence, in three dimensions variable amounts of spine-base related carbonate is also analyzed during EPMA. Further- more, due to its conic shape, spine thickness decreases to-
Table 7.Elemental composition of organic linings calculated for shell weight and estimated elemental composition based on OL weight.
Na Mg Sr
G. ruber
ppm OL (average+SE) 1389±29 9325±34 84±0.19 average test El/Ca (mmol mol−1)∗ 6.42 4.2 1.63 Relative contribution of OL Na to total shell Na
ppm 5.61 37.68 0.34
mmol mol−1 0.024 0.16 0.0004
% 0.38 3.69 0.02
T. sacculifer
ppm OL (average+SE) 1703±11 9798±24 34±0.04 average test El/Ca (mmol mol−1)∗ 6.38 4.1 1.6 Relative contribution of OL Na to total shell Na
ppm 12.03 69.25 0.24
mmol mol−1 0.052 0.28 0.0003
% 0.82 6.95 0.02
∗Average shell Sr/Caand Mg/Cabased on Mezger et al. (2016), shell Na/Cabased on Mezger et al. (2018).
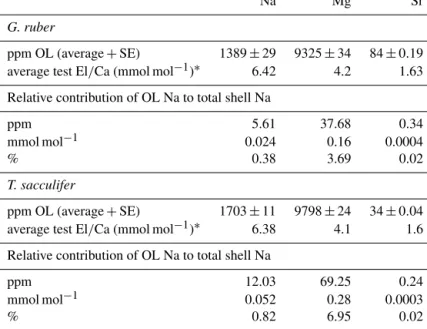
Figure 5. Comparison of most existing planktonic foraminifer Na/Ca-salinity studies, including different culture studies (Allen et al., 2016; Bertlich et al., 2018; Wit et al., 2013; Delaney et al., 1985), a field survey (Mezger et al., 2016, 2018) and a benthic cul- ture study (Geerken et al., 2018) compared to new electron micro- probe shell Na/Ca values of Red Sea plankton pumps, core tops and multi-nets (this study). Distinction had been made between EPMA and laser ablation (LA) measurements, where EPMA measurements refer to shell-only measurements. The shown regressions are asso- ciated with the data points in the same color.
wards the edges of the spine, as well as within the spine base.
The sampling volume and pixel size together determines the obtained spine and spine-base Na/Ca signal. Therefore, the
center of the spine – being the thickest and probably least affected by the polishing process – most likely reflects true spine base Na/Ca values. To estimate these signals, a mathe- matical approach was used in which we narrow the area per- pendicular to the center of the spine base for determining the Na/Ca (Figs. 6, S3). Narrowing the width of the spine base sampling area results in increasing Na/Ca values until they approach a plateau, which is assumed to reflect the true spine base Na/Ca value (Figs. 6a, b, S3). When no plateau is observed, e.g., the analyzed cross section is too small, true Na/Ca may remain unknown (Fig. 6a). Conversely, when in- creasing the width of the region used for calculating aver- age values, values converge towards the shell values signal (Fig. 6a, b). As a result of decreasing the area used for calcu- lating the average Na/Ca, standard errors increase (Fig. 6a, b).
Based on our quantification approach, spine base Na/Ca values for the water-column-collected specimens range from 12.6 to 18.4 mmol mol−1for T. sacculiferand from 15.0 to 16.1 mmol mol−1forG. ruber(Table 4–6). Part of the vari- ability in spine base Na/Ca values might be explained by differences in spine morphotypes (Schiebel and Hemleben, 2017), although by far most spines seem to have a rounded cross section. Still, more research would be needed to inves- tigate a potential effect of spine morphotype on Na incor- poration. Compared to Na/Ca values of the spines from the same specimens, spine base values are 4 % to 35 % lower (Fig. 6c). Although this offset is consistent and considerable, it cannot be excluded that it is primarily caused by the funda- mental complication of estimating Na/Ca values in the spine bases. Whereas the spine bases are surrounded by low Na/Ca
Figure 6.Examples of results of our spine-base quantification method, with(a)example of the quantification of a spine base (T. sacculifer, 2_12_multinet, Table 3),(b)similar forG. ruber, (4_13_multinet, Table 4). The smaller/narrower the selected region, the higher the Na/Ca values, resulting from confining the analysis to the core of the spine. Due to the decreasing sampling volume, standard errors also increase.
Panel(c)shows the spine Na/Ca values measured, versus the spine base Na/Ca obtained with the method described in Sect. 6, Fig. S3 and Sect. 4.2. For panel(a)the word “potential” is used, as no plateau Na/Ca value is reached.
carbonate, spines are surrounded by the embedding mate- rial only, which does not affect the analyses. For the spine bases of specimens of the Red Sea surface water, sediment surface and culturedT. sacculiferspecimens, Na/Ca values vary from 9.6 to 20 mmol mol−1, with averages being con- sistently lower compared to laser-ablation-measured spines (Mezger et al., 2018) and parts of the spines still sticking out after embedding, measured here with EPMA (Fig. 6c, Ta- ble 6).
The relatively high concentration of Na in spines and spine bases may be attributed to relatively fast growth rates com- pared to shell carbonate. Inorganic precipitation experiments suggest that growth rate enhances incorporation of most mi- nor and trace metals, including Na (Busenberg and Plum- mer, 1985). Moreover, analogous to spine formation in sea urchins, an amorphous precursor may be responsible for the prismatic shape of the foraminiferal spines, which rapidly transforms into calcite (Beniash et al., 1997). Such a pre- cursor phase has also been shown by Jacob et al. (2017) to occur during foraminiferal shell calcification, with forma- tion of vaterite. They also suggest that an amorphous precur- sor may have been present in two planktonic foraminiferal species (Jacob et al., 2017). Such an amorphous calcium car- bonate likely contains much more minor and trace elements, although a subsequent phase transformation from amorphous calcium carbonate (ACC) to calcite (potentially via vaterite) would still affect element incorporation (Littlewood et al., 2017). Interestingly, this would not only influence Na incor- poration, but also most other minor and trace metals. Appli- cation of foraminiferal trace metals for proxy reconstructions should, therefore, also address the potential effect of differ- ences in spine chemistry.
Foraminiferal shell, spine (base) and organic linings dif- fer in Na composition, potentially due to leakage (Yoshimura et al., 2017), banding (Branson et al., 2016; Geerken et al.,
2018), diffusion or adhesion and may vary as a function of salinity (Allen et al., 2016; Geerken et al., 2018; Mezger et al. 2016, 2018; Wit et al., 2013) or calcium concentration of the seawater (Hauzer et al., 2018) (Fig. 7). The consis- tently lower Na concentration of the spine base compared to the actual spines suggests a gradual transition from low- Na/Ca of the shell calcite to the high Na/Ca of the spine (Figs. 6c, 7). Although our approach does not allow an an- alytical bias to be fully excluded, alternatively leakage or diffusion of Na from the high-Na spine base to the low-Na shell through time (Yoshimura et al., 2017) could also ex- plain (part of) the observed intermediate values (Fig. 7). The spine would not be affected, or could even have higher Na concentrations, as Na diffusion from seawater into the spine after or during spine formation could increase the Na content of the spine. This would increase the observed gradient of the shell and spine base to the spine concentration but not in- fluence the average whole-shell Na composition. Using syn- chrotron X-ray spectroscopy, Yoshimura et al. (2017) found that Na incorporation is associated with substitution for Ca in the calcite lattice. This is in contrast to what was pro- posed earlier, by Ishikawa and Ichikuni (1984) for example, and with the charge difference between Na+and Ca2+being compensated by the creation of CO2−3 vacancies (Yoshimura et al., 2017). These vacancies in the crystal lattice result in weaker calcite lattice spots at the locations of Na incorpora- tion, facilitating leaching of Na from the calcite crystal on geological timescales (Yoshimura et al., 2017). However, in this study the Na/Ca composition of the foraminiferal shells (shell-only) of the same species (Red Sea water column and core tops, as well as cultured specimens) were found here to remain similar (Fig. 5), implying no appreciable Na ex- change on these relatively short timescales (thousands of years). Still, it is not clear whether the spines, with relatively
Figure 7.Potential processes influencing the Na/Ca composition of the shell, spines and organic linings. Na from spines may be transported to the surrounding seawater or into the adjacent calcite with a relatively low Na/Ca. The latter may be difficult to distinguish from mixing of material from the spine and that of the low-Na/Ca calcite.
high Na concentrations and hence weak calcite lattice spots and a large surface-to-volume ratio, have been affected.
4.3 Consequences of differences in spine and shell chemistry
The differences in Na/Ca between spine, spine base and shell-only carbonate can potentially explain differences ob- served between calibrations (Mezger et al., 2018; Fig. 5).
Differences between calibrations are observed in absolute Na/Ca concentrations and also between the slopes as a func- tion of salinity (Mezger et al., 2016, 2018; Bertlich et al., 2018; Allen et al., 2016). When spines fully account for the observed difference in both slopes and absolute Na/Ca val- ues between, for example, the cultured T. sacculifer, mea- sured shell-only with EPMA (Bertlich et al., 2018), and
planktonic foraminifera with spines (Fig. 5, Mezger et al., 2018), this implies that either Na/Caspinesmust increase with increasing salinities and/or the relative contribution of spine carbonate to the integrated whole test signal must increase with increasing salinity (Fig. 8). In the case of the latter ex- planation this could be due to relative changes in spine den- sity, thickness and/or length compared to the thickness of the shell wall (Fig. 8).
Average Na/Ca calcite compositions of whole foraminiferal specimens reflect the relative contribu- tions of Na/Ca in shell calcite (ρ) plus the contribution of Na/Ca in spine calcite (1−ρ) (Fig. 8). To determine the contribution of spines to the total Na/Cacalcite(whole-shell Na/Ca) (Fig. 6), chamber-specific LA-ICP-Q-MS Na/Ca values from Red Sea surface-water-collected T. sacculifer
Figure 8.General mass balance model combining the relative contribution (ρ) of spine (Na/Caspine) and shell calcite (Na/Cashell) Na/Ca values to explain the whole-shell (Na/Cacalcite) Na/Ca values measured. The relative contribution of shell calcite depends on the shell thickness relative to the number of spines, whereas the relative contribution of spines depends on spine density, thickness and length. The Na composition of the individual shell parts was measured with EPMA, and the total shell Na/Ca values are derived from laser ablation measurements on specimens still containing shell and spines (Mezger et al., 2019). Spines could be up to 2–3 mm long and are therefore not shown in their true scale in this image.
andG. ruberspecimens (Mezger et al., 2016) are compared to the Na/Ca composition of shell-only EPMA-measured cultured T. sacculifer (Bertlich et al., 2018). Because the spines of surface-dwelling foraminifera are still largely intact, the difference in absolute values and the slope between these calibrations allows the calculation of the relative contribution of spine-bound Na to whole-shell Na/Ca values (Figs. 5 and 8). To compare the exponential calibrations ofG. ruberandT. sacculifer, the calibration of Bertlich et al. (2018) was extrapolated with an exponential calibration. The relative contribution of spines to the total Na/Ca, based on LA-ICP-MS-measured spine Na/Ca at a salinity of 39.6 (27.5 mmol mol−1 Na/Ca for G. ruber and 28.5 mmol mol−1forT. sacculifer, Mezger et al., 2018) as well as EPMA-based spine Na/Ca at a salinity of 39.8 (on average 15.6 mmol mol−1 Na/Ca for G. ruber and 16.9 mmol mol−1forT. sacculifer), was calculated based on the following equations.
Na/CaMezger et al.2016=ρ×Na/CaBertlich et al.2018+(1−ρ)
×Na/Caspine (1)
Na/CaMezger et al.2016−Na/Caspine=ρ
× Na/CaBertlich et al.2018−Na/Caspine
(2) ρ= Na/CaMezger et al.2016−Na/Caspine
/ Na/CaBertlich et al.2018−Na/Caspine
(3) This suggests a relative spine and spine base contribution from 20.8 % (exp) to 19.75 % (lin) for G. ruberand from
20.63 % (exp) to 19.82 % (lin) for T. sacculifer. However, when calculating the relative spine contribution from EPMA- based spine Na/Ca values, the relative spine contribution ranges from 46.7 % (exp) to 43.3 % (lin) for G. ruber and from 42.83 % (exp) to 42.93 % (lin) forT. sacculifer, which seem unrealistically high. To calculate the Na/Caspinebased on a constantρfor different salinities (Fig. 8), the following equation is used.
Na/CaMezger et al.2016−(ρ×Na/CaBertlich et al.2018) /
(1−ρ)=Na/Caspine (4)
Based on these calculations, LA-based spine Na/Ca values should increase 1.4 to 2.1 times forG. ruber(linear to ex- ponential), and forT. sacculifer 1.4 to 2.2 times (linear to exponential) within a natural salinity range from 30 to 40 to account for the difference in absolute values between stud- ies (Fig. 9). Alternatively, the Na concentration of spines (1−ρ) changes with increasing salinities (Eq. 3), from 8.6 % to 21.6 % or 19.9 % to 27.8 % forG. ruber(exponential and linear) and from 7.9 % to 21.4 % or 13.4 % to 20.1 % forT.
sacculifer(exponential and linear).
No appreciable change in the number of spines (e.g., spine density) with increasing salinity has been observed and also the width of the spines appears to decrease rather than increase with increasing salinity (Fig. 4). Spine length could vary with salinity, but we were unable to quantify spine length as spines easily break off during sampling and sample processing. Spines are connected to the planktonic
Figure 9. Comparison of Na/Ca-salinity calibrations between surface-water-collected spinose planktonic specimens still contain- ing spines (whole-shell) (Mezger et al., 2016) and extrapolated cul- tured shell-onlyT. sacculifer(Bertlich et al., 2018). The difference in absolute values is assumed to be caused by spines (arrow)(a).
(b)Theoretically calculated Na/Ca values of the spines, in case of (a).(c)Difference in absolute values by exponential calibrations.
(d) Theoretical calculated Na/Ca values of the spines, in case of (c).
foraminiferal shell through a thin organic lining, which is easily removed during cleaning. The slight offset in absolute values between the cultured T. sacculiferand core tops can be explained by spine bases, still partially present in the shell wall after gametogenesis or burial.
Combining all spine and spine base Na/Ca values com- pared to ambient salinity would suggest a trend towards higher Na incorporation with higher salinities, which is, however, not significant. Compared to shell Na/Ca compo- sition of the same specimens, spine Na/Ca values are 2–
4 times higher. For Red Sea core tops, no spines are ob- served (Mezger et al., 2018), and SEM images often show spine holes, probably associated with life-stage-related (ga- metogenesis) spine loss. Some spine bases remain present, allowing quantification of core-top spine base Na/Ca. Com- paring the EPMA-measured spine and spine base Na/Ca val- ues with values calculated using a mass balance (see Figs. 8–
10) shows that measured absolute Na/Ca values are lower and not in line with the calculated difference in slopes. This suggests that either (1) spine base Na/Ca does not vary with
salinity, (2) EPMA-measured values for spine-base and spine Na/Ca underestimate true spine values (Fig. 10) or (3) spine base Na/Ca values are significantly lower compared to the actual spine values. Furthermore, in this study, we analyzed a limited number of individuals and more specimens and measurements would be needed to identify a potential rela- tionship between spine Na and salinity. Although we here show a major impact of spines and spine bases on Na/Ca, the Na/Ca values of the shell itself seem relatively robust (Figs. 7 and 10). Comparing both shell and spine Na/Ca val- ues with salinity shows that shell chemistry records salinity, albeit with a very modest slope (Figs. 5 and 10).
5 Conclusions
Whole-shell Na/Ca values, including spines and spine bases, show an offset to shell-only values due to the (variable) contribution of spine- and spine-base-related carbonate, en- riched in Na. Both absolute values and its relation to salinity show an offset between specimens with and without spines.
Whereas the high Na areas may be susceptible to taphonomic or ontogenetic alteration, the chemistry of the shell itself ap- pears relatively robust. The Na composition of foraminiferal organic linings is, although higher than shell Na/Ca, not suf- ficient to significantly influence the overall Na/Ca values measured. Neither spine Na/Ca values nor their width or density appear to respond to changes in salinity. However, potential effects of diffusion or sampling volume errors re- lated to EPMA could also have resulted in somewhat lower spine base compared to spine Na/Ca values. Comparing both shell and spine Na/Ca values with salinity shows that shell- only values still record salinity, albeit with a low sensitivity.
This is relevant for the paleoapplication of Na/Ca in recon- structing salinity since spines may not always be well pre- served.
Data availability. All data on which this publication is based can be found in the tables in the paper and through the follow- ing link: https://doi.org/10.4121/uuid:4aca8e7d-7e42-448b-9a77- f62c61e85049 (Metzger et al., 2019).
Supplement. The supplement related to this article is available online at: https://doi.org/10.5194/bg-16-1147-2019-supplement.
Author contributions. GJR, LJdN and EMM designed this study.
All data preparations, measurements and interpretations were exe- cuted by EMM, with daily discussions with GJR and LJdN. Part of the measurements (culture experiments) was measured together with JaB. These culture experiments were carried out by JeB. EMM analyzed the data and prepared the paper, with contributions from all co-authors.
Figure 10. (a)Changes of Na/Ca spine bases and spines (multi-net only) with salinity, with the trend of all data indicated with the dashed line and(b)comparison of different existing Na/Ca shell–salinity calibrations with indicated standard errors. The regression lines refer to the samples in the same color (also indicated in the legend). We have also separated data based on the analytical technique used, which were EPMA and laser ablation (LA) measurements, respectively.
Competing interests. The authors declare that they have no conflict of interest.
Acknowledgements. This research is funded by the NIOZ – Royal Netherlands Institute for Sea Research and supported by the Gravi- tation grant NESSC from the Dutch Ministry of Education, Culture and Science. We thank Wim Boer, Patrick Laan, Bas van der Wagt (NIOZ), Serguei Matveev and Tilly Bouten (Utrecht University) for their analytical assistance. Furthermore, we would like to thank Linda Dämmer and Siham de Goeyse (NIOZ) for their help with picking foraminiferal specimens for spine analyses, and Es- mee Geerken for her assistance with EPMA data processing. We would also like to thank the editor and two reviewers, Takashi Toy- ofuku and Ralf Schiebel, for the constructive comments. We are also grateful to all technical staff on board of RV Pelagiacruise 64PE158 and the other cruises.
Review statement. This paper was edited by Hiroshi Kitazato and reviewed by Takashi Toyofuku and Ralf Schiebel.
References
Allen, K. A., Hönisch, B., Eggins, S. M., Haynes, L. L., Rosen- thal, Y., and Yu, J.: Trace element proxies for surface ocean conditions: A synthesis of culture calibrations with plank- tic foraminifera, Geochim. Cosmochim. Ac., 193, 197–221, https://doi.org/10.1016/j.gca.2016.08.015, 2016.
Bé, A. W. H.: Gametogenic calcification in a spinose plank- tonic foraminifer, Globigerinoides sacculifer (Brady), Mar.
Micropaleontol., 5, 283–310, https://doi.org/10.1016/0377- 8398(80)90014-6, 1980.
Beniash, E., Aizenberg, J., Addadi, L., and Weiner, S.: Amorphous calcium carbonate transforms into calcite during sea urchin lar- val spicule growth, P. Roy. Soc. Lond. B Bio., 264, 461–465, https://doi.org/10.1098/rspb.1997.0066, 1997.
Bertlich, J., Nürnberg, D., Hathorne, E. C., de Nooijer, L. J., Mezger, E. M., Kienast, M., Nordhausen, S., Re- ichart, G.-J., Schönfeld, J., and Bijma, J.: Salinity con- trol on Na incorporation into calcite tests of the planktonic foraminifera Trilobatus sacculifer–Evidence from culture exper-