Abstract... 1
1. Introduction... 2
2. Dutch Disease ... 3
3. Features of Bhutan’s Power Export ... 5
4. Macroeconomic Impacts of Bhutan’s Power Export Boom ... 7
a. Impacts on National Income... 7
b. Impacts on Government Revenue... 7
c. Impacts on External Positions and International Reserves... 8
d. Impacts on Real Exchange Rates... 9
5. Is There a Dutch condition in Bhutan?... 11
a. Spending Effect... 12
b. Resource Movement Effect ... 13
c. Monetary Effect ... 15
6. Policy Strategies... 15
a. Exchange Rage Management ... 16
b. Fiscal Policy... 17
c. Private Sector Development ... 18
5. Conclusions ... 20
Appendix: Empirical Analysis: Determinants of Bilateral Exchange Rate of The Ngultrum ... 22
a. The Model... 22
b. Regression Analysis ... 25
c. Conclusions ... 27
d. Definition of Variables and Data Source... 28
References... 30
Abstract
Bhutan has shown remarkable economic performance over the last two decades, supported by generous aid inflows and buoyant hydropower exports to India. However, the Bhutanese Ngultrum has appreciated over time, raising concerns if this is a sign of Dutch disease, shadowing the growth prospects of Bhutan. I examine empirically the presence of Dutch disease in the Bhutanese economy. My analysis finds no evidence of a contraction or stagnation of the non-power tradable sector.
While there is no imminent threat that requires urgent policy intervention, future expansion of power exports or aid inflows will likely put further downward pressure on the Ngultrum, and may eventually damage the non-power tradable sector. Bhutan’s future economic prosperity depends crucially on the policy strategies for exchange rate management, fiscal policy and private sector development.
JEL Classification: O24; E50; E62; O53
Keywords: Dutch disease; Trade; Renewable resources; Exchange
rate; Bhutan
2
Bhutan: Power Exports and Dutch Disease
1. Introduction
Bhutan has shown remarkable economic performance over the past two decades. Growth since the second half of the 1990s was particularly strong, with annual GDP growth averaging nearly 7 percent, largely supported by generous inflows of foreign aid and buoyant electricity exports to India, which have spurred growth both directly by expanding export earnings and indirectly by stimulating investment in the construction and transport industries.
Growth prospects for Bhutan look bright with enormous hydropower generation potential. In particular, the commissioning of the Tala hydropower project, scheduled in late 2005, is expected to give a major boost to growth by tripling Bhutan’s power generation capacity.
While the expansion of power exports has brought significant benefits to Bhutan, there are concerns that it may not be an
“unmitigated blessing.” Despite large inflows of foreign capital, Bhutan’s macroeconomic indicators suggest that inflation has so far been modest and under control. Over time, however, the Ngultrum has appreciated steadily against the Indian rupee, eroding Bhutan’s export competitiveness with India.
The World Bank’s 2000 Country Assistant Strategy for Bhutan views this as a sign of Dutch disease caused by increased power exports to India, and suggests that additional power exports and aid inflows, including the World Bank’s financial assistance, may undermine the country’s growth prospects as real appreciation would discourage production and investment in the tradable sector.
This paper examines empirically the macroeconomic impacts of
Bhutan’s increased power exports to India. This is the first serious
attempt to address the presence of Dutch disease in the Bhutanese
economy. Previous attempts had been hampered by lack of
sufficiently long time-series data. Four sets of key questions are
addressed in this study: (i) what are the features of Bhutan’s power exports? Is it a temporary or permanent phenomenon? (ii) What have been the macroeconomic impacts of power exports? Have power exports affected the exchange rate of the Ngultrum? If so, would the commissioning of the Tala project lead to further appreciation of the Ngultrum? (iii) What have been the impacts on the tradable sector? Are there Dutch-disease symptoms? (iv) Are these impacts sizable enough to require policy interventions? If so, what kind of policy options are available? As the country’s power export capacity sets to rise considerably in the near future, understanding possible adverse impacts of power exports, if any, is crucial for Bhutan’s future macroeconomic management.
The structure of this paper is as follows. Section 2 briefly reviews the mechanism of how a natural resource export boom can lead to real appreciation and then to contraction of the tradable sector—i.e., how Dutch disease can happen. Section 3 discusses the features of Bhutan’s power exports, and assesses the macroeconomic impacts of power exports. It also investigates empirically the impacts on the real exchange rate of the Ngultrum. Section 4 then examines the presence of Dutch disease symptoms in the Bhutanese economy.
Section 5 discusses policy responses to increasing power income.
Finally Section 6 concludes the paper.
2. Dutch Disease
A natural resource-based export boom can cause major distortions in an economy by discouraging production and investment in the non-booming exportables sector, often referred to as “Dutch disease.” Extensive literature on the subject has been surveyed by Corden (1984) and Neary and van Wijnbergen (1986). Also see Buiter and Purvis (1983), Corden and Neary (1982), Eastwood and Venables (1982), Neary and van Wijnbergen (1984), and van Wijnbergen (1984).
Dutch disease has both short- and long-run effects. In the long-run,
a resource-based export boom affects production, profitability,
wages and employment through two distinct channels: spending
and resource movement effects (Corden and Nearly, 1982). In the
4
short run, however, a resource-based export boom may affect the economy through a monetary disequilibrium (Edwards, 1984, 1986).
The spending effect begins with the higher real income generated by an export boom. Through the income effect, the higher real income will raise spending on both tradables and non-tradables (provided that they are normal goods), raising demand for both goods. While any excess demand for tradable goods will be met by increased imports, excess demand for non-tradables will raise the relative prices of non-tradables, unless there is a corresponding increase in supply. This amounts to a real appreciation of the home currency, drawing resources out of the tradable to non-tradable sector.
As the relative price of non-tradables rise, so does real wages and returns to capital accumulation decline, both labor and capital will also move out of the tradable to non-tradable sector, squeezing production and profitability of the tradable sector further and ultimately slowing growth of exports. When the booming sector operates as an enclave sector (i.e., no participation in domestic factor markets), resources will move out of the non-booming tradable sector, but the booming sector will not be affected.
These adjustments to an export boom—contraction of the tradable
sector relative to the non-tradable sector, following real
appreciation of the home currency—summarize the classic model of
Dutch disease. It is a natural factor movement due to changes in
relative prices, and is a natural welfare improving symptom of the
economy’s adjustment to its new equilibrium. Despite its name,
however, Dutch disease itself does not constitute a “disease” for
which corrective actions are called for, but is a “condition” in which
relative price changes caused by an export boom tend to cause a
change in the economic structure. Thus it would be more accurate to
refer to it as a “Dutch condition” than “Dutch disease.” Whether a
Dutch condition leads to a real disease largely depends on the
country’s policy responses to the boom.
In the short run, a resource-based export boom has an important monetary effect through a balance of payments surplus and corresponding reserve accumulation. Unless the increase in reserves is fully sterilized, the monetary base will also increase, generating a short-term monetary disequilibrium. Consequent inflationary pressures will force the real exchange rate to decline in the short run by a larger amount than in the long run, exacerbating the loss of competitiveness of exports in the short run. This monetary channel, however, will operate only in the short run, affecting the dynamics of the real exchange rate. In the long run real exchange rates respond only to changes in the real fundamentals.
3. Features of Bhutan’s Power Export
Bhutan’s hydropower exports to India began in 1987 with the commissioning of the 336MW Chukha hydropower project, which has boosted GDP directly through export earnings and indirectly through growth of the construction and transport industries, as well as energy-intensive industries such as cement, ferro-alloys, and calcium carbide. According to the long-term bilateral purchase agreement between Bhutan and India, after Bhutan’s domestic demand is met, all surplus supply of power (over 90 percent of generated electricity) is exported to India, whose vast market suffers chronic excess demand.
The power sector operates as an enclave sector in the Bhutanese economy. It does not participate in domestic factor markets. The sector generates very little domestic employment and uses expatriate labor from India. Financing of power projects is provided exclusively by the Government of India, the largest donor and creditor for Bhutan. Thus, there is no resource movement between the power sector and the rest of the economy in Bhutan.
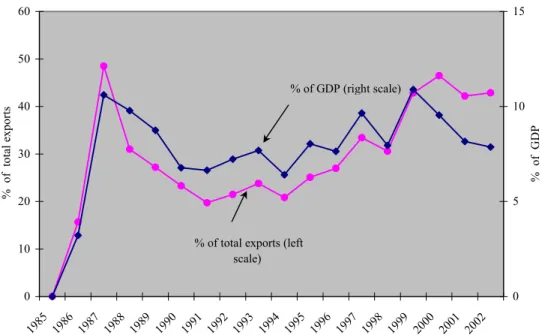
Over time, sales of hydropower have become Bhutan’s dominant
source of export revenue. At its peak, in 1999/2000, power export to
India generated about 40 percent of Bhutan’s total export revenue,
and accounted for about 13 percent of GDP (Figure 1). Nonetheless,
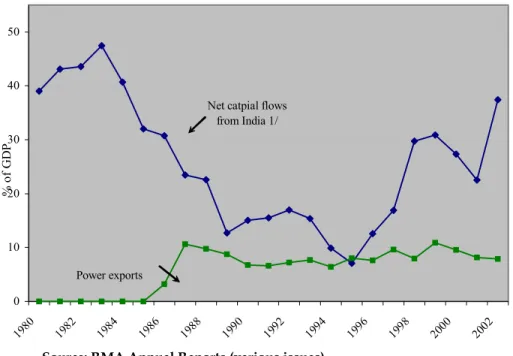
the magnitude of power export income is far smaller than of aid
receipts from India (Figure 2). Power sales to India declined slightly
6
during 2001-02, reflecting a lower volume of electricity exported to India, caused by a poor river inflow during the non-monsoon season in 2002 and lower surplus power as a result of higher domestic consumption.
Bhutan’s major power project, Tala, is well on its way to completion in late 2005. Upon commissioning of the Tala project (1,020 MW), Bhutan’s power export capacity is projected to triple, significantly boosting power export revenue and providing additional support for domestic supply of power. With the Tala project nearing completion in 2005, Bhutan is set to launch another mega-power project, the proposed Punatsangchu hydropower project. Upon its completion, Bhutan’s total power generation capacity is expected to rise to 2,355 MW, equivalent to about 15 percent of the country’s technically viable power generation potential.
The power tariff for export is set bilaterally with the Government of India at the political level. The nominal tariff has been revised every two or three years since 1992 primarily to keep pace with inflation.
Since 1996 the nominal tariff has been revised more frequently and more sharply. As a result, the real power tariff more than doubled between 1996 and 2000. Payments for power sales, as well as all other imports and exports between Bhutan and India, take place only in the Indian rupee (which is also legal tender in Bhutan), to which the Bhutanese currency, Ngultrum, is pegged at parity according to the bilateral free trade agreement between the two countries.
All the power plants in Bhutan are owned by the Government of Bhutan, managed by the Ministry of Trade Industries and Power. It is not India’s foreign direct investment. Given the large size of operation, financing and expenditure for the construction of power projects are recorded outside the government budget. Upon commissioning, power export proceeds are channeled to the budget via surplus transfers, corporate taxes and dividend payments.
Because of the long-term sales agreement with India, power export
earnings will continue to be a permanent source of income for
Bhutan. Since the tariff is adjusted periodically between the two countries, there is no volatile price movement. Risks of reduced demand from India is likely to be very small. At present, Bhutan supplies less than 0.5 percent of India’s demand. While domestic demand for power has risen with the progress of the rural electrification program, the commissioning of the Tala project is expected to meet both Bhutan’s increased demand and a larger part of India’s demand. Risks of sharp contractions in electricity supply as a result of technical and climate change are also considered low.
Bhutan’s power plants are operated as run-of-the-river schemes and are environmentally benign. Unlike other natural resource export booms based on exhaustible resources (such as oil, gas, coal, copper), Bhutan’s power exports are based on a renewable and environmentally friendly resource. Hence, power exports constitute a stable, permanent phenomenon for Bhutan, but not a temporary one. Looking ahead, the power sector is expected to continue to be the main engine of growth and a source of significant rupee earnings.
4. Macroeconomic Impacts of Bhutan’s Power Export Boom
a. Impacts on National Income
Regular power exports to India have raised Bhutan’s national income and accelerated its growth rate. Annual GDP growth jumped from the average rate of 7 percent for 1980-86 to 18 percent in 1987, following the commissioning of the Chukka project. During the initial years, GDP growth appeared modest, at 4 percent per year during 1988-94. However, as a result of repeated tariff revisions in the late 1990s, growth accelerated, with GDP rising at above 6.5 percent per year for 1995-2003.
b. Impacts on Government Revenue
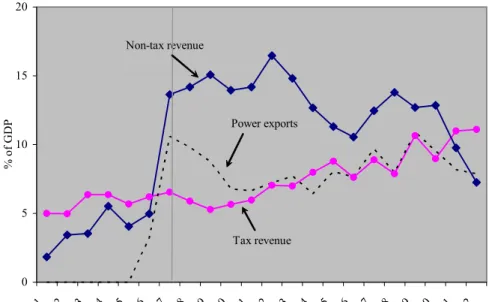
Power exports to India have also contributed significantly to a rise
in government revenue. Data indicate that tax revenue has risen
gradually during the last two decades, while non-tax revenue has
increased sharply since 1987 due likely to considerable surplus
transfers and dividend payments from the Chukka project (Figure
8
3). As a result, total government revenue jumped from mere 10 percent of GDP in the early 1980s to over 22 percent in 2002.
Although detailed information on budgetary operations is unavailable, it is estimated that since 2000 the power sector has contributed to 45 percent of government revenue through corporate taxes, dividend payments and surplus transfers, and this is expected to rise to 90 percent when the Tala project begins its full operation.
c. Impacts on External Positions and International Reserves
1Bhutan’s current account position with India has improved markedly as a result of regular power exports. While Bhutan has continued to run a current account deficit with India throughout the past two decades, the magnitude of deficit has shrunk considerably since regular power exports began. Along with large power export income, imports of machinery, transport, and mechanical appliances have grown sharply in the late 1990s, reflecting increased imports of capital goods and intermediate goods for the construction of the Tala project. Non-durable consumer goods, particularly food items, have grown substantially over time. While a strict distinction between imports of consumer goods and capital goods is often difficult, it is viewed that power exports have fuelled consumption through the income effect.
Notwithstanding the persistent current account deficits, Bhutan’s balance of payments with India has been in significant surplus most of the time due to a considerable amount of aid receipts (concessional loans and grants), except for the early 1990s when India suffered a BoP crisis.
1
Because of the special relationship with India, Bhutan maintains two sets
of external accounts: one with India denominated in the Indian rupee, and
the other with countries other than India denominated in the US dollar.
Reflecting the strong BoP position with India, Bhutan has accumulated sizable rupee reserves. As of June 2004, gross rupee reserves stood at Rs.4.3 billion (about US$93 million), equivalent to over 6 months of imports from India. Convertible currency reserves have also increased steadily to nearly US$280 million in June 2004, equivalent to 187 months of imports from countries other than India.
d. Impacts on Real Exchange Rates
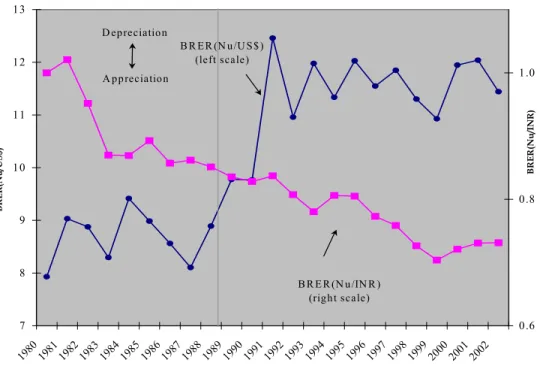
Figure 4 shows the bilateral real exchange rate of the Ngultrum against the Indian rupee, BRER (Nu/INR), and against the US dollar, BRER(Nu/US$), for the period 1980-2002. In this paper, we use the WPI of India, WPI
I,t, as a proxy for the prices of non-power tradables in India, and the consumer price index of Bhutan, CPI
B,t, for the prices of non-tradables in Bhutan: BRER
t(Nu/INR) = WPI
I,t/CPI
B,t. For prices in India, the choice of WPI over CPI is made since a large part of items in the Indian CPI basket is non-tradables, particularly services, whereas the Indian WPI consists mostly of tradables, whose prices matter in calculating the bilateral real exchange rate. As regards prices of non-tradables in Bhutan, CPI is not a perfect proxy since the consumer basket used for the CPI calculation (not updated since 1979) consists of consumer goods only in Bhutan, and does not include services such as housing, transport and communication that are usually included in the CPI basket in other countries. Despite this disadvantage, we view that Bhutan’s CPI is a reasonably good indicator for prices of non- tradables, since prices of virtually all tradable goods brought into the Bhutan include high costs of dometic transport, which is non- tradable.
Figure 4 shows that BRER(Nu/INR) has been on a gradual
downward trend till 1999, indicating real appreciation of the
Ngultrum against the rupee. During 2000-01, the Ngultrum
depreciated slightly against the rupee. Note that the Ngultrum’s
exchange rate path is smooth, but not volatile, in sharp contrast to
the experiences in other natural resource exporting countries, due in
part to the fixed exchange rate arrangement between Bhutan and
India, but more importantly due to the power sales agreement
10
between the two countries, which effectively prevents volatile price movements.
This trend differs considerably for the exchange rate of Ngultrum against the US dollar, which depreciated during 1980-2002. The exchange rate of the Ngultrum against the US dollar is determined by the exchange rate of the Indian rupee against the dollar. The sharp real depreciation of the Ngultrum to the US dollar in the early 1990s was driven by India’s balance of payments crisis.
Now that we have the historical behavior of real exchange rates of the Ngultrum, we examine its relationship with power exports.
Hereafter, we focus only on the bilateral real exchange rate of the Ngultrum against the rupee. Given that Bhutan’s primary trade partner is India, with which power trade takes place, the exchange rate of the Ngultrum to the rupee matters most in examining the presence of a Dutch condition in the Bhutanese economy. Unless otherwise specified, hereafter the “exchange rate” refers to the bilateral real exchange rate of the Ngultrum to the rupee. Similarly,
“real appreciation” refers to real appreciation of the Ngultrum against the rupee.
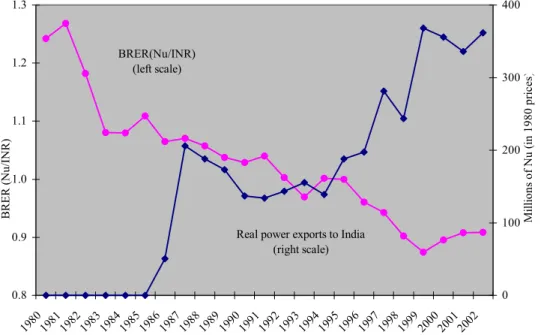
Figure 5 presents both the bilateral real exchange rate and real power exports for 1980-2002. The real exchange rate and power exports appear to be negatively correlated. While real appreciation started before Bhutan began regular power exports in 1987, due likely to massive aid inflows from India for the construction of the Chukka project, the rate of appreciation accelerated in the late 1990s, when Bhutan’s power export income increased substantially as a result of sharp upward tariff revisions. As power exports to India stagnated during 2000-01, the Ngultrum depreciated against the rupee.
To examine this relationship more formally, we conduct a
regression analysis using annual data for 1983-2001. Details of the
analysis are provided in Appendix. Here only the main findings are
reported.
The regression results indicate that power exports have indeed caused the real appreciation of the Ngultrum over time. Increases in both the power tariff (in real terms) and the volume of power exports are significantly negatively correlated with the real exchange rate, implying that future increases in either variable are likely to cause further appreciation of the Ngultrum.
The results also suggest that real appreciation took place through the accumulation of international reserves, affected by power export income and large aid inflows. The accumulation of reserves has raised money supply beyond the demand for money, creating a short-term monetary disequilibrium. In the regression results, the monetary disequilibrium term is significantly negatively correlated with the exchange rate, meaning increases in reserves have led to real appreciation through the monetary effect.
Changes in government expenditure, a proxy for government spending on non-tradables, do not appear to have significantly affected the exchange rate, implying the government expenditure is not been the main channel through which the spending effect has taken place. It may be that a large part of government spending has been directed towards purchases of tradable goods such as imported capital and intermediate goods instead of non-tradables.
In sum, real appreciation of the Ngultrum has likely been caused by power exports and the monetary disequilibrium associated with the reserve accumulation. An increase in power exports and/or capital inflows in the future, regardless of which currency they are denominated in, will likely put further downward pressure on the real exchange rate of the Ngultrum against the rupee. In contrast, government expenditure has not had a significant impact on the exchange rate.
5. Is There a Dutch condition in Bhutan?
Now that we know that real appreciation of the Ngultrum has been
caused by power exports, we now turn our attention to the
question, “Is there a Dutch disease symptom in Bhutan?” In other
words, is there a stagnation in the non-power tradable sector? If so,
12
how did it happen? To answer these questions, we examine the economy’s adjustment to the increased power exports in light of (i) a spending effect; (ii) a resource movement effect; and (iii) a monetary effect.
a. Spending Effect
The formal investigation in Section 4 does not show a strong relationship between government spending and real appreciation, indicating that government spending is not the main channel through which the spending effect of the power export boom has taken place. Then, is it the private sector that has spent large part of the power export income?
Following Gelb (1986), we calibrate how power export earning has been absorbed in the Bhutanese economy. First, data on private consumption and public consumption are measured in percent of GDP, and investment in percent of GDP is derived as a residual from total absorption. Second, the components of absorption are scaled by non-power GDP and then compared with those scaled by GDP (norms). The difference between these two represents domestic absorption of power income.
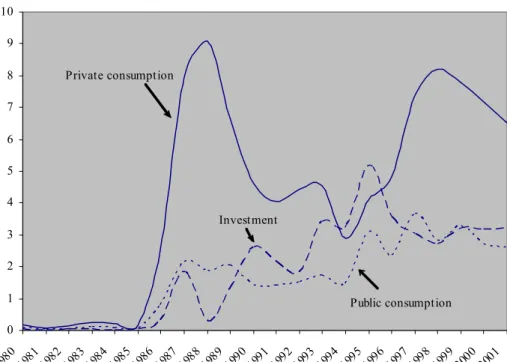
Figure 6 plots the results of this calibration. It shows the composition of absorption of power export revenue, expressed in percent of non-power GDP for 1980-2001. The composition indicates a strong bias in favor of private consumption. There are two distinct private consumption booms in Bhutan, the first in 1988 and the second in 1999. In both periods, Bhutan experienced a sharp rise in power export revenue, suggesting that private consumption was likely fuelled by rising expectation for higher income (confidence effect). When the ratio of power exports to GDP declined (1989-95 and 1999-2001), the private sector consumed less of power income.
Trade data confirm that the rise in private consumption is reflected in an increasing volume of imports of consumption goods, most notably, luxury food items (i.e., increased demand for tradables).
Government consumption did not respond to the rising power
income as much, although it has risen gradually over time.
The use of power income for investment rose during the early 1990s and declined since 1995. Interestingly, in Figure 6 the movement of investment is exactly the opposite of that of private consumption.
Distinction between private and public investment is not possible since domestic investment is treated as a residual in this calibration.
Nonetheless, there are good reasons to believe that private investment has responded more strongly to power income than public investment. First, although data are sketchy, there is a general perception that the price of land, the primary asset in the composition of wealth in agrarian societies like Bhutan, has shown a dramatic rise in the last decade, indicating that demand for non- tradables is also on the significant rise. Demand for another non- tradable good, labor, also appears to be increasing. Data on wages are not available for verification, but it is felt that wages are rising rapidly in Bhutan relative to India, attracting a large inflow of illegal Indian workers.
Second, a substantial part of government capital expenditure has been financed with foreign grants according to the government’s expenditure policy, thus less power income has been used to finance public investment, and more of it has gone to finance private investment. Notwithstanding, the overall level of private investment in Bhutan remains very low, with most investment undertaken by the public sector.
All this suggests that much of the spending effect of power exports has taken place through private sector activities. Private sector’s demand for both tradables and non-tradables rose as a result of higher income, which led to an import expansion and pushed up the relative price of non-tradables. This explains why our empirical analysis does not find a strong correlation between government spending and the real exchange rate.
b. Resource Movement Effect
In the absence of sectoral data on wages, employment and
investment, it is not possible to examine resource movements
directly. Thus, we use data on sectoral production and trends of
14
exports to examine indirectly whether relative price changes have undermined growth and export performance of the tradable sector.
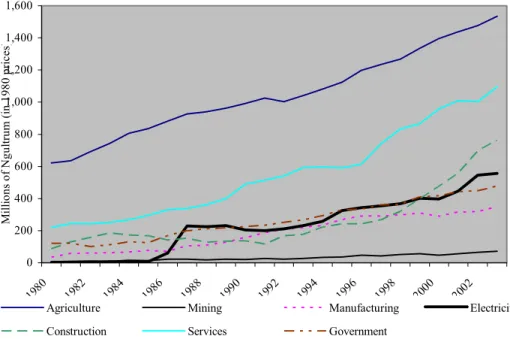
Figure 7 presents the sectoral contribution to GDP in 1980 prices for 1981-2003. According to Figure 7, all sectors, both tradable and non- tradable, have grown strongly in real terms. Agriculture is the principal contributor to GDP, and has grown steadily at an average rate of over 4 percent per year throughout the period. Modern sectors—services, construction (non-tradables), manufacturing and mining (non-power tradables) as well as hydropower—have grown more rapidly over time, indicating that the production structure of Bhutan has become slightly more diversified over time. Growth of hydropower, manufacturing and mining sectors is most notable.
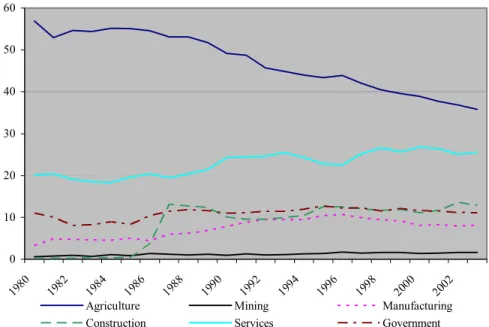
During 1986-2003, the power sector grew at over 80 percent a year, while manufacturing and mining grew at an average rate of 12 percent and 14 percent a year, respectively. Nevertheless, the latter two sectors are still in their infancy, with their value added accounting for only 7 percent and 1.5 percent of GDP in 2003, respectively (Figure 8).
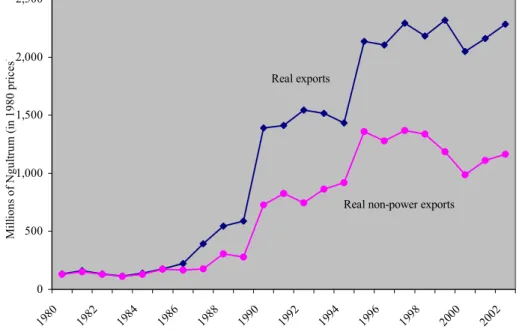
Meanwhile, trends of exports, presented in Figure 9, suggest that despite real appreciation of the Ngultrum against the rupee, Bhutan’s total exports to India have grown sharply—some 15-fold during the last two decades. A large part of this increase is attributable to power exports. However, non-power exports have also grown strongly by nearly 10 times, indicating that real appreciation have not undermined the tradable sector’s growth significantly. Exports to countries other than India, mainly Bangladesh, have grown too but the magnitude is still small, accounting for about 5-6 percent of total exports, compared to exports to India, which accounted for 90 percent of total exports in 2002.
In conclusion, from the exports and sectoral production data alone,
we find no evidence to suggest that power exports—and aid
inflows—have led to a contraction of the tradable sector relative to
the non-tradable sector, despite the substantial decline in the
relative price of tradables. Thus far, there is no sign of a Dutch
condition in the Bhutanese economy. There are three possible
explanations for this. First, the non-tradable sector could have grown more rapidly in the absence of the real appreciation than otherwise. Second, factors, particularly, labor, may not have been as mobile between tradable and no-tradable sectors. For example, farmers in remote terrains were not easily able to move to the capital city where non-tradable sector activities, such as services and construction, are concentrated. Third, in a strict sense agriculture may not represent a tradable sector in Bhutan, where the majority of agricultural activities in rural areas are subsistence- based. Thus, relative price changes did not motivate farmers to move to another non-tradable industry.
c. Monetary Effect
Large balance of payment surpluses and corresponding accumulation of international reserves have, in the absence of full sterilization, resulted in excess liquidity, but have so far posed no significant inflationary pressure in Bhutan.
Driven by power exports and large aid inflows, Bhutan has enjoyed large balance of payments surpluses and corresponding accumulation of international reserves. As a result, money supply has grown rapidly particularly since 1997, at the average growth rate of over 30 percent per year. The Royal Monetary Authority of Bhutan (RMA) has attempted to sterilize the rapid growth of liquidity to contain inflationary pressure by raising reserve requirements and selling central bank bills, but this was only partially successful. While this has helped to reduce excess liquidity in the financial system somewhat, inflationary pressures have also been mitigated by a declining velocity of money, reflecting limited lending opportunities in Bhutan, due to a weak legal framework, a limited entrepreneurial culture, and conservative lending practices.
As a result, monetary disequilibrium has been small, and Bhutan’s inflation have remained moderate, with a year-on-year CPI inflation at mid-2004 being 1.2 percent.
6. Policy Strategies
We have so far discussed that regular power exports to India have
brought enormous economic benefits to Bhutan—faster growth,
16
higher government revenue, and rising living standards.
Nevertheless, in response to large power exports and aid inflows, the Ngultrum has gradually appreciated against the rupee over time through increased private spending and monetary disequilibrium. Despite real appreciation, however, there is no evidence to suggest contraction or stagnation of the non-power tradable sector; there is no sign of a Dutch condition in the Bhutanese economy.
Future prospects of Bhutan are bright, supported by enormous potential of hydropower generation. External vulnerabilities appear modest, with strong commitments to financial assistance by Bhutan’s development partners. Nonetheless, Bhutan is not completely free of risks. Growth prospects of Bhutan will crucially depend on appropriate policy strategies to forestall these risks.
a. Exchange Rage Management
The first risk is related to exchange rate management. The commissioning of the Tala hydropower project expected in late 2005 will triple Bhutan’s power export capacity, likely putting considerable downward pressure on the Ngultrum. Although real appreciation of the Ngultrum is a long-term, unavoidable equilibrium phenomenon based on a renewable source of income, controlling the speed of appreciation might become necessary in light of inflationary threat.
With the strong expectation that the power sector will continue to dominate the country’s exports, the non-power tradable sector may have a stronger incentive to get used to the strong real exchange rate than it would if the resource were non-renewable and the export boom were temporarily, accelerating factor movements.
Similarly, too rapid real appreciation, especially for a prolonged
period, will likely fasten resource movements. Incentives for
production and investment in the non-power tradable sector can be
rapidly lost, exacerbating the contraction/stagnation of the non-
power tradable sector. Then it becomes important for the
Government to control the speed of appreciation through
appropriate exchange rate management, especially if foreign exchange inflows begin to give rise to inflationary pressures.
For Bhutan, such exchange rate management should consist of measures to slow the rise in disposable income. There are three possible approaches. One is through taxation to control the growth of disposable income, the second thorough more aggressive sterilization, and the third through temporarily controlling the size of export income and capital inflows to the economy. The last option can be done by temporarily maintaining some portion of export income offshore through a stabilization or saving fund (e.g., Botswana, Norway), or by temporarily suspending net capital inflows (e.g., by repaying foreign debt), should the speed of real appreciation be deemed too rapid (see Fasano, 2000 for cross- country experiences of oil stabilization and saving funds). Such measures to restrict capital inflows should be used only in the short term to slow the speed of real appreciation, but not to prevent real appreciation, which is a long-term phenomenon. The power tariff and volume of power exports cannot be used as short-term policy variables since they are fixed at a politically determined level with India. Similarly, nominal devaluation of the Ngultrum is not considered.
b. Fiscal Policy
Second, growth prospects of Bhutan will depend crucially on how
effectively the Government conducts its fiscal policy. Despite recent
fiscal easing, the Royal Government of Bhutan has maintained fiscal
prudence, with domestic revenues more than covering recurrent
expenditures and a maximum use of foreign aid for development
expenditure. Over the last few years, more than a third of
government expenditure has been allocated to infrastructure, health
and education. Much of that, however, has been possible due to
generous aid inflows. While the risk of reduced aid is viewed as
slim, Bhutan’s long-term development strategy should be directed
towards reducing its heavy reliance on aid to achieve self-
sufficiency, while using power income and aid effectively to expand
the country’s future production capacity.
18
The fiscal priority for the Government should therefore be to continue fiscal prudence while channeling substantial resources to human capital formation and infrastructure investment. Human capital formation should focus on upgrading technical skills in the aim of raising labor productivity. Infrastructure investment should aim at reducing high domestic transport costs, thereby mitigating disadvantages of Bhutan’s landlocked and isolated location in serving regional and global markets. The contribution of improved infrastructure base, both human and physical, to economic growth should lie in the stimulation and greater efficiency it promises for future productivity and profitability of tradable and non-tradable sectors.
However, the Government needs to be cautious so that the level of expenditure does not outstrip domestic implementation capacity, which would adversely affect the efficiency of spending. Bhutan could follow, for example, Botswana’s experience to determine the adequate level of government spending. In the 1980’s, the Government of Botswana put a large part of windfall from soaring diamond exports in foreign savings, and used only when the absorptive capacity of the economy was deemed sufficient. By determining the level of government spending, the Government of Botswana paid close attention to two constraints: (i) availability of skilled manpower; and (ii) future recurrent costs of development spending relative to revenue forecasts (Harvey, 1992).
At the same time, the Government should continue to vigorously expand its internal revenue base by broadening the tax base and streamlining the tax system to ensure its efficiency with the aim of attaining fiscal self-sufficiency. It is because while power exports have contributed to a substantial rise in non-tax revenue, Bhutan has still been unable to raise enough internal revenue to reverse the trend of aid dependence.
c. Private Sector Development
The third risk is unemployment. As the economy will become more
and more dependent on power exports, with few sectors competing
with the power sector that generates few domestic jobs, the
challenge for the Government is to create employment for Bhutan’s increasingly educated labor force by fostering private sector development. Private sector development is also an effective way of addressing the excess liquidity in the financial sector. As private sector activities grow, the economy’s capacity to absorb increasing power export income will rise gradually. The scope for higher tax collection will also improve.
Despite the Government’s efforts in deregulation and its more recent moves to improve the stability and competitiveness of the financial sector, however, the private sector in Bhutan remains under-developed. Domestic credit to the private sector has hardly grown although recent data show signs of improvement.
A recent study shows that establishment of a favorable investment climate is fundamental to driving private-sector led growth and reducing poverty, and that government policies and behaviors play a key role in shaping the investment climate (World Bank, 2005). To this end, the Bhutanese government needs to update and modernize its policy framework, in particular, strengthening of the financial sector and labor market reform in addition to macroeconomic stability and provision of infrastructure.
In light of the excess liquidity concerns, strengthening of the
financial system assumes a critical importance. While the excess
liquidity has not posed a significant problem to date, risks are that it
could at some stage provide the basis for a rapid increase in bank
lending, in turn putting pressure on foreign reserve levels and the
rupee-Ngultrum peg itself. In the absence of strong project
appraisal skills, a sharp increase in domestic lending could also
increase credit risks for banks’ loan portfolio. To mitigate such risks,
it is necessary to update the RMA’s capacity for liquidity
management and its monitoring and enforcement power of the
regulatory and supervisory framework. At the same time, it is
essential to continue to raise the level and number of qualified staff
operating in the financial system, particularly in areas such as risk
analysis, project evaluation, and familiarity with regulatory
framework. The legal framework should also be strengthened to
20
allow speedy bankruptcy procedures and support financial institutions’ ability to recover their collateral.
As regards labor policies, the challenge will be increased immigration from the neighboring countries, which is currently strictly controlled by the Government to preserve Bhutan’s unique ethnicity. However, as domestic wages rise, there will be unavoidable increasing pressure for labor to move from the neighboring countries into Bhutan. While this is a very sensitive political topic for Bhutan, involving not only national ethnicity but also security concerns, allowing large labor migration into Bhutan’s labor-intensive non-tradable sector, such as construction and services, could be reconsidered, as increased immigration will relax the factor market constraint in the non-tradable sector, helping ease the downward pressure on the Ngultrum.
5. Conclusions
This paper has examined empirically the macroeconomic impacts of Bhutan’s increased hydropower exports to India. The results of the empirical analysis suggest that, while conferring enormous economic benefits to Bhutan, power exports and aid inflows have resulted in real appreciation of the Ngultrum against the rupee over time, mainly through increased private spending and short-term monetary disequilibrium. Despite the large real appreciation, however, the study has found no evidence that suggest a contraction or stagnation of the non-power tradable sector. While the tradable sector’s growth might have been stronger in the absence of real appreciation, thus far there is no sign of a Dutch condition in the Bhutanese economy.
Looking ahead, Bhutan’s growth prospects are favorable, supported
by enormous hydropower export potential. Unlike other types of
natural resource exports based on exhaustible resources (oil, gas,
coal, copper), Bhutan’s hydropower is a renewable, permanent
resource for export. However, future increases in power exports,
such as commissioning of the Tala project in late 2005, as well as
foreign aid—regardless of which currencies they are denominated
in—will likely put considerable downward pressure on the
Ngultrum, which could eventually damage the non-power tradable sector. Bhutan’s growth prospects will crucially depend on the appropriate policy strategies for effective exchange rate management, fiscal policy and private sector development.
With the increasing role of hydropower in Bhutan’s exports, there is
an obvious question as to whether the Government should continue
to seek policies for export diversification. While policy intervention
may aid the growth of the non-power tradable sector, significant
export diversification may not be a realistic aim for Bhutan. For a
small country endowed with enormous hydropower export
potential as well as a unique cultural heritage and delicate
environment, a higher degree of specialization in the hydropower
exports and tourism, may appear to be a natural development
strategy in the very long-run.
22
Appendix: Empirical Analysis: Determinants of Bilateral Exchange Rate of The Ngultrum
This appendix provides a detailed description of the regression analysis conducted in Section 4.4. We examine the relationship between the bilateral real exchange rate of the Ngultrum to the rupee, BRER(Nu/INR), and power exports in a time-series regression framework, building on Edwards (1986). Specifically, the following three issues are investigated: (i) whether the increased power export revenue has affected the changes in BRER(Nu/INR);
(ii) what other variables have affected BRER(Nu/INR); and (iii) through what channels power exports have influenced BRER(Nu/INR).
a. The Model
BRER Dynamics
The modern analyses of real exchange rate behavior distinguish between fundamentals and monetary determinants of BRERs. This distinction is captured empirically by
( log log ) ( log log ) ,
log e
t= θ e
t*− e
t 1− ρ M
ts1− M
td1+ φ DEV
t∆
− − −(A1)
where e* stands for the equilibrium level of BRER, e for the actual BRER, M
t-1sfor the money supply in period t-1, M
t-1dfor the money demand in t-1, and DEV for the nominal devaluation. θ, ρ and φ are positive parameters. In the case of BRER(Nu/INR), DEV
t= 0 for all t, since the nominal exchange rate of the Ngultrum against the rupee is unity.
In Eq. (A1), the observed changes in BRER (∆log e
t) are the result of
two forces: θ(log e
t*– log e
t-1) and – ρ(logM
t-1s– logM
t-1d). The first
term, θ(log e
t*– log e
t-1), is a partial adjustment in response to
discrepancies between the equilibrium BRER, log e
*, and its lagged
actual value. If the equilibrium BRER is above (below) its actual
value, BRER will increase (decrease) accordingly towards its
equilibrium level. The speed of the adjustment will depend on the
parameter θ. In the case of an overvaluation (e
*> e), the adjustment will be rather slow because an “automatic” decline in e will normally require a drop in the nominal price of non-tradables and wages. To the extent that nominal prices show some degree of downward resistance, the adjustment will take time.
The second term, -ρ(logM
t-1s– logM
t-1d), captures the impact of a monetary disequilibrium on BRER and indicates that monetary pressures will cause real appreciation of BRER (∆log e
t< 0).
Empirically, this impact is given by coefficient ρ. If power exports and foreign aid inflows affect the money supply process, M
t-1s, BRER will be affected accordingly. This monetary channel would operate only in the short-run; in the long-run BRER responds only to changes in the real fundamentals.
Long-Run Equilibrium BRER
Equation (A1) suggests that to explain the behavior of the BRER (e), we need to understand the evolution of the equilibrium BRER (e*).
Without loss of generalization, the equilibrium BRER can be expressed in the following manner:
, log log
log log
log e
t*= λ
0+ λ
1P
tp+ λ
2V
tP+ λ
3G
tN+ λ
4NFA
t+ λ
5τ
t(A2)
where P
t pis the real power tariff, V
t pis the volume of power exports, G
tNis the government expenditure on non-tradable goods, NFA
tis net foreign aid inflows, and τ
tis the measure of import tariffs all for period t. Since there exist no trade restrictions between Bhutan and India, τ
t= 0 for all t. The coefficients λ
1, λ
2, λ
3and λ
4are expected to be negative. The effects of changes in the fundamentals on the equilibrium BRER are explained below.
Real price of power (P
t p). An increase in the tariff will raise
disposable income, which in turn is expected to increase
expenditure through the income effect, raising the relative price of
non-tradables.
24
This effect, however, is expected to be smaller in Bhutan. Since the power company is a public sector undertaking, most of the export earnings will benefit the Government in the form of an increase in the surplus transfer, corporate tax and dividend. If higher government revenue leads to increased government expenditure on non-tradables, a significant proportion of a Dutch-condition effect is expected to take place via changes in government expenditure, a channel captured by log G
tN.
Also, a direct power price effect is also expected to take place since a tariff increase may generate a positive “confident effect” on consumers, affecting aggregate expenditure. Vaey-Zadesh (1989) makes this point using a model based on a “warehouse” approach to oil exploitation.
Volume of power exports (V
t). For similar reasons, an increase in the volume of power exported to India is expected to result in real appreciation.
Government expenditure on non-tradables (G
tN). Higher power export is expected to increase government expenditure significantly through the income effect. The dependence of G
tNon power exports would then constitute an indirect but predominant channel through which the power exports affect BRER. An increase in government expenditure on non-tradables will raise their relative prices, causing real appreciation.
Net Foreign Aid Inflows (NFA
t). Higher aid inflows are expected to raise aggregate spending through the income effect. If a higher proportion is spent on non-tradable goods, the relative price of non- tradables will rise, leading to real appreciation.
Specification for Econometric Analysis
Combining Eqs. (A1) and (A2) yields the following equation for the
dynamics of BRER, which can be estimated using conventional
methods:
( log log ) , log
log
log log
log log
1 1
1 5
4
3 2
1 0
d t s t
t t
t
tN tP
tP t
M M
e NFA
G Z
P e
ε ρ
σ σ
σ σ
σ σ
+
−
− +
+
+ +
+
=
−
−
−
(A3) where
0
;
0
θλ
σ = σ
1= θλ
1; σ
2= θλ
2; σ
3= θλ
3; σ
4= θλ
4;
( θ )
σ
5= 1 − and ε is an error term.
In Eq. (A3), there are at least four channels through which power exports can impact BRER. The first channel is disposable income, which is captured by coefficients σ
1and σ
2. The second channel is changes in government expenditures, G
tNt, captured by coefficient σ
3. Another channel is aid inflows, NFA
t, captured by coefficient σ
4. The fourth channel relates to the monetary disequilibrium, which is of short-term in nature, and is captured by ρ.
One problem of estimating Eq. (A3) is the multicollinearity problem among the regressors. While no multicollinearity problem is found among P
t p, V
t p, NFA
tand the monetary variables, there appears to be significant collinearity between G
tNand NFA
tand M
tsand NFA
t, i.e., government expenditure on non-tradables and magnitude of monetary disequilibrium are significantly influenced by the level of foreign aid inflows. To address this, regressor NFA
tis dropped from our specification.
b. Regression Analysis
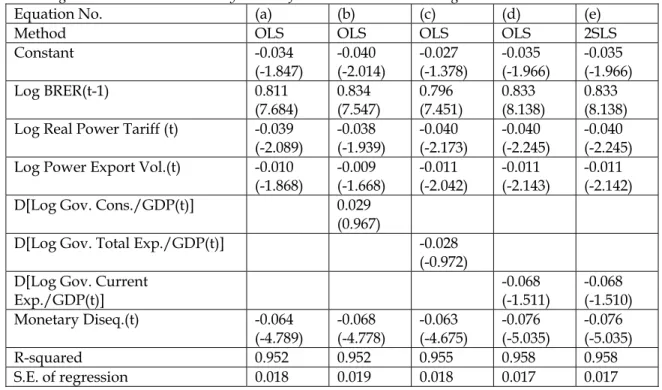
We estimate Eq. (A3) and its variations using annual data for the period of 1983-2002. Description of variables and data sources are provided in Section A.4.
From the augmented Dickey-Fuller test, it appears that all variables,
except government consumption and total government
expenditure, are I(0). The time series of government consumption
and total government expenditure exhibit I(1). To get around this
problem, the first difference of these variables is used in the
26
regression specification so that OLS and 2SLS are consistent. The results are presented in Table A1.
The results support the hypothesis that in the short run the BRER movements in Bhutan have responded to both the real and monetary factors. First, there is an important relationship between power exports and the exchange rate of the Ngultrum against the rupee. Specifically, changes in the power tariff (P
t p) and volume of power exports (V
t p) are significantly associated with the path of the real exchange rate. In all regressions, the coefficients of the log of the real power tariff and the volume of power exports are negative as expected, and are statistically significant, implying that future increases in either variables will likely cause further real appreciation of the Ngultrum. A formal test of the equality of the coefficients of these two variables, Wald test, rejects the null hypothesis that σ
1= σ
2.
According to Eq. (d), a one percent increase in the real power tariff will cause a 0.04 percent decline in BRER
t(Nu/INR), or real appreciation of 0.04 percent. Similarly, an increase in the volume of power exports by one percent will lead to a 0.011 percent real appreciation. According to this result, the commissioning of the Tala project, which is expected to triple Bhutan’s export capacity, will lead to a 3.3 percent real appreciation.
Second, the results suggest that the real exchange rate also responds significantly to the monetary disequilibrium term, (logM
t-1s– logM
t- 1d). The coefficient of monetary disequilibrium shows a negative sign, as expected, and the t-statistics indicate that the estimates are significant. As we discussed earlier, the increase in money supply in Bhutan has been affected by both aid inflows and power export revenue. According to Eq. (d), a one percent increase in monetary disequilibrium will lead to a 0.076 percent real appreciation.
Changes in government expenditure do not appear to have had a significant impact on the level of BRER. None of the variables—
government consumption, current expenditure nor total
government expenditure scaled by GDP—is significantly correlated
with BRER. The sign of the coefficient is even wrong for government consumption in Eq. (b).
A possible explanation is that a large proportion of aggregate spending came from the private sector. That is, much of government spending may have been directed towards tradables rather than non-tradables. There is also a possibility that neither government consumption, current expenditure nor total expenditure is a good proxy for government expenditure on non- tradables.
This regression analysis needs to be interpreted with caution due to a few limitations, however, and should not be used to draw a solid conclusion. First, the WPI/CPI-based BRER is an imperfect measure of the real exchange rate due to limited statistical capacity of of Bhutan. Second, the number of observations is small for this type of time-series analysis due to limited data availability. Third, some of the independent variables can be measured with error.
Additionally, some of them are potentially endogenous. To address issue, instrumental variables (2SLS) are also used in Eq. (e).
However, the 2SLS results do not differ significantly from the OLS results, suggesting absence of endogeneity. Fourth, the BRER equation does not incorporate explicitly the role of expectations about the behavior of power exports. In principle, expected changes in power exports will affect BRER by influencing domestic spending. Nevertheless, this issue is not addressed in this analysis because of the difficulties in finding a satisfactory proxy for expectations.
c. Conclusions
In summary, the path of the real exchange rate of the Ngultrum has
been significantly influenced by power exports and monetary
disequilibrium. The econometric analysis indicates an important
relationship between power exports and the real exchange rate of
the Ngultrum. Specifically, increases in the real power tariff and the
volume of power export have been associated with real appreciation
of the Ngultrum, suggesting that future increases in real power
exports will likely cause further appreciation of the Ngultrum.
28
Besides, the bilateral exchange rate of the Ngultrum has responded strongly to the monetary disequilibrium term. If increased aid inflows—regardless of what they are denominated in—and power exports continue to strengthen the balance of payments position with a corresponding increase in international reserves, without full sterilization money supply could increase beyond the demand for money. A short-term monetary disequilibrium would prevail, leading to further real appreciation of the Ngultrum. However, the results indicate that changes in government expenditures did not have significant bearing on the level of BRER.
d. Definition of Variables and Data Source
The study requires annual data of various macroeconomic indicators as well as the information on power exports to India for 1983-2002. The definition of variables and their data sources are provided below.
Real power tariff. This is the nominal power tariff deflated by the Indian WPI. Data on the nominal tariff are provided by the Bhutanese authorities.
Volume of power exports. Power exports to India in mega units (MU). Data are provided by the Bhutanese authorities.
Government expenditure on non-tradables. This is a difficult variable to measure since disaggregated data on government expenditure are not available in Bhutan. Three proxies are used in this analysis: (i) government consumption expenditure; (ii) government total expenditure; and (iii) government current expenditure, all in percent of GDP. Data on government consumption are taken from the IMF IFS database, while data on total and current expenditures are taken from various issues of Statistical Yearbook of Bhutan published by the Bhutan Central Statistical Organization.
Monetary disequilibrium. This is the difference between the log of
money (M1) and the estimated log of the long-run demand for
money, calculated using the estimated parameters obtained from a demand for money equation, ( M P )
dt= β
1y
tβ2exp ( − β
3i
t) .
22
The estimated money demand equation for Bhutan is ,
09 . 0 ln 44 . 1 9 . 14
ln m
td= − y
t= i
twhere m
tdis real money demand, y
treal income and i
tthe inflation rate for time t. Since all variables are I(1),
the Johansen cointegration test is employed to estimate the money demand
equation.
30
References
Bruno, M. and J. Sachs (1982), ‘Energy and Resource Allocation: A Dynamic Model of the Dutch Disease’, Review of Economic Studies, 49, 845--859.
Buiter, W. and D. Purvis (1983), ‘Oil, Disinflation and Export Competitiveness’, in J. Bhandari and B. Putnam (eds.), Economic Interdependence and Flexible Exchange Rates, (Cambridge, MA, MIT Press)
Corden, W. M (1984), ‘Booming Sector and Dutch Disease Economics:
Survey and Consolidation’, Oxford Economic Papers, 36, 359-- 380.
Corden, W. M. and J. P. Neary (1982), ‘Booming Sector and De- industrialization in a Small Open Economy’, Economic Journal, 92, 825--848.
Eastwood, R. K. and A. J. Venables (1982), ‘The Macroeconomic Implications of a Resource Discovery in an Open Economy’, Economic Journal, 92, 285-299.
Edwards, S. (1984), ‘Coffee, Money and Inflation in Colombia’, World Development, 12, 1107--1117.
Edwards, S. (1986), ‘A Commodity Export Boom and The Real Exchange Rate: The Money-Inflation Link’, in P. Neary and S.
van Wijnbergen (eds.), Natural Resources and the Macroeconomy (Cambridge, MA, MIT Press).
Fasano, U. (2000), ‘Review of the Experience with Oil Stabilization and Savings Funds in Selected Countries’, IMF Working Paper, WP/00/112.
Gelb, A. (1986), ‘Adjustment to Windfall Gains: a Comparative Analysis of Oil-exporting Countries’, in P. Neary and S. van Wijnbergen (eds.), Natural Resources and the Macroeconomy, (Cambridge, MA, MIT Press).
Harvey, C. (1992), ‘Botswana: Is the Economic Miracle Over?’ Journal of African Economies, 1,335--368.
Neary, J. P. and S. van Wijnbergen (1984), ‘Can an Oil Discovery Lead to a Recession? A comment on Eastwood and Venables’, Economic Journal, 94, 390--395.
Neary, J. P. and S. van Wijnbergen (1986), Natural Resource and the
Macroeconomy, (Oxford, UK, Basil Blackwell).
Pinto, B.(1987), ‘Nigeria During and After the Oil Boom: A Policy Comparison with Indonesia’, World Bank Economic Review, 1, 419--445.
Vaey-Zadeh (1989), ‘Oil Wealth and Economic Behavior: The Case of Venezuela, 1965-81’, IMF Staff Papers, 36, 343--384.
van Wijnbergen, S. (1984), ‘Inflation, Employment and the Dutch Disease in Oil-exporting Countries: A Short-run Disequilibrium Analysis’, Quarterly Journal of Economics, 99, 233--250.
World Bank (2000), Country Assistance Strategy for Bhutan, Report No.
20158BHU.
World Bank (2005), ‘A Better Investment Climate for Everyone’, World
Development Report 2005.
32
Figure 1. Bhutan: Power Exports (in percent of total exports, GDP)
0 10 20 30 40 50 60
19 85 19 86
19 87 19 88
19 89 19 90
19 91 19 92
19 93 19 94
19 95 19 96
19 97 19 98
19 99 20 00
20 01 20 02
% of total exports
0 5 10 15
% of GDP
% of total exports (left scale)
% of GDP (right scale)
Source: RMA Annual Reports (various issues)
Figure 2. Bhutan: Net Capital Inflows from India and Power Export Revenues (in percent of GDP)
0 10 20 30 40 50
1980 1982
1984 1986
1988 1990
1992 1994
1996 1998
2000 2002
% o f GDP
Net catpial flows from India 1/
Power exports
Source: RMA Annual Reports (various issues)
1/ Consists of concessional loans and grants
34
Figure 3. Bhutan: Government Revenue and Power Exports (in percent of GDP)
0 5 10 15 20
1981 1982
1983 1984
1985 1986
1987 1988
1989 1990
1991 1992
1993 1994
1995 1996
1997 1998
1999 2000
2001 2002
% of GDP
Tax revenue Non-tax revenue
Power exports
Source: RMA Annual Reports (various issues)
Figure 4. Bhutan: Bilateral Real Exchange Rates 1/
7 8 9 10 11 12 13
1980 1981
1982 1983
1984 1985
1986 1987
1988 1989
1990 1991
1992 1993
1994 1995
1996 1997
1998 1999
2000 2001
2002
BRER(Nu/US$)
0.6 0.8 1.0
BRER(Nu/INR)
B R ER (N u/U S$) (left scale)
B R E R (N u/IN R ) (right scale) A ppreciation
D epreciation
Source: RMA Annual Report, IMF International Financial Statistics and World Bank staff estimates.
1/ The bilateral real exchange rates are calculated using CPI and WPI (base year = 1980).
36
Figure 5. Bhutan: BRER(Nu/INR) and Power Exports to India (at 1980 prices in millions of Ngultrum)
0.8 0.9 1.0 1.1 1.2 1.3
1980 1981
1982 1983
1984 1985
1986 1987
1988 1989
1990 1991
1992 1993
1994 1995
1996 1997
1998 1999
2000 2001
2002
BRER (Nu/INR)
0 100 200 300 400
Millions of Nu (in 1980 prices)
Real power exports to India (right scale) BRER(Nu/INR)
(left scale)
Source: Data provided by the authorities, IMF IFS and the author’s estimates
Figure 6. Bhutan: Composition of Absorption (in percent of non-power GDP)
0 1 2 3 4 5 6 7 8 9 10
19 80 19 81
19 82 19 83
19 84 19 85
19 86 19 87
19 88 19 89
19 90 19 91
19 92 19 93
19 94 19 95
19 96 19 97
19 98 19 99
20 00 20 01 Private consumption
Public consumption Investment
Source: IMF IFS and the author’s estimates.
38
Figure 7. Bhutan: Components of GDP (value added, at 1980 prices in millions of Ngultrum)
0 200 400 600 800 1,000 1,200 1,400 1,600
1980 1982
1984 1986
1988 1990
1992 1994
1996 1998
2000 2002
Millions of Ngultrum (in 1980 prices)
Agriculture Mining Manufacturing Electricity
Construction Services Government
Source: RMA annual reports (various issues) and the author’s estimates
Figure 8. Bhutan: Components of GDP (value added, in percent of non-power GDP)
0 10 20 30 40 50 60
1980 1982
1984 1986
1988 1990
1992 1994
1996 1998
2000 2002
Agriculture Mining Manufacturing
Construction Services Government
Source: RMA annual reports (various issues) and the author’s estimates
40
Figure 9. Bhutan: Real Exports and Real Non-power Exports to India (at 1980 prices in millions of Ngultrum)
0 500 1,000 1,500 2,000 2,500
1980 1982
1984 1986
1988 1990
1992 1994
1996 1998
2000 2002
Millions of Ngultrum (in 1980 prices)
Real exports
Real non-power exports