Simulation of soil water balance on the North China Plain:
a case study at Luancheng
Yongqiang Zhang, Martin Wegehenkel Department of Landscape System Analysis
Leibniz-Centre for Agricultural Landscape Research (ZALF) e. V. Müncheberg D-15374 Müncheberg, Germany
Eberswalder Strasse 84 zhang@zalf.de mwegehenkel@zalf.de
Abstract: Water shortage is a serious constraint on crop production on the North China Plain (NCP), where cropland is mainly irrigated by pumping groundwater from alluvial aquifers. To develop a sustainable ground water and irrigation mana- gement strategy, we developed a three-layer soil water balance model which is easy to use, robust, but physically based simulation tool. The model successfully simulated soil moisture contents, crop evapotranspiration, and deep percolation in comparison with experimental results obtained from Luancheng Agricultural Eco- ecosystem Station on the plain.
1 Introduction on the North China Plain
North China Plain (NCP), with an area of 350, 000 km2, is one of the most important centers of agricultural production in China, a growing region of industrial production, home to more than 200 million people, and the seat of the nation’s capital. Water shortage for agriculture alone is very severe on the plain. The most important reason is that precipitation can not meet the requirement of crop growth. The average yearly rainfall is about 400-600 mm, a majority of which comes in summer. Totally, crop annual evapotranspiration (ET) is about 800-900 mm, which greatly exceeds the annual rainfall [LZZ02]. Until now, excessive irrigation is normally carried out by NCP farmers who are focusing on achieving high crop production [Zh02]. This is due to the fact that water price for agricultural irrigation is very low in China. Now, the authorities are adopting several methods to save groundwater on the NCP. But, one of basic agricultural water management issues is not so clear for the authorities. That is how irrigated or precipitation water is distributed in the soil-plant-atmosphere continuum on the plain.
For a sustainable groundwater resources management, it is crucial to correctly quantify crop actual evapotranspiration (ETa), soil water content, and groundwater recharge in irrigated cropland to optimize the irrigation procedures. For this quantification, it needs a precise, physically based and easy to use modelling approach.
325
In this study, the main objectives were to develop an easily operated three-layer soil water balance (SWB) model in which soil water flux approach is based on a published work [Ke03], to accurately simulate soil water contents, crop ETa and deep soil percolation. This new developed model was validated with data dealing with the long- term dynamics of soil water content in the root zone layer and crop ETa
2 Material and methods
2.1 The three-layer soil water balance model
In the three-layer soil water balance model, evapotranspiration is divided into soil evaporation and crop transpiration by a dual crop coefficient method; soil water move- ment in soil is divided into saturate and unsaturated movement by a ‘tipping bucket’
routine. The maximum rooting depth of the crop growth is considered as the lower boundary of the soil reservoir. This reservoir is divided into three soil layers including (i) a surface active layer in which irrigation or precipitation is added, and soil evaporation, crop transpiration and drainage occur simultaneously, and (ii) a middle active soil layer in which the roots are mainly extended and from which both plant water uptake and water percolation downward occur, and (iii) a lowest passive soil layer from which only deep water percolation occurs.
The input data for the application of the three-layer SWB model include daily meteorological data, crop data, initial soil moisture data, and irrigation data.
Meteorological data consist of daily maximum temperature (˚C), daily minimum tempe- rature, daily mean wind speed (m/s), daily sunshine durations (hours), daily mean rela- tive humidity (%), daily precipitation (mm/d). Crop data include crop height (m) and root depth (mm). Finally, the soil physical parameters used by the model are saturated hydraulic conductivity (mm/d), saturated soil water content (cm3/cm3), field capacity (cm3/cm3), and wilting point (cm3/cm3).
The outputs of the model include volumetric soil water contents (cm3/cm3) in the three soil layers, soil water storage in the three soil layers (mm), soil evaporation (mm/d), crop transpiration (mm/d), and percolation from the bottom of the passive soil layer (mm/d).
2.2 Experimental site
The experiment for the calibration and validation of the SWB model was conducted at Luancheng Agro-ecosystem station (37°53′N, 114°41′E, a. s. l. 50.1m), one of 34 eco- system stations of Chinese Ecological Research Network (Figure1) with fertile topsoil and plenty of organic matter in loam soil [Zh02]. It is located a temperate semi-arid monsoon climate, with a mean annual temperature of 12.2℃, mean annual global radi- ation of 524 kJ/cm2, and mean annual precipitation rate of 481mm, which occurs mostly from late June to September. Winter wheat and maize is the main crop rotation system.
326
Growing season of winter wheat is from early December to mid-June, and for maize from early-June to later September. Rainfall does not meet the need of wheat for its normal growth, especially during the dry, windy spring season. Therefore, 5 to 6 irrigations are needed to maintain high Yields. During summer, rainfall is usually adequate for the water consumption of maize, though 2 to 3 irrigations may be needed in a dry year. Large quantities of groundwater are pumped for this purpose. As a result, the ground water table at the station has fallen over 20 m in recent 30 years. The Climate data for the time period 1998-2003 were measured at a meteorological observation site at the station. The rooting depths of winter wheat and maize were regarded as a function of the number of days since planting. The actual ET-rates were measured by a large scale weighing lysimeter. Three normally irrigated plots were used to validate the soil moisture content simulation, where soil moisture contents for each plot were measured by a neutron probe (Institute of Hydrology, UK) approximately every 5 days at nine to ten depth intervals between 0 and 180 cm depth for the time period 1998-2003.
Figure 1: The geographic location of North China Plain and Luancheng County
3 Validation of soil water contents
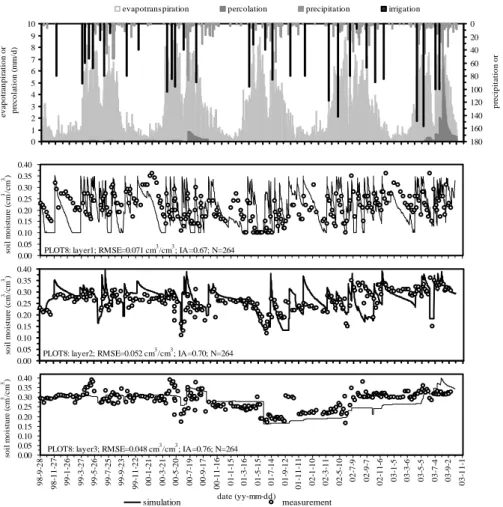
The simulated soil water contents were compared with the measured ones in a normally irrigated plot (Figure 2). The root mean square errors obtained from the comparison of measured with simulated soil water contents were within 0.048-0.072 cm3/cm3 for the three soil layers. This indicates a sufficient simulation quality.
327
0.00 0.05 0.10 0.15 0.20 0.25 0.30 0.35 0.40
soil moisture (cm3/cm3)
PLOT8: layer1; RMSE=0.071 cm3/cm3; IA=0.67; N=264
0.00 0.05 0.10 0.15 0.20 0.25 0.30 0.35 0.40
98-9-28 98-11-27 99-1-26 99-3-27 99-5-26 99-7-25 99-9-23 99-11-22 00-1-21 00-3-21 00-5-20 00-7-19 00-9-17 00-11-16 01-1-15 01-3-16 01-5-15 01-7-14 01-9-12 01-11-11 02-1-10 02-3-11 02-5-10 02-7-9 02-9-7 02-11-6 03-1-5 03-3-6 03-5-5 03-7-4 03-9-2 03-11-1
date (yy-mm-dd) soil moisture (cm3/cm3)
simulation measurement
PLOT8: layer3; RMSE=0.048 cm3/cm3; IA=0.76; N=264 0.00
0.05 0.10 0.15 0.20 0.25 0.30 0.35 0.40
soil moisture (cm3/cm3)
PLOT8: layer2; RMSE=0.052 cm3/cm3; IA=0.70; N=264 0
1 2 3 4 5 6 7 8 9 10
evapotranpiration or precolation (mm/d)
0 20 40 60 80 100 120 140 160 180
precipitation or irrigation (mm/d) evapotranspiration percolation precipitation irrigation
Figure 2: Seasonal dynamics of measured and simulated soil water content (cm3/cm3), evapotranspiration, deep soil percolation, precipitation and irrigation at a irrigated plot.. RMSE=
root mean square error. IA = modeling efficiency index. N = sampling number.
References
[Ke03] Kendy, E.; Gerard-Marchant, P.; Walter, M.T.; Zhang, Y.Q., Liu, C.M.; Steenhuis, T.S.: A soil-water-balance approach to quantify groundwater recharge from irrigated cropland in the North China Plain. Hydrological Processes, 17(10), 2003; 2011-2031.
[LZZ02] Liu, C.M.; Zhang, X.Y.; Zhang, Y.Q.: Determination of daily evaporation and evapotranspiration of winter wheat and maize by large-scale weighing lysimeter and micro-lysimeter. Agricultural And Forest Meteorology, 111(2), 2002; 109-120.
[Zh02] Zhang, Y.Q.; Liu, C.M.; Shen, Y.J.; Kondoh, A.; Tang, C.Y.; Tanaka, T.; Shimada, J.:
Measurement of evapotranspiration in a winter wheat field. Hydrological Processes, 16(14), 2002; 2805-2817.
328