Supplemental material
Seasonal variations of Fucus vesiculosus fertility under ocean acidification and warming in the western Baltic Sea
Angelika Graiff, Marie Dankworth, Martin Wahl, Ulf Karsten and Inka Bartsch DOI 10.1515/bot-2016-0081
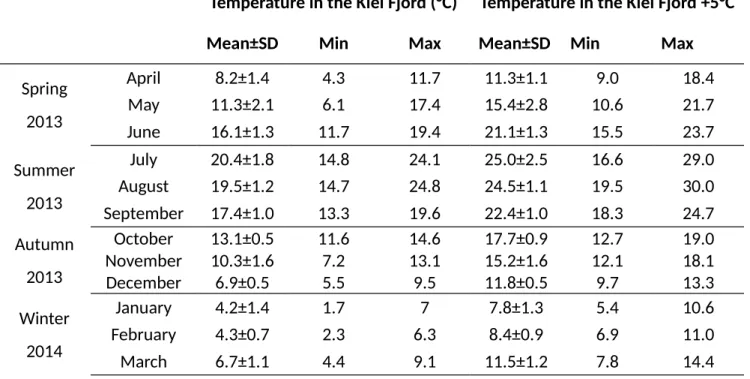
Table S1: Mean, minimum, and maximum Benthocosm temperatures in each month.
Temperature in the Kiel Fjord (°C) Temperature in the Kiel Fjord +5°C
Mean±SD Min Max Mean±SD Min Max
Spring 2013
April 8.2±1.4 4.3 11.7 11.3±1.1 9.0 18.4
May 11.3±2.1 6.1 17.4 15.4±2.8 10.6 21.7
June 16.1±1.3 11.7 19.4 21.1±1.3 15.5 23.7
Summer 2013
July 20.4±1.8 14.8 24.1 25.0±2.5 16.6 29.0
August 19.5±1.2 14.7 24.8 24.5±1.1 19.5 30.0
September 17.4±1.0 13.3 19.6 22.4±1.0 18.3 24.7
Autumn 2013
October 13.1±0.5 11.6 14.6 17.7±0.9 12.7 19.0
November 10.3±1.6 7.2 13.1 15.2±1.6 12.1 18.1
December 6.9±0.5 5.5 9.5 11.8±0.5 9.7 13.3
Winter 2014
January 4.2±1.4 1.7 7 7.8±1.3 5.4 10.6
February 4.3±0.7 2.3 6.3 8.4±0.9 6.9 11.0
March 6.7±1.1 4.4 9.1 11.5±1.2 7.8 14.4
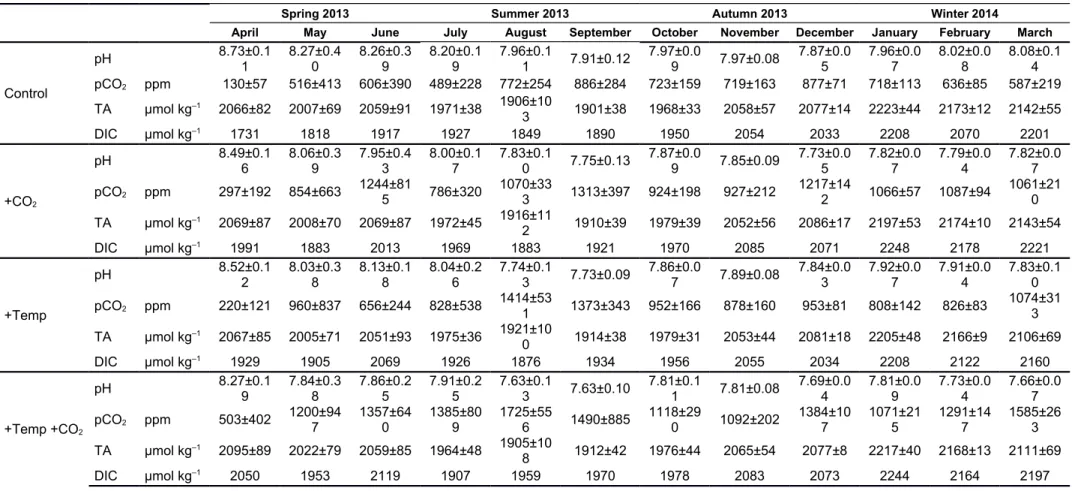
Table S2: Summary of mean monthly seawater carbonate chemistry. pCO2 (n = 3, ± SD) was calculated from total alkalinity (TA, n = 3), dissolved organic carbon (DIC, n = 3) and pH (n = 3) measurements of seawater corresponding to each treatment (Wahl et al. 2015b, M. Böttcher and V.
Winde pers. comm.).
Spring 2013 Summer 2013 Autumn 2013 Winter 2014
April May June July August September October November December January February March
Control
pH 8.73±0.1
1 8.27±0.4
0 8.26±0.3
9 8.20±0.1
9 7.96±0.1
1 7.91±0.12 7.97±0.0
9 7.97±0.08 7.87±0.0
5 7.96±0.0
7 8.02±0.0
8 8.08±0.1 4 pCO2 ppm 130±57 516±413 606±390 489±228 772±254 886±284 723±159 719±163 877±71 718±113 636±85 587±219 TA µmol kg–1 2066±82 2007±69 2059±91 1971±38 1906±10
3 1901±38 1968±33 2058±57 2077±14 2223±44 2173±12 2142±55
DIC µmol kg–1 1731 1818 1917 1927 1849 1890 1950 2054 2033 2208 2070 2201
+CO2
pH 8.49±0.1
6 8.06±0.3
9 7.95±0.4
3 8.00±0.1
7 7.83±0.1
0 7.75±0.13 7.87±0.0
9 7.85±0.09 7.73±0.0
5 7.82±0.0
7 7.79±0.0
4 7.82±0.0 7 pCO2 ppm 297±192 854±663 1244±81
5 786±320 1070±33
3 1313±397 924±198 927±212 1217±14
2 1066±57 1087±94 1061±21 0 TA µmol kg–1 2069±87 2008±70 2069±87 1972±45 1916±11
2 1910±39 1979±39 2052±56 2086±17 2197±53 2174±10 2143±54
DIC µmol kg–1 1991 1883 2013 1969 1883 1921 1970 2085 2071 2248 2178 2221
+Temp
pH 8.52±0.1
2
8.03±0.3 8
8.13±0.1 8
8.04±0.2 6
7.74±0.1
3 7.73±0.09 7.86±0.0
7 7.89±0.08 7.84±0.0 3
7.92±0.0 7
7.91±0.0 4
7.83±0.1 0 pCO2 ppm 220±121 960±837 656±244 828±538 1414±53
1 1373±343 952±166 878±160 953±81 808±142 826±83 1074±31 3 TA µmol kg–1 2067±85 2005±71 2051±93 1975±36 1921±10
0 1914±38 1979±31 2053±44 2081±18 2205±48 2166±9 2106±69
DIC µmol kg–1 1929 1905 2069 1926 1876 1934 1956 2055 2034 2208 2122 2160
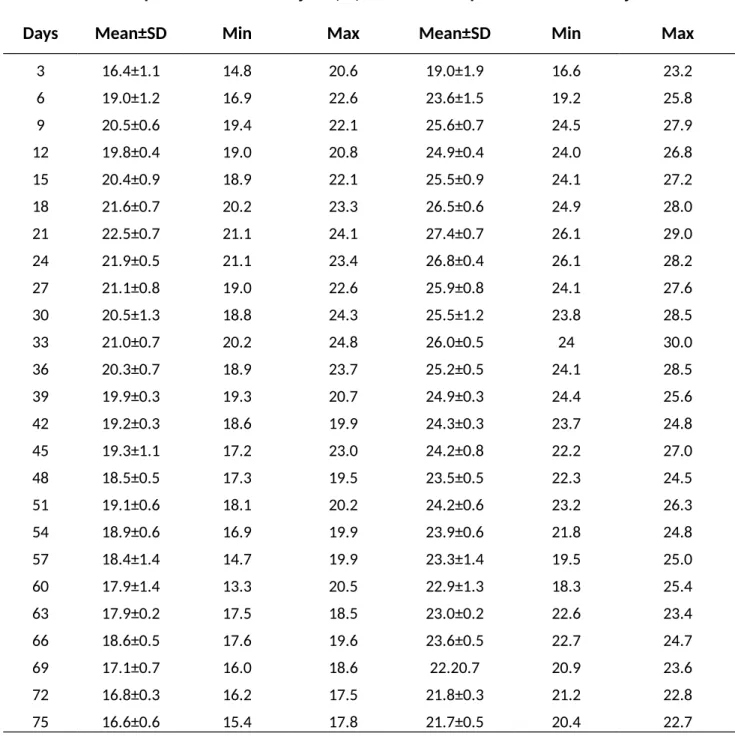
Table S3: Three-day mean, minimum, and maximum Benthocosm temperatures in the summer experiment (4 July-17 September 2013).
Temperature in the Kiel Fjord (°C) Temperature in the Kiel Fjord +5°C
Days Mean±SD Min Max Mean±SD Min Max
3 16.4±1.1 14.8 20.6 19.0±1.9 16.6 23.2
6 19.0±1.2 16.9 22.6 23.6±1.5 19.2 25.8
9 20.5±0.6 19.4 22.1 25.6±0.7 24.5 27.9
12 19.8±0.4 19.0 20.8 24.9±0.4 24.0 26.8
15 20.4±0.9 18.9 22.1 25.5±0.9 24.1 27.2
18 21.6±0.7 20.2 23.3 26.5±0.6 24.9 28.0
21 22.5±0.7 21.1 24.1 27.4±0.7 26.1 29.0
24 21.9±0.5 21.1 23.4 26.8±0.4 26.1 28.2
27 21.1±0.8 19.0 22.6 25.9±0.8 24.1 27.6
30 20.5±1.3 18.8 24.3 25.5±1.2 23.8 28.5
33 21.0±0.7 20.2 24.8 26.0±0.5 24 30.0
36 20.3±0.7 18.9 23.7 25.2±0.5 24.1 28.5
39 19.9±0.3 19.3 20.7 24.9±0.3 24.4 25.6
42 19.2±0.3 18.6 19.9 24.3±0.3 23.7 24.8
45 19.3±1.1 17.2 23.0 24.2±0.8 22.2 27.0
48 18.5±0.5 17.3 19.5 23.5±0.5 22.3 24.5
51 19.1±0.6 18.1 20.2 24.2±0.6 23.2 26.3
54 18.9±0.6 16.9 19.9 23.9±0.6 21.8 24.8
57 18.4±1.4 14.7 19.9 23.3±1.4 19.5 25.0
60 17.9±1.4 13.3 20.5 22.9±1.3 18.3 25.4
63 17.9±0.2 17.5 18.5 23.0±0.2 22.6 23.4
66 18.6±0.5 17.6 19.6 23.6±0.5 22.7 24.7
69 17.1±0.7 16.0 18.6 22.20.7 20.9 23.6
72 16.8±0.3 16.2 17.5 21.8±0.3 21.2 22.8
75 16.6±0.6 15.4 17.8 21.7±0.5 20.4 22.7
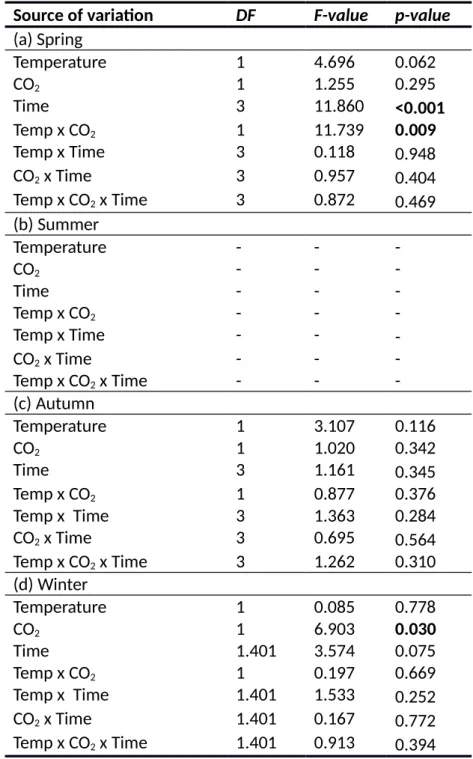
Table S4: Results of repeated-measures ANOVA for effects of temperature, CO2 and time during the course of each experiment on proportion of mature Fucus vesiculosus receptacles during different seasons.
Source of variation DF F-value p-value (a) Spring
Temperature 1 4.696 0.062
CO2 1 1.255 0.295
Time 3 11.860 <0.001
Temp x CO2 1 11.739 0.009
Temp x Time 3 0.118 0.948
CO2 x Time 3 0.957 0.404
Temp x CO2 x Time 3 0.872 0.469 (b) Summer
Temperature - - -
CO2 - - -
Time - - -
Temp x CO2 - - -
Temp x Time - - -
CO2 x Time - - -
Temp x CO2 x Time - - -
(c) Autumn
Temperature 1 3.107 0.116
CO2 1 1.020 0.342
Time 3 1.161 0.345
Temp x CO2 1 0.877 0.376
Temp x Time 3 1.363 0.284
CO2 x Time 3 0.695 0.564
Temp x CO2 x Time 3 1.262 0.310 (d) Winter
Temperature 1 0.085 0.778
CO2 1 6.903 0.030
Time 1.401 3.574 0.075
Temp x CO2 1 0.197 0.669
Temp x Time 1.401 1.533 0.252
CO x Time 1.401 0.167
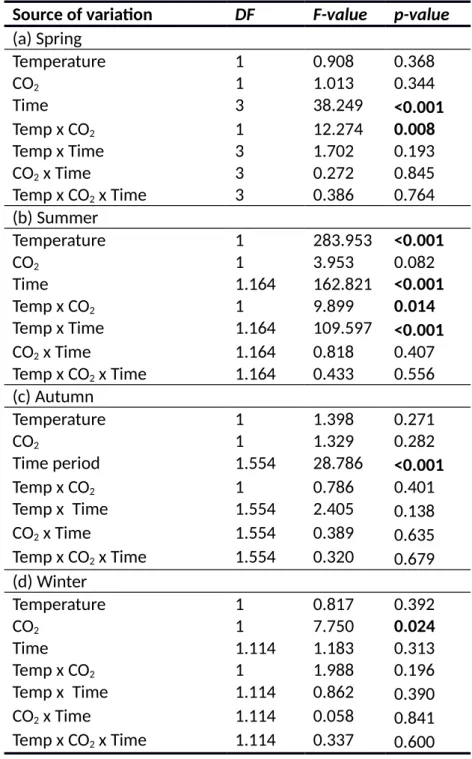
Table S5: Results of repeated-measures ANOVA for effects of temperature, CO2 and time during the course of each experiment on proportion of vegetative Fucus vesiculosus apices during different seasons.
Seasons: spring: 4 April-19 June 2013; summer: 4 July-17 September 2013; autumn: 10 October-18 December 2013; winter: 16 January-1 April 2014. Bold type indicates p-values <
0.05.
Source of variation DF F-value p-value (a) Spring
Temperature 1 0.908 0.368
CO2 1 1.013 0.344
Time 3 38.249 <0.001
Temp x CO2 1 12.274 0.008
Temp x Time 3 1.702 0.193
CO2 x Time 3 0.272 0.845
Temp x CO2 x Time 3 0.386 0.764 (b) Summer
Temperature 1 283.953 <0.001
CO2 1 3.953 0.082
Time 1.164 162.821 <0.001
Temp x CO2 1 9.899 0.014
Temp x Time 1.164 109.597 <0.001
CO2 x Time 1.164 0.818 0.407
Temp x CO2 x Time 1.164 0.433 0.556 (c) Autumn
Temperature 1 1.398 0.271
CO2 1 1.329 0.282
Time period 1.554 28.786 <0.001
Temp x CO2 1 0.786 0.401
Temp x Time 1.554 2.405 0.138
CO2 x Time 1.554 0.389 0.635
Temp x CO2 x Time 1.554 0.320 0.679 (d) Winter
Temperature 1 0.817 0.392
CO2 1 7.750 0.024
Time 1.114 1.183 0.313
Temp x CO2 1 1.988 0.196
Temp x Time 1.114 0.862 0.390
CO2 x Time 1.114 0.058 0.841
Temp x CO2 x Time 1.114 0.337 0.600
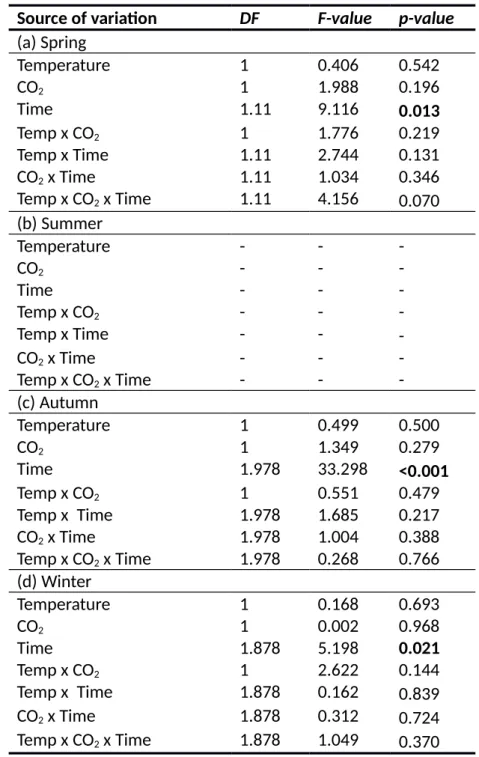
Table S6: Results of repeated-measures ANOVA for effects of temperature, CO2 and time during the course of each experiment on proportion of immature Fucus vesiculosus
receptacles during different seasons.
Source of variation DF F-value p-value (a) Spring
Temperature 1 0.406 0.542
CO2 1 1.988 0.196
Time 1.11 9.116 0.013
Temp x CO2 1 1.776 0.219
Temp x Time 1.11 2.744 0.131
CO2 x Time 1.11 1.034 0.346
Temp x CO2 x Time 1.11 4.156 0.070 (b) Summer
Temperature - - -
CO2 - - -
Time - - -
Temp x CO2 - - -
Temp x Time - - -
CO2 x Time - - -
Temp x CO2 x Time - - -
(c) Autumn
Temperature 1 0.499 0.500
CO2 1 1.349 0.279
Time 1.978 33.298 <0.001
Temp x CO2 1 0.551 0.479
Temp x Time 1.978 1.685 0.217
CO2 x Time 1.978 1.004 0.388
Temp x CO2 x Time 1.978 0.268 0.766 (d) Winter
Temperature 1 0.168 0.693
CO2 1 0.002 0.968
Time 1.878 5.198 0.021
Temp x CO2 1 2.622 0.144
Temp x Time 1.878 0.162 0.839
CO x Time 1.878 0.312 0.724
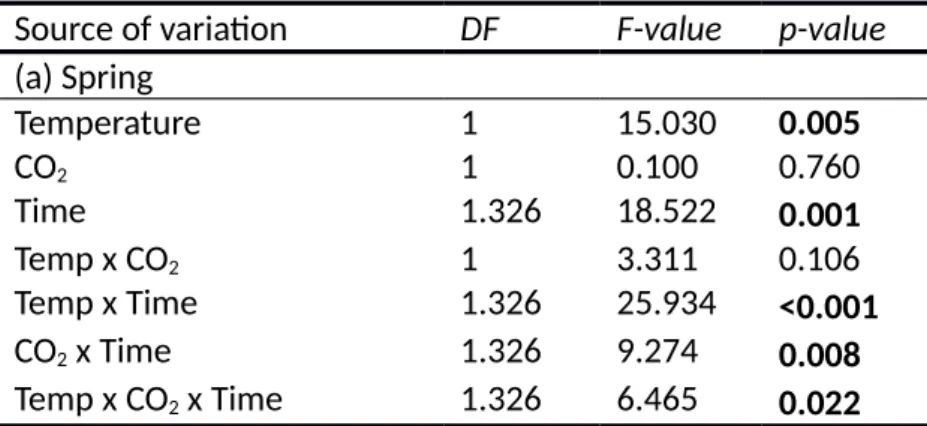
Table S7: Results of repeated-measures ANOVA for effects of temperature, CO2 and time during the course of each experiment on proportion of decayed Fucus vesiculosus receptacles during the spring experiment (4 April-19 June 2013).
During summer, autumn and winter experiments the proportion of decaying receptacles on the Fucus plants was too low for statistical analyses. Bold type indicates p-values < 0.05.
Source of variation DF F-value p-value (a) Spring
Temperature 1 15.030 0.005
CO2 1 0.100 0.760
Time 1.326 18.522 0.001
Temp x CO2 1 3.311 0.106
Temp x Time 1.326 25.934 <0.001
CO2 x Time 1.326 9.274 0.008
Temp x CO2 x Time 1.326 6.465 0.022