Abstract
We present results from the new electron bunch diagnostic tool, Optical Replica Synthesizer (ORS), installed at FLASH. The ORS produces an optical replica of the electron bunch profile, which is analyzed with a GRENOUILLE, a device based on the Frequency Resolved Optical Gating (FROG) technique. This optical replica is generated by inducing a microbunching in the electron bunch and letting it pass through an undulator, called a radiator. The radiator emits coherently at the wavelength of microbunching, 775 nm. In order to create the microbunching a laser pulse is spatially and temporally overlapped with the electron bunch in another undulator, placed before the radiator. This introduces an electron energy modulation which is transformed into a density modulation in a chicane before the microbunched electron bunch is sent into the radiator. We observed an optical replica pulse of approximately 5 μJ corresponding to an electron bunch-spike of about 150 fs FWHM when the accelerator was set at optimal FEL conditions. We also showed that the ORS can run parasitically while maintaining SASE by steering the electron beam around the outcoupling mirror for the ORS pulses.
INTRODUCTION
An accurate characterization of the electron bunch is essential for a thorough understanding and optimization of the lasing of FELs. The recent development in accelerator technology has put increasingly higher demands on electron bunch diagnostic tools as shorter and shorter bunches, below 100 fs, are being produced. This has stimulated the creation of new high-resolution diagnostic instruments which are necessary for a reliable operation of ultrashort-pulse FELs such as FLASH [1], XFEL [2] and LCLS [3]. Examples of already existing techniques are transverse deflecting structures [4] and electro-optical sampling [5], which both allow single-shot visualization of the electron bunch profile on a sub-100 fs time scale.
The ORS is a new diagnostic method which was proposed by Saldin et al. [6] and is based on the idea of creating an optical replica of the electron bunch. Hence the task of diagnosing the electron bunch is transferred to the simpler task of measuring a light pulse, where one can
make use of already existing ultrafast optical measuring techniques. One such method which gives a full characterization of a light pulse, and is used in the ORS, is Frequency Resolved Optical Gating (FROG) [7]. The FROG technique measures a spectrogram in the time- frequency domain from which the exact electric field (amplitude and phase) can be determined using a 2D phase retrieval algorithm. The electric field of the optical replica light pulse is directly proportional to the electron beam current [6].
In order to generate the optical replica pulse a microbunched electron packet is sent through a radiator undulator. The microbunching is achieved by spatially and temporally overlapping a seed laser pulse with the electron bunch in a modulator undulator. This creates an energy modulation in the electron bunch, which is transformed into a density modulation at the wavelength of the seed laser, in a chicane consisting of four dipole magnets. When this microbunched electron packet is passed through the radiator undulator, it emits coherently at the microbunching wavelength of 775 nm. The radiator pulse is analyzed with a GRENOUILLE [8], which is a commercially available device based on the FROG technique.
In the initial measurements with the ORS presented here, which resulted in the first observation of the optical replica, we focussed on determining the temporal structure of the electron bunch at FLASH. However, the ORS is a versatile method that has the potential to be used for various purposes. For example it may be a useful tool for investigations of slice properties of the electron bunch, such as slice energy spread and slice emittance. These are important parameters for the operation of an X-ray FEL, which has high demands on quality of the electron beam, and in particular on the temporal dependence of the bunch characteristics. It would thus provide a complement to standard methods that only deliver the energy spread and projected emittance of the full bunch.
In this paper we will describe the ORS setup and measurement procedure, report the recent accomplishments and results as well as discuss other possible and verified applications of the ORS.
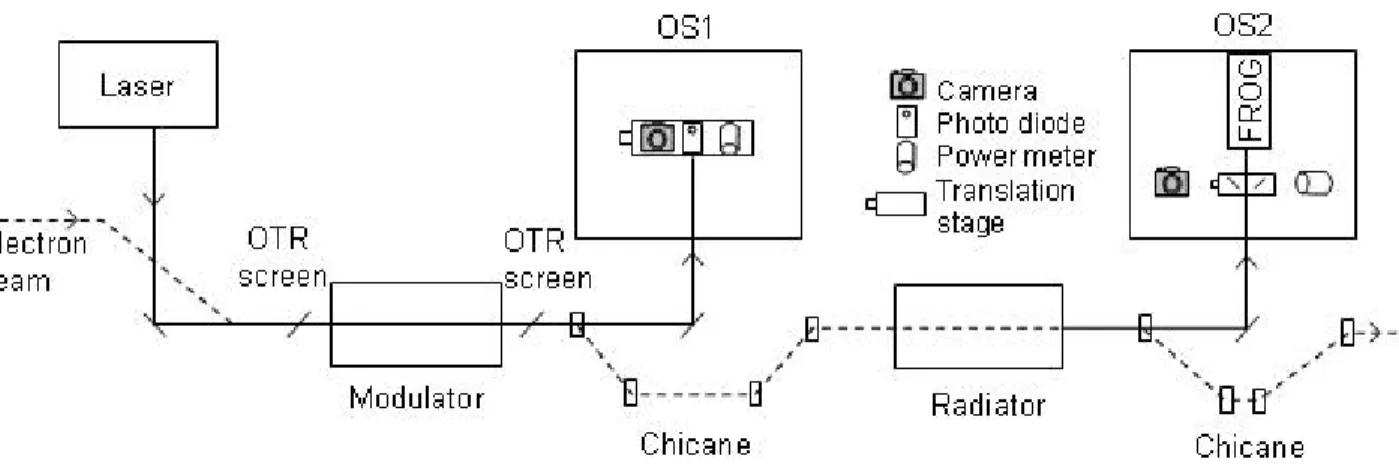
Figure 1: Schematic of the ORS set up.
EXPERIMENT Setup
Figure 1 gives a schematic overview of the ORS experiment, which was completely set up at FLASH during the summer of 2007. The laser system is installed in a separate building outside the tunnel. It consists of an Erbium-doped fiber oscillator [9] at 1550 nm which is frequency doubled and fed into a Ti:sapphire amplifier.
The fiber oscillator has a round-trip frequency of approximately 54 MHz and is phase-locked to the radio frequency (RF) signal of the accelerator. The 1550 nm beam from the oscillator is amplified in an additional fiber and subsequently frequency doubled in a 1 mm PPLN crystal before it is sent into, and used as a seed beam for, the Ti:sapphire amplifier. The amplifier is a Clark-MXR CPA-2001 Ti:sapphire laser system pumped by a Nd:YAG laser, based on regenerative, chirped-pulse amplification. It produces pulses of energy up to 0.8 mJ at a center wavelength of 775 nm and a spectral width of 6 nm full width at half maximum (FWHM). A compressor after the amplification stage allows for pulse length adjustment from 170 fs to 3 ps FWHM.
The oscillator is locked to the RF signal of FLASH by means of a piezo-electric crystal. The 1.3 GHz FLASH RF signal is compared to the 24th harmonic of the nominally 54 MHz round-trip frequency signal of the oscillator. The oscillator is considered “RF-locked” when, after appropriate scaling, the difference between the FLASH RF signal and the 24th harmonic equals zero. Part of the fiber of the oscillator is wound around this crystal and small changes in the fiber length can be accomplished by changing the voltage applied to the piezo-electric crystal. Any change in the length of the fiber will change the frequency and the phase of the 24th harmonic. A fast control program adjusts the voltage across the piezo- electric crystal in order to maintain RF-lock. In case fiber length adjustments are required that are beyond the range of the piezoelectric crystal, a mirror inside the oscillator cavity is moved by means of a micrometer delay stage.
Note that this does not affect the direction of the output of the oscillator which, instead, is solely determined by the fiber which is securely fastened to the oscillator
breadboard. By RF-locking the oscillator the entire laser system is synchronized to the electron bunch.
The YAG pump laser and the Pockels cell of the CPA- 2001 are triggered by a standard 5 V signal accompanying each macrobunch of FLASH at a repetition rate of 5 Hz.
Once RF-lock is obtained, the relative timing of the laser pulse and the electron bunch can be coarsely adjusted, up to a level of ca. 20 ns, by electronically changing the delay of this trigger signal. The operation of the CPA- 2001 is controlled by the settings of the accompanying Pockels cell controller, as usual, and synchronization is not affected by the passage of the oscillator pulse through the regenerative amplifier. The latter merely adds a (nearly) fixed amount of time, depending on the number of round trips inside the amplifier cavity.
The fine adjustment of the relative timing between the laser pulse and the electron bunch is controlled by a vector modulator. The vector modulator allows one to change the phase of the 1.3 GHz signal. Any change in the phase of the FLASH RF signal will lead to a rapid adjustment of the piezo-electric crystal in order to maintain RF-lock. As a result, the timing of the oscillator pulse is changed relative to the RF signal and hence to that of the electron bunch. Time steps as small as a few femtoseconds can be easily obtained.
The timing jitter between the RF signal and the laser pulse can be brought down to about 50 fs. The jitter between the FLASH RF system and the arrival time of the electron bunch is several hundred femtoseconds, depending on the settings of the accelerator as a whole. In total, the timing jitter between our laser pulse and the electron bunch is estimated to be on the order of 0.2 – 0.5 ps. It is important to note that we control the relative timing between the laser pulse and the electron bunch by purely electronic means. This should be compared to the more standard approach of using an optical delay stage for the laser pulse.
The laser pulse travels about 16 m to reach the accelerator via an optics station which contains motorized mirrors and a two-lens telescope. The telescope provides a laser waist of approximately 450 μm at the interaction region with the electron bunch inside the modulator. For diagnostic purposes the laser beam can be reflected back to the laser room in order to measure the beam waist and
consist of 5 periods + 2 correction periods each, with a period length of 0.2 m, and a maximum magnetic field of 0.45 T. The magnet gap is 40 mm in order to accommodate the 38 mm beam pipe. The chicane located between the undulators consists of four dipole magnets and produces an R56 of up to 300 μm.
The laser- and electron pulses need to overlap spatially and temporally in the modulator. Spatial, transversal overlap is achieved by aligning the laser beam to the centered flat electron beam, before and after the modulator, using two OTR (optical transition radiation) screens for the electrons and diffuse aluminum screens for the laser beam. The laser beam is extracted by a silver- coated silicon OTR-screen to optical station 1 (OS1), which is mainly used for monitoring the timing between the electron- and laser pulse. This is done by simultaneously observing the laser pulse and the spontaneous synchrotron radiation from the modulator, on a 1.5 GHz bandwidth photodiode connected to a 1 GHz oscilloscope. OS1 also contains a CCD camera and a power meter for diagnostic purposes. This mirror is also used for removing a large fraction of the seed laser beam from the vacuum accelerator tube.
The electrons proceed via the chicane, which transforms the electron energy modulation into a density modulation, to the radiator. The radiator emits coherently at the wavelength of density modulation, 775 nm, and the generated beam is coupled out by a silver-coated silicon OTR screen to optical station 2 (OS2). OS2 includes the GRENOUILLE (Swamp Optics 8-50-USB [8] with VideoFROG software [10]) for analyzing the optical replica pulse produced by the radiator. The ultrashort- laser-pulse measurement device exists in different models for various pulse length ranges. The 8-50-USB GRENOUILLE model is a triggered single-shot device that works in the range of 50 - 500 fs FWHM and has a temporal resolution of 17 fs. In order to reduce the beam diameter of the radiation and thus increase the intensity, a 4x gallilean telescope is placed before the GRENOUILLE. This results in a spot size of approximately 2 mm. The reduction of the beam diameter is important because the observed signal scales with the fourth power of the input diameter. The second, negative, lens of the telescope is adjustable in the beam direction in order to collimate the beam into the GRENOUILLE. A λ/2 plate in combination with a cubic polarizer allows for
mm in the region between the modulator and OS2. Then we register the transversal position of the electron beam on the two OTR screens before and after the modulator.
The transversal overlap between the electron- and laser beam is achieved by steering the laser beam to the same position as the electron beam on the OTR screens. The modulator is turned on in order to measure the temporal offset between the electron- and laser pulse, which is determined by simultaneous detection of the laser pulse and the spontaneous synchrotron radiation from the modulator, on a fast photodiode on OS1. The two peaks corresponding to the electron- and laser pulse can be observed on a fast oscilloscope and a vector modulator is used to temporally shift the laser pulse to within 100 ps of the electron bunch. While the synchrotron- and laser radiation is reflected to OS1, the chicane guides the electrons around the mirror and onto the OTR screen at OS2, and the OTR produced is imaged on a triggered CCD camera.
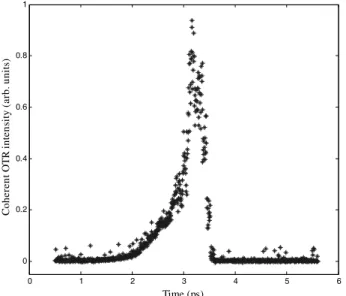
When the electron- and laser pulse overlap in the modulator they generate an energy modulation which is converted to a density modulation by the chicane. Since this microbunched electron packet results in a highly enhanced coherent OTR, temporal overlap can be registered by the camera. Hence, the fine tuning of the temporal overlap is performed by scanning the laser pulse on a 100 ps time scale around the electron position using the vector modulator, while recording the OTR signal on the camera. The intensity of the OTR signal is plotted as a function of time delay and gives a clear indication of the temporal overlap. Starting with delay steps of about 200 fs one can zoom in and use finer scans in order to find the exact position of the overlap. An example of such a scan is displayed in Fig. 2. These scans may also be used to study the transverse and longitudinal profile of electron bunches of a few ps length, which is discussed in more detail below. In these measurements a BG39 filter was placed in front of the camera for the purpose of blocking residual seed laser intensity which leaked through to OS2.
Instead of looking at the first harmonic, which is blocked by the filter, we observed the second harmonic of the coherent OTR. A neutral density filter was used to reduce the intensity by a factor of 100. Once the overlap is found the radiator undulator is turned on and tuned to resonance and the optical replica pulses are extracted to OS2 by the OTR screen and aligned into the GRENOUILLE by the
0 1 2 3 4 5 6 0
0.2 0.4 0.6 0.8 1
Time (ps)
Coherent OTR intensity (arb. units)
Figure 2: An example of a scan used to determine the position of the temporal overlap between the laser- and electron pulse. The enhancement of coherent OTR as a function of delay of the seed laser pulse reveals the overlap position.
two dielectric mirrors in front of it. The electrons are guided around the OTR screen with four steering magnets and may be passed through the SASE VUV-undulator further downstream.
RESULTS AND DISCUSSION
The parameters of the experiment are summarized in Table 1. For these experiments our goal was to show the proof of principle of the ORS, hence we strived to obtain a strong signal that we would be able to analyze with the GRENOUILLE. For this reason we used a compressed electron bunch at SASE condition, which translates into a bunch profile with a short spike and a tail, together with a short laser pulse. A rough idea of its shape is given from the temporal overlap scan, Fig. 2, although the resolution is limited by electron bunch timing jitter of a few 100 fs and the length of the laser pulse (400 fs FWHM).
Initially the laser pulse was compressed to its minimum width of 170 fs FWHM, which was measured by sending the laser beam to the FROG device at OS2. The short pulses were used in order to generate a high electric field and the strongest possible optical replica pulse. This resulted in the first signal on the GRENOUILLE.
However, if the laser pulse is in the order of, or shorter than, the electron bunch, one will essentially measure the profile of the laser pulse itself. Hence, it was stretched to 400 fs, which was predicted to be sufficiently long to enclose the spike of the electron bunch, but at the same time provide a relatively high electric field. The result of these measurements is presented in Fig. 3. Because the arrival time jitter of the electron bunch is on the order of a few 100 fs, the electron- and laser pulse occasionally miss each other. However, these figures correspond to a measurement of one single electron bunch that overlaps nicely with the laser pulse and generates the optical
Table 1: Experimental Parameters
Parameter Value Range Unit Electron beam energy 700 450-1000 MeV
Electron beam intensity 1 0.5-1.2 nC Transverse electron beam
size in modulator (rms) 0.3 mm
Average βx, βy in modulator
14.5, 9.7 m
Undulator period length 0.2 m Undulator periods 5+2
Undulator peak field 0.28 0-0.45 T Undulator K-value 5.2 0-8.4
Laser wavelength 775 nm
Laser pulse energy (at
laser) 0.7 mJ
Laser pulse energy (at modulator)
0.5 mJ
Laser pulse length (FWHM)
400 170-3000 fs
Transverse laser beam size in modulator (rms)
0.45 mm
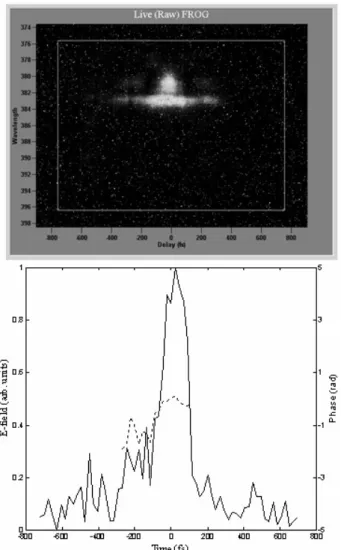
R56of chicane 170 0-300 μm replica pulse. The energy of the optical replica pulse was measured on OS2 to be approximately 5 μJ. The top part of Fig. 3 shows the FROG trace, which is the raw signal from the GRENOUILLE on which a 2D phase retrieval algorithm is applied in order to extract the electric field of the light pulse. The resulting electric field profile and phase as a function of time is displayed in the lower part of Fig. 3. Since the amplitude of the electric field is proportional to the electron bunch density, the electric field profile corresponds to the profile of the electron pulse. It should be noted that the GRENOUILLE only detects what corresponds to the top 75 % of the electron density profile. The reason for this is that it detects the second harmonic of the incoming light, which means that the registered signal goes with the power of 4 relative to the radiated electric field from the electron bunch. The 8 bit depth in the detection camera thus cuts away the lowest 25 % of the electric field amplitude. Consequently the tail of the electron bunch may be partly hidden and what is revealed in the bottom part of Fig. 3 is mainly the spike of the bunch profile, which has the width of approximately 150 fs FWHM. The fact that the measured bunch profile is narrower than the 400 fs laser pulse is an indication that it originates from the optical replica pulse.
In addition to the specified 17 fs temporal resolution, there are a few other considerations in terms of the accuracy of the result given by the GRENOUILLE.
Calculations have shown that the finite length of the 400 fs seed laser pulse results in a shortening of the electric
Figure 3: (Top) FROG trace from an optical replica pulse produced by a 400 fs laser pulse overlapping a compressed electron bunch. (Bottom) Retrieved electric field (-) and phase (--) of the optical replica pulse.
field profile by approximately 5 fs. It is however cancelled by a corresponding lengthening effect from the dispersion by the optical components in the path between the radiator and the GRENOUILLE. The slippage effect from the 5 periods of the radiator is estimated to be 13 fs.
Consequently the width of the electron bunch profile is over estimated and should be reduced by 20 fs in square.
The phase appears relatively flat in the region where the signal is sufficiently high to get a reliable result (-200 fs to 100 fs), which indicates a small electron energy chirp (see further in the section of other applications). A linear chirp results in a gaussian behaviour of the phase.
To get an estimate of the electron energy chirp given from the phase in Fig. 3 one may use Eq. 1 below. It shows that a change of 1 rad of the phase, φ(t), (which is roughly the phase change between -200 and 0 fs) corresponds to a change of P(t)/E0 by approximately 0.08 %, where E0 is the nominal energy of the electron and P(t) is the time dependent electron energy deviation, E(t)-E0. This very small energy chirp at the electron bunch spike is not fully understood.
Figure 4: FROG trace illustrating the change of appearance of the trace when compressing the electron bunch over a certain limit.
The FROG traces are expected to vary at different settings of the accelerator, such as the RF phase. But inherent to the FROG trace is a symmetry with respect to the time axis [7]. This symmetry may be broken if the observed pulse has a pulse front tilt, which shows up as a shift of the trace in the time direction, or a spatial chirp, which induces a tilt of the trace. However, these effects appeared to be very small as illustrated by Fig. 3. A drastic transformation of the FROG trace was found when adjusting the phase of the accelerator in order to compress the electron bunch further. The result, which is shown in Fig. 4, displays a very spread out trace which is clearly asymmetric with respect to time. Because of the size and asymmetry of the trace it can not be directly analyzed by the videoFROG software. One may however speculate about the origin of the signal. One possible explanation is that the compression of the electron bunch leads to a very complicated wave front of the optical replica pulse, which means that it cannot be properly characterized by the second-harmonic-generation GRENOUILLE. A simpler, and possibly more likely, explanation is that the majority of the detected signals are artefacts that arise from coherent synchrotron radiation generated somewhere in the system [11].
We verified that the ORS could be run parasitically with the FEL by guiding the electron beam around the OTR screen at OS2 with a chicane and leading it to the SASE VUV-undulator. The SASE output was not affected.
OTHER APPLICATIONS
The ORS may be used for various purposes other than that of measuring the longitudinal profile of the electron bunch, which was demonstrated above.
Electron Energy Chirp
The FROG technique enables one to measure the phase, φ(t), of the electric field produced:
))]
( ( exp[
) ( )
(t At i t t
E = ωr −φ
where A(t) is the field envelope and ωr is the radiation frequency, which may differ from the seed laser frequency, ωL, in the case of electron energy chirp. The phase of the electric field can be utilized to examine the energy chirp of the electron pulse since the longitudinal phase of the electrons, δ(t)=P(t)/E0, is connected to φ(t) by [12]
cdt t R d dt
t d
L
) ( )
(
56 δ φ =ω
given that the value of cdt R dδ
56 is small. For a single valued function δ(t) the relation may be written in the simple form [12]
56
) ) (
( R
t t c
ωL
δ = φ . (1)
Slice Properties
The slice energy spread may be determined by measuring the maximum intensity from the radiator in an R56 scan. The amplitude of the field emitted from the radiator is proportional to the degree of microbunching, and the optimal strength of the dispersion section is [6]
(t) Δ R56 2 0
πλEE
=
where λ is the radiated wavelength E0 is the nominal energy of the particle and ΔE(t) is the slice energy spread.
Slice emittance measurements are in principle also possible with the ORS [6]. However, these measurements may not be possible given the FLASH parameters and have not yet been tested.
Longitudinal-Transverse Correlation
The ORS setup can be used without the involvement of the GRENOUILLE or radiator, to produce 2D images of transverse slices of the electron bunch as a function of the longitudinal coordinate [13]. The principle is the same as that for the temporal overlap scan, where one measures the OTR, on a triggered camera, that is produced when the electron bunch hits the silver coated OTR screen. One exploits the fact that the coherent OTR from a microbunched electron pulse, which is generated when the electron- and seed laser pulse overlaps, is several orders of magnitude more intense than the incoherent OTR. With a short laser pulse one may microbunch, or slice out, a small longitudinal part of the electron bunch and image the coherent OTR on the camera. This provides a 2D image of the transversal slice of the electron bunch and a scan of the electron- and laser pulses’ relative timing allows one to visualize the transverse cross-section as a function of the longitudinal coordinate of the electron bunch.
Figure 5 shows the result of such a scan of an electron bunch which is not fully compressed. In the lower part of the figure the coherent OTR registered by the Basler camera is displayed for a sequence of longitudinal
Figure 5: A sequence of pictures (bottom) recorded by a camera on OS2 as the 200 fs laser pulse samples different longitudinal slices of the electron bunch. The size of the area shown in the pictures is 5 mm by 5 mm. The upper plot shows the average pixel value in a small region around the spot. It shows a clear enhancement as the laser pulse passes the electron bunch from the tail of the bunch at the left, to the head of the bunch at the right.
positions in the electron pulse. The full scan of average pixel value as a function of relative timing between the electron and laser pulse is presented in the upper plot. By taking the square root of the data in this plot, one gets the electron pulse profile, which showed a good agreement when compared with a simultaneous measurement with the transverse deflecting cavity, LOLA. One can see from the sequence of pictures how the signal on the camera builds up in accordance with the upper plot and that after 90 ps the spot starts to move. An analysis of the movement of the peak of the coherent spot as a function of relative timing of the laser- and electron pulse is displayed in Fig. 6. It reveals that the transverse position of the excited slice moves by approximately 1 mm and that the electron bunch has a bent shape where the tail moves away from the head. The experiment shows that visualization of the 3-dimensional profile of the electron bunch on a ps time scale is possible. The accuracy in the longitudinal coordinate is determined by the electron bunch timing jitter of a few 100 fs and the length of the laser pulse, which was about 200 fs in this measurement.
80 85 90 95 100 2
2.2
Time (ps)
Figure 6: Position of the horizontal (--) and vertical (-) centre of the coherently excited signal along the length of the electron bunch. The positions are measured from the top-left corner of the small images in Fig. 5.
A different approach to measuring the 3-dimensional electron density distribution, which may be investigated in the future, is by applying coherent imaging techniques to the coherent OTR [15].
CONCLUSIONS AND OUTLOOK
In conclusion we present the first results with the new diagnostics tool, the optical replica synthesizer, which verifies that the technique suggested by Saldin et al. [6], is experimentally possible. Spatial and temporal overlap between the electron- and laser pulse was achieved and optical replica pulses, associated with compressed electron bunches with a spike of approximately 150 fs, were generated. The optical replica pulses were analyzed with the FROG technique to extract the bunch profile. We also verified that the ORS can run parasitically while maintaining SASE operation. Due to the shutdown of FLASH in September 2009, for the build up of sFLASH [14], further investigations will be postponed.
In the experiments performed so far with the ORS we have studied compressed electron pulses because they produce a strong signal, but in the future it would be desirable to measure electron bunches of various length.
For longer electron bunches, which also require longer laser pulses, a weaker signal will be generated that ultimately will not be detectable with the 0.7 mJ seed laser pulse presently used. Thus, future experiments with the ORS would benefit from higher energy laser pulses which would produce more intense optical replica pulses.
A new high energy laser system has been installed at FLASH to be used for the seeded FEL, sFLASH. It provides pulses with an energy of up to 50 mJ, of which 10 %, i.e. 5 mJ, will be split out for the ORS. In some cases the full, 50 mJ, beam may be used which would allow measurements of longer electron pulses.
80 to 180 nm at the TESLA test facility FEL at DESY, Nucl. Inst. Meth. A475 (2001) 13.
[2] P. Audebert et al., TESLA XFEL: The first stage of the X-ray laser laboratory – Technical Design Report, DESY 2002-167.
[3] The LCLS Design Study Group, LCLS Design Study Report, SLAC-R-593, 2002.
[4] O. Grimm et al., Longitudinal bunch shape diagnostics with coherent radiation and a transverse deflecting cavity in TTF2, Proceedings of FEL04, p.
395.
[5] G. Berden, et al., Electro-Optic Technique with Improved Time Resolution for Real-Time, Nondestructive, Single- Shot Measurements of Femtosecond Electron Bunch Profiles, Phys. Rev.
Lett. 93 (2004) 114802.
[6] E. Saldin, E. Schneidmiller, M. Yurkov, A simple method for the determination of the structure of ultrashort relativistic electron bunches, Nucl. Inst.
and Methods A 539 (2005) 499.
[7] R. Trebino, Frequency Resolved Optical Gating, Kluwer, Academic, Boston, 2000.
[8] www.swampoptics.com
[9] A. Winter et.al., High-precision laser master oscillators for optical timing distribution systems in future light sources, EPAC 2006, p. 2747.
[10] www.mesaphotonics.com
[11]K.L.F Bane et al., Measurements and modelling of coherent synchrotron radiation and its impact on the Linac Coherent Light Source electron beam, Physical Review Special Topics – Accelerators and Beams 12 (2009) 030704.
[12] Y. Ding et al., Integration of the optical replica ultrashort electron bunch diagnostics with the current-enhanced SASE in the LCLS, SLAC-PUB- 12672 (2007)
[13] G. Angelova et al., Observation of two-dimensional longitudinal-transverse correlations in an electron beam by laser-electron interactions, Physical Review Special Topics – Accelerators and Beams 11 (2008) 070702.
[14] A. Azima et al., sFLASH:an experiment for seeding VUV radiation at FLASH, Proceedings of FEL08, p.
235.
[15] G. Geloni et al., Method for the determination of the three-dimensional structure of ultrashort relativistic electron bunches, DESY report 09-069 (2009).