Supplemental Material
Atomically resolved chemical reactivity of small Fe clusters
Julian Berwanger
1, Svitlana Polesya
2, Sergiy Mankovsky
2, Hubert Ebert
2and Franz J. Giessibl
11
Institute of Experimental and Applied Physics, University of Regensburg, 93053 Regensburg, Germany
2
Department of Chemistry, Ludwig-Maximilians-University Munich, 81377 Munich, Germany
(Dated: January 17, 2020)
SP1 Terminology
Coordination number and number of nearest neighbors Throughout the manuscript the dependencies of the vertical short-range force F
z,SR(z, c
∗)-curves are studied with respect to a reduced coordination number c
∗of an individual atom. c
∗is identical to the number of nearest neighbors of an individual atom within a cluster. As single Fe adatoms and small Fe clusters preferentially adsorb on fcc hollow sites, c
∗can be transformed to the coordination number c by using the relation c = c
∗+ 3. The following table depicts the reduced coordination numbers c
∗of the investigated atoms with respect to the cluster size (see also Fig. S4):
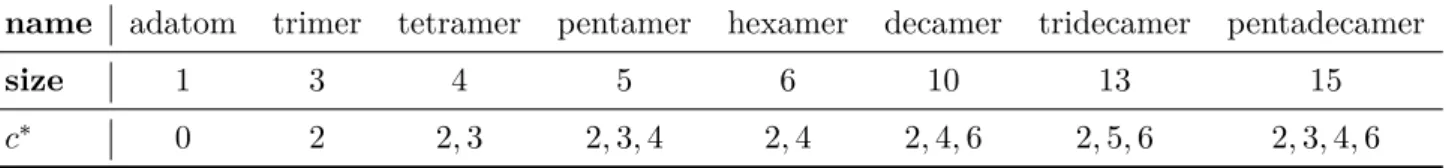
name adatom trimer tetramer pentamer hexamer decamer tridecamer pentadecamer
size 1 3 4 5 6 10 13 15
c
∗0 2 2, 3 2, 3, 4 2, 4 2, 4, 6 2, 5, 6 2, 3, 4, 6
Table 1. Types of investigated clusters categorized by size (number of atoms) and corresponding numbers of nearest neighbors within the Fe cluster (reduced coordination number c
∗).
Physisorption and Chemisorption Throughout the main text and the Supplemental Material, the two minima in the force versus distance curves are labeled as the chemisorption (at smaller distances z) and physisorption (at larger distances z) force minima (note that the minima of the F
z,SR(z) functions imply maximum strength of the attractive forces). By using this terminology, we stress the main contribution to the force minima between the tip and the specific Fe atom, originated either due to formation of a chemical bond characterizing a chemisorption process, or due to the van-der-Waals forces dominating in the physisorption regime.
In the DFT calculations, where a single CO molecule was used as a tip model, there is a one-to-one
correspondence between the adsorption energy of the CO molecule and the force acting on it from the
Fe cluster on Cu(111) system. In the experiment, on the other hand, the CO tip consists of the CO
molecule and, next to it, of a metal tip background. Hence, the detected forces in nc-AFM act between
this complete tip and the Fe cluster. However, the main contribution to the recorded forces originates
from the interaction of the CO molecule with the Fe cluster, leading to the force minima treated as
chemisoption-like or physisorption-like as those originated due to chemical bonding or van-der-Waals forces, respectively [1].
Therefore, to stress that, the terminology of physi- and chemisorption is used throughout the main text and the Supplemental Material in case of the CO-terminated metal tip in the experiment.
SP2 Experimental details
Custom-built combined scanning tunneling and atomic force microscope and tip- and sample prepara- tion All experiments were performed with a custom-built combined atomic force and scanning tunneling microscope at 5.9 K using a qPlus sensor [2] with a stiffness of k = 1800 N/m, an eigenfrequency of f
0= 20430.4 Hz and a Q-value of Q = 182747. The qPlus sensor was operated in frequency-modulation mode [3]. The qPlus sensor was equipped with an electrochemically etched bulk tungsten tip which was initially cleaned via field emission. Afterwards, it was poked repeatedly into the clean Cu(111) sample such that a monoatomic metal tip was created. The presence of a single atom tip was confirmed via the carbon monoxide front atom identification (COFI) method [4, 5] and, furthermore, its apex was func- tionalized with a CO molecule [6]. For tip characterization and functionalization purposes about 0.005 to 0.01 monolayers of CO were dosed onto the surface. Additionally, single Fe atoms were evaporated onto the cold Cu(111) surface which were used to build up Fe clusters atom by atom via lateral manipulation using CO-terminated tips (CO tips). Using CO tips for the creation of the Fe clusters allows to build the clusters and precisely check their structure using the same tip [7]. Single Fe adatoms [8, 9] and small Fe clusters [5] adsorb in fcc hollow sites on Cu(111).
Amplitude selection and force deconvolution In order to enhance the sensitivity to short-range forces, the amplitude setpoint A was chosen in a range from 10 pm to 50 pm [10]. Hereby, the exact amplitude was selected to ensure a well-posed force deconvolution using the Sader-Jarvis method by following this procedure: An initial amplitude A was set and a frequency shift versus distance curve (∆f (z)-curves) was acquired on a cluster’s atom and on the bare Cu(111) surface, respectively. Afterwards, the two
∆f (z)-curves were subtracted from each other to isolate the short-range frequency shift contribution
∆f
SR(z) between the cluster’s individual atom and the tip. Using the Sader-Jarvis method, the vertical short-range force F
z,SR(z, c
∗)-curve was deconvoluted [11]. Afterwards, the inflection point test [12] was conducted which indicates whether the chosen amplitude A lies in a potentially ill-posed amplitude range.
In case the amplitude A was in that range, it was changed accordingly and the ∆f (z)-curves were recorded again. After force deconvolution the F
z,SR(z, c
∗) curves were again checked to make sure they are indeed well-posed.
Determination of the tip-sample distance z The tip-sample-distance z was determined via the simul- taneously recorded conductance (averaged over the oscillation cycle of the tip) versus distance curves (hG(z)i = hI(z)i/V
tip), where hI(z)i is the distance-dependent tunneling current averaged over the oscil- lation cycle of the tip and V
tipis the tip’s bias voltage. Throughout the main text, we define z = 0 where the non-averaged conductance on the bare Cu(111) surface G(z = 0) equals the conductance at point contact for CO tips G
CO0= (404497 Ω)
−1[13].
Recently, it was found that at G(z = 0) = G
CO0the shell of the oxygen atom of the CO tip is still separated by ∆z = 48 pm from the shell of an Cu atom of the topmost layer of the Cu(111) surface [1].
2
By using this information the distances d between the core of the oxygen atom of the tip and the core of the investigated adsorbate used in DFT calculations were transformed to the z axis definition described above by taking into account the atomic radii of Cu (r
Cu= 135 pm), O (r
O= 60 pm) and the adsorption height h via:
z = d + h − r
Cu− r
O− ∆z = d + h − 243 pm (1) Suppression of crosstalk between scanning tunneling and atomic force microscopy All presented F
z,SR(z, c
∗) curves within the main text and the Supplemental Material were acquired at low tip bias voltages V
tipto limit the tunneling current hI (z)i and, hence, prevent crosstalk between the tunneling current and frequency shift channel [14, 15].
Microscopically sharpness of tips and different CO-terminated tips Throughout the main text and the Supplemental Material, different CO tips were discussed. Although all these tips were single-atom metal tips with a single CO molecule at their apexes, the tips are different with respect to each other, since their metal backgrounds are different. As described above, each metal tip prior CO functionalization was prepared by repeatedly poking the tip inside the Cu(111) surface until a microscopically sharp tip was generated with its apex consisting only of a single atom (i.e. monoatomic metal tip). Hence, the metal background behind the terminating single atom of each metal tip is different. In summary, each CO tip consists of a CO molecule which is adsorbed on a single metal atom with various types of metal backgrounds.
The microscopically sharpness of the metal tips prior CO functionalization can be evaluated by inves- tigating the frequency shift ∆f value at a conductance reference point of hGi = 100 pA/10 mV = 10 nS on Cu(111). At this conductance reference point, the attractive van-der-Waals interaction is the main contribution to the frequency shift value. The less negative and, hence, closer the frequency shift value is to zero, the sharper the metal tip becomes. In order to generalize the discussion concerning sharpness of the metal tips for different types of AFM sensors, we further discuss the averaged force gradient value be- tween tip and sample hk
tsi = 2k∆f /f
0[16, 17]. When using an amplitude setpoint of A = 50 pm, we label a tip as microscopically sharp if the averaged force gradient value hk
tsi lies in the range of −0.24 N/m to
(a) (b) (c)
z z z
x x x
Cu(111) Cu(111) Cu(111)
tip tip tip
<kts,1> <kts,2> <kts,3> <k‘ts,3>
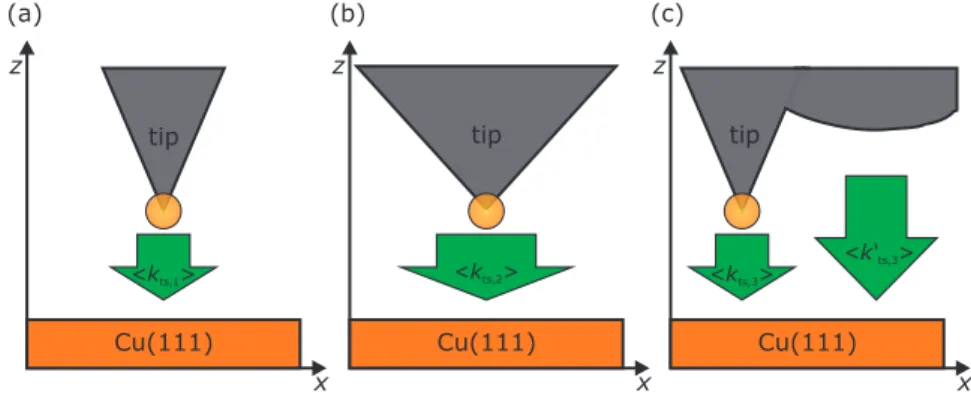
Figure S1. (a) and (b) Sketch of a microscopically sharp and blunt tip experiencing a force gradient of hk
ts,1i
and hk
ts,2i at the conductance reference point of hGi = 100 pA/10 mV = 10 nS. Here hk
ts,2i will be more
negative than hk
ts,1i. (c) A local microscopically sharp tip can experience a much more negative force gradient
value of hk
ts,3i + hk
0ts,3i by featuring a secondary laterally displaced tip that might be relatively blunt.
−0.12 N/m. In practice we rarely achieve averaged force gradient values hk
tsi above the upper limit. Fig- ure S1(a) ((b)) depicts a sketch of a sharp (blunt) tip which experiences a force gradient of hk
ts,1i (hk
ts,2i).
Here, the absolute value of hk
ts,1i is smaller than the absolute value of hk
ts,2i (|hk
ts,1i| < |hk
ts,2i|). Note that a microscopically sharp tip can exhibit a force gradient value hk
ts,3i + hk
ts,30i which is significantly lower than −0.24 N/m by featuring a secondary laterally displaced tip that might be relatively blunt which not necessarily can be detected in STM or AFM images [see Fig. S1 (c)]. Hence, using the described range for the averaged force gradient leads, from time to time, to the collateral destruction of microscopically sharp tips.
Potential explanation of a double minimum in the F
z,SR(z, c
∗)-spectra due to CO tip bending In principle, a double minimum in the F
z,SR(z, c
∗)-curve could be explained by CO bending. However, it is crucial to note, that the appearance of the second force minimum for the F
z,SR(z, 0)-spectra on single Fe adatoms (see Fig. 1 in the main text) at closer tip-sample distances z is no result of CO tip bending:
First, it was shown that the lateral force acting on the tip in the attractive center of the Fe adatom is zero and, second, density functional theory (DFT) calculations have reproduced the two force minima by using a rigid CO molecule as a tip (see Ref. [1]). Additionally, the DFT calculations reveal that substantial hybridization of the electronic orbitals of the CO molecule and the Fe adatom occurs at small tip-sample distances if the CO molecule is positioned above the Fe adatom [1].
The CO tip also remains upright during the acquisition of the F
z,SR(z, c
∗)-spectra on the individual atoms of the Fe clusters, as the (x, y)-locations of the spectra were selected such that the lateral force acting on the CO tip is zero or almost zero (see Fig. S6 for the detailed discussion). More importantly, DFT calculations show, next to the physisorption force minimum at z = 380 pm, the beginning of a second force minimum at closer distances z < 300 pm using a rigid CO molecule as a tip [see light blue curve in inset of Fig. S5(a)]. Hence, we can exclude, throughout the main text and the Supplemental Material, potential artifacts introduced through CO bending in the presented experimental force curves and, additionally, suggest that the presence of the second minimum at smaller distances is a result of hybridization, similar to the single Fe adatom [1].
Error sources in the experimental data The experimental error sources can be split up in the two coordinates, namely the z-direction and the F
SR,z-direction.
Errors in vertical z-direction Along the z-direction, the error is mainly caused by piezo creep, thermal drift, inaccuracies of the z-calibration of the piezo tube and inaccuracies in the determination of the decay length κ of the tunneling conductance.
All experimental frequency shift versus distance spectra were recorded with active drift compensation.
This leads to a residual drift and creep of less than 10 fm/s. The acquisition time of one spectrum is about 70 s. The total residual combined drift and creep during the acquisition of a spectrum on the cluster and of a spectrum above the bare Cu(111) surface over a range of 500 pm is smaller than 1.4 pm which is negligible compared to the stepsize of 5 pm.
The piezo tube was calibrated in z-direction by measuring the height of a monoatomic step on the Cu(111) surface in constant-current mode using a conductance setpoint of 10 pA/10mV and comparing the result with the theoretical step height of 209 pm [18]. In this way, an error in the z-calibration of less than 1% is achieved. This translates to an error of less than 5 pm over the typical sweep range of 500 pm
4
of a frequency versus distance spectrum which lies in the range of the experimental stepsize in z-direction of ∆z = 5 pm.
The decay length κ of the tunneling conductance is determined by fitting following equation [19, 20]
hG (z)i = G
0exp (−2κz) exp (−2κA) I
0(2κA) (2) to a conductance versus distance curve. The error in the determination of the decay length κ is less than 1%. This translates into an error of the closest approach in the experimental force spectra of also 1%.
The closest approaches in the experimental force spectra lie in the range of 100 pm to 300 pm. Hence, the error in the distance determination with respect to the conductance at point contact of CO tips G
CO0is smaller than 3 pm.
Overall, all error sources in z-direction are small enough such that they can be neglected.
Errors in the short-range force F
SR,zvalues The error in the F
SR,zvalues is mainly caused by uncertainties of the stiffness k of the qPlus sensor and inaccuracies of the force deconvolution process.
The uncertainty of the stiffness k is about 9% [17]. The force deconvolution process introduces inaccuracies of less than 5% [11]. These errors add up to a systematic error of about 14% and are visualized in Fig.
S10. For clarity, this systematic error is not indicated in the remaining figures of the main text and Supplemental Material.
However, the standard deviations in depicted in Figs. 2(b) and (c) exceed the systematic error in the F
SR,zvalues.
SP3 Computational details
The forces acting on the CO tip in the vicinity of the clusters deposited on the Cu(111) surface were obtained from first-principle calculations using the Vienna ab-initio Simulation Package (VASP) [21, 22]
employing the projector augmented wave basis sets. The generalized gradient approximation (GGA) has been used for the exchange-correlation potential as given by Perdew et al. [23]. The force calculations accounted for the van-der-Waals contribution by means of the DFT-D3 scheme for the dispersion cor- rections as given by Grimme et al. [24]. The Monkhorst-Pack (4 × 4 × 1) k-point grid was used for the integration over the Brillouin zone. For the wave function representation, a plane-wave basis set with a cutoff energy of 440 eV was used.
The calculations have been performed in supercell geometry. In order to simulate the clean Cu(111)
surface, the supercell was set up with four atomic Cu layers, a 3 nm wide vacuum layer along the z-direction
and a 7 × 7 two-dimensional unit cell within the xy-plane. The Fe clusters were deposited on top of the
Cu(111) surface with the size of the corresponding supercell allowing to minimize the interaction between
the deposited clusters in neighboring supercells. A single rigid CO molecule pointing to the sample with
the O atom was used to model the tip. First, the electronic structure was calculated for a pure Cu(111)
slab without any adsorbate using a full structure optimization within the unit cell. Next, calculations
have been performed for the system including the cluster atoms on the Cu(111) surface, again allowing
structure relaxation within the slab and the deposited cluster. The most stable positions of the deposited
cluster atoms have been found via total energy calculations for the relaxed cluster/surface system.
SP4 Adsorption geometry of CO molecules on Fe clusters
If CO molecules can orient freely in the gas phase they adsorb with their C atom on Fe clusters [25]. In the gas phase CO molecules adsorb mainly non-dissociatively on top positions on Fe clusters consisting of 18 to 30 atoms [26]. On smaller Fe clusters (2 to 6 Fe atoms), DFT calculations suggest twofold coordinated adsorption of CO molecules on two-, three- and four-atom Fe clusters, threefold coordinated adsorption on five-atom Fe clusters, and fourfold coordinated adsorption on six-atom Fe clusters in the gas phase [27].
In our experiments, the CO molecule binds to the tip’s metallic front atom with its C atom [6]. If the CO tip is approached to a cluster’s Fe atom, i.e. to the most attractive position in the ∆f(x, y) image, the lateral force on the CO tip is zero (see Fig. S6). If the CO tip is approached slightly off-center the most attractive (x, y) position, small lateral forces act on the CO tip pointing to the most attractive (x, y) position. Therefore, the CO molecule on the tip cannot rotate during the approach to a Fe cluster’s atom and, hence, it interacts with the Fe clusters in an unusual geometry (i.e. it approaches the Fe cluster with its O atom at the lateral positions of highest attraction). Conclusively, the determination of the active sites [28] within this manuscript is restricted to the interaction of CO molecules approaching with their O atom to the Fe clusters.
6
SP5 Supporting additional data
100 300 z(pm) 500 700
-400
-500 -300 -200 -100 0
Fz,SR(pN)
Cu C O Fe
CO tip 5 CO tip 1 CO tip 2 CO tip 3 CO tip 4
CO tip 5 CO tip 1 CO tip 2 CO tip 3 CO tip 4 i=1
i=2 i=3 i=4
-200 0 200
Fz,SRCO tipi- CO tip 5 (pN)
100 300 500
z(pm) (a)
100 300 z(pm) 500 700
-200 -150 -100 -50 0
ESR(meV) (d) (b)
i=5 i=2 i=3 i=4
-200 0 200
Fz,SRCO tipi- CO tip 1 (pN)
100 300 500
z(pm) (c)
Figure S2. (a) Short-range force versus distance F
z,SR(z, 0)-spectra acquired with five different CO tips (CO tips 1 to 5) above the center of single Fe adatoms. The CO tips are different with respect to each other, since their metal background varies (see section SP2). The curves for CO tips 1 to 3 are identical to curves shown in Fig. 1(a) of the main text. Panel (b) shows the differences of the short-range force F
z,SR-curves of CO tips 1 to 4 with respect to CO tip 5 [see sketch in panel (b)]. The differences of the short-range force F
z,SR-curves of CO tips 2 to 5 with respect to CO tip 1 are shown in panel (c). Neither of the differential force curves show a pure monotonic distance dependence, which would lead to a plain additive difference in metal tip background to Fe adatom interaction (see also main text). (d) Corresponding short-range energy E
SR(z, 0) = − R
F
z,SR(z, 0) dz curves shown in panel (a) for CO tips 1 to 5. The absolute energy minima were
not reached in the experiment. The CO tip’s were not approached closer to the Fe adatoms, since a noticeable
change in the drive signal (excitation signal for maintaining a constant amplitude A of the AFM sensor) was
detected which mostly indicates that a further approach of the tip result in a tip damage. The minima at smaller
(larger) z-distances are called chemisorption (physisorption) force or energy minima throughout the main text
and the Supplemental Material, respectively (see paragraph physisorption and chemisorption terminology in
section SP2). The physisorption force and energy minima appear more (green curves in panel (a)and (c) - CO
tip 1) or less distinct or even flattened out completely depending on the individual CO tip, respectively.
c*=0 c*=2 c*=3 c*=4 c*=5 c*=6 c*=0 c*=2 c*=3 c*=4 c*=5 c*=6
c*=0 c*=2 c*=3 c*=4 c*=5 c*=6 c*=0 c*=2 c*=3 c*=4 c*=5 c*=6
c*=0 c*=2 c*=3 c*=4 c*=5 c*=6 c*=0 c*=2 c*=3 c*=4 c*=5 c*=6
c*=0 c*=2 c*=3 c*=4 c*=5 c*=6 c*=0 c*=2 c*=3 c*=4 c*=5 c*=6
100 300 500 700
z(pm) -200
-250 -150 -100 -50 0 50
(g) CO tip 2
ESR(meV)
(h)
100 300 500 700
z(pm) -120
-80 -40 0
CO tip 3 (i)
100 300 500 700
z(pm) -120
-80 -50 0
CO tip 4 100
100
300
300
500
500
700
700 -200
-0.8 -0.4 -100 0
0 100
0.4
CO tip 3
CO tip 3 (b)
(e)
100
100
300
300
500
500
700
700 -0.8
-300 -200 -100
-0.4 0
0 100
0.4
CO tip 4
CO tip 4 (c)
(f)
100 300 500 700
-0.8 -0.4 0
0.4 CO tip 2
(d)
Fz/ Fzz,SRz,SR(,c*)(,0)chem
c*=0 c*=2 c*=3 c*=4 c*=5 c*=6
100 300 500 700
-400 -500 -300 -200 -100 0
100 CO tip 2
(a)
Fz,SR(pN)
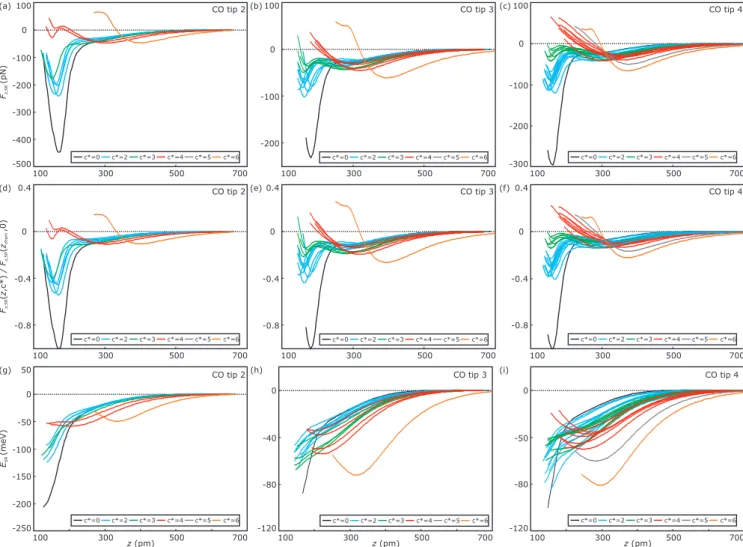
Figure S3. Corresponding (a)-(c) short-range force versus distance curves (F
z,SR(z, c
∗)), (d)-(f) short-range force versus distance curves normalized to the corresponding chemisorption force minimum of the single Fe adatoms (F
z,SR(z, c
∗) /F
z,SR(z
chem, 0)) and (g)-(i) short-range energy versus distance curves E
SR(z, c
∗) =
− R
F
z,SR(z, c
∗) dz-curves) to the F
z,SR(z, c
∗)-curves shown in Fig. 2 of the main text. The various columns correspond to CO tip 2, 3 and 4, respectively. The corresponding constant-current ∆f (x, y) images of all atomically engineered Fe clusters are presented in Fig. S4. Panel (a) is identical to Fig. 2(a) of the main text.
Using different CO tips (CO tips 3 and 4) show a similar dependence of the chemisorption force minimum on the reduced coordination number c
∗[panels (b)and (c)], namely a decrease of the attractive chemisorption force minimum with increasing c
∗. While for c
∗= 4 (red curves), the second minimum is not clearly visible in every curve, it is detectable in the frequency shift data ∆f
SR(z, 4) (not shown here). In case of c
∗= 5 no clear second minimum could be resolved. In case of c
∗= 6 the force minima at smaller z-distances are repulsive and lie at larger z-distances compared to c
∗= 0, 2, 3, 4. Hence, no chemisorption-like attraction occurs for c
∗= 6. When comparing e.g. the F
z,SR(z, 2) curves (light blue curves in panels (a)-(c)) of all three CO tips, we find that for CO tip 2, the chemisorption force minima are by about 100 pN more attractive than for the CO tips 3 and 4.
However, the chemisorption force minima in case of the single adatoms (c
∗= 0, black curves) show a similar trend. We attribute this to a different bonding of the CO molecules to the metal tip’s apex (see main text).
Hence, a normalization of the F
z,SR(z, c
∗) curves with respect to the chemisorption force minima of the single adatom spectra F
z,SR(z
chem, 0) was applied (see panels (d)-(f)). The E
SR(z, c
∗)-curves shown in panels (g)-(i), corresponding to the F
z,SR(z, c
∗)-curves shown in panels (a)-(c), reveal that the chemisorption energy minima cannot be reached in the experiments. The CO tips were not approached closer since a noticeable change in the drive signal was detected and a further approach of the tip would have resulted in a tip damage (see also
caption of Fig. S2). 8
500 pm (a) Trimer (3 atoms)
400 pm
Trimer (3 atoms) Tetramer (4 atoms) Pentamer (5 atoms) Hexamer (6 atoms)
500 pm Pentadecamer (15 atoms)
500 pm
Trimer (3 atoms) Tetramer (4 atoms)
500 pm
Pentamer (5 atoms)
500 pm
Hexamer (6 atoms)
500 pm
Tridecamer (13 atoms)
500 pm
400 pm 400 pm 400 pm
Pentamer (5 atoms)
500 pm
(c) Hexamer (6 atoms)
500 pm
(d) Decamer (10 atoms)
500 pm (e)
500 pm (b) Tetramer (4 atoms)
(f) (g) (h) (i) (j)
(k) (l) (m) (n) (o)
-6.0Hz -0.6Hz -6.0Hz -0.5Hz -6.3Hz -0.6Hz -6.0Hz -1.4Hz -6.1Hz -1.3Hz
-10.4Hz +2.9Hz
-6.0Hz +2.8Hz -5.9Hz +3.3Hz -6.0Hz +3.2Hz -5.6Hz +2.7Hz -5.9Hz +2.1Hz
-9.3Hz +3.1Hz -11.0Hz +4.8Hz -10.9Hz -3.2Hz -7.9Hz +1.1Hz
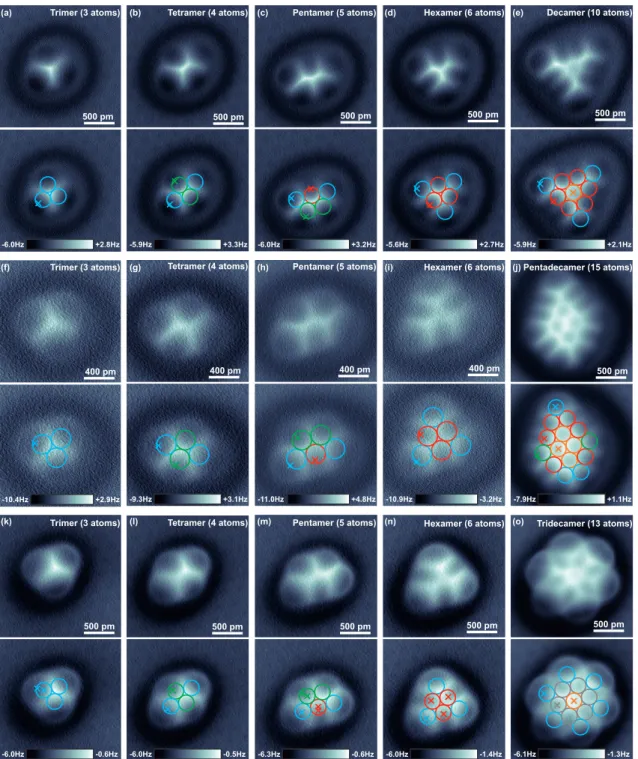
Figure S4. Corresponding ∆f (x, y) images of all atomically assembled Fe clusters, acquired in constant-current mode. The images shown in panels (a)-(e), (f)-(j) and (k)-(o) were recorded with CO tip 2, 3 and 4, respectively.
The top part of each panel shows the raw ∆f (x, y) image, while in the bottom part the top image was overlayed with the atomic positions (circles) and the (x, y)-locations of the F
z,SR(z, c
∗)-spectra shown in Fig. S3. All spectra were acquired in the most attractive part of the cluster’s individual atoms, such that the lateral forces on the CO tip were minimal and the CO tips kept upright during the acquisition of the force curves (see also Fig. S9 in [1] and Fig. S6). Imaging parameters: [CO tip 2] (a)-(e) V
tip= −1 mV, hIi = 80 pA, A = 50 pm;
[CO tip 3] (f)-(j) V
tip= −1 mV, hIi = 110 pA, A = 10 pm except hIi = 100 pA for panel (f) and A = 10 pm for
panel (j); [CO tip 4] (k)-(o) V
tip= −1 mV, hIi = 100 pA, A = 50 pm.
100 300 500 700 z(pm)
-50 0 50
-100
-150
-200
CO tip 2
zring appearance
z=320pm (a)
Fz,SR(pN)
-8.5 1.0 (c)
(b)
(e) (d)
500 pm z (pm) [constant-current]
115 340
Δf(Hz) [constant-current]
0.0015
0 ρ(e/Å3) z=320pm
500pm Fz,SR(pN) atz= 320 pm
-48 36
500pm 500pm
top center repulsion c*=2 c*=4 c*=6
500 300
100 -50
50
0
Fz,DFT(pN)
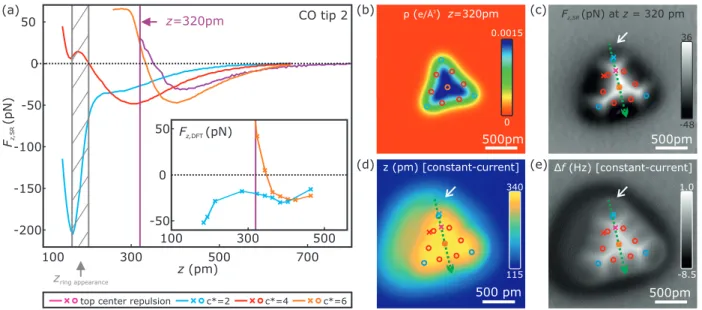
Figure S5. Atomic contrast formation analysis for a atom-by-atom assembled 10 atom Fe cluster (similar to the analysis of the 15 atom cluster in Fig. 3 of the main text). Panel (a) shows F
z,SR(z, c
∗)-curves acquired on various positions on the 10 atom Fe cluster. The F
z,DFT-curves, calculated by DFT, shown in the inset, qualitatively reproduce the experimental F
z,SR(z, 2) and F
z,SR(z, 6)-curves. The calculated charge density ρ (x, y) image at z = 320 pm is shown in panel (b). Panel (c) shows an experimental atomically-resolved short- range force image F
z,SR(x, y, z = 320 pm). Panels (d) and (e) depict the simultaneously recorded topographic (z (x, y)) and frequency shift (∆f (x, y)) images of the same spot as in panel (c) acquired in constant-current mode (V
tip= −1 mV, hIi = 100 pA). The (x, y)-positions of the F
z,SR(z, c
∗)-curves (colored crosses) shown in panel (a) and the DFT calculated atomic positions (fcc adsorption) were overlayed in panels (c)-(e). The color coding of the atomic positions is identical to the color coding of the spectra shown in panel (a). Similar to the 15 atom cluster, as described in the main text, the appearance of the central atom (c
∗= 6) as a depression (attractive, dark) occurs at z = 320 pm [see panels (c) and (e)]. At this z-position, the F
z,SR(z, c
∗)-curves show that the atomic contrast [orange vs. magenta curve in panel (a)] arises in the transition regime between the physisorption force minimum and the second repulsive minimum (plateau) located at a smaller z-distance, as latter minimum results in a decrease of the slope of the F
z,SR(z, 6)-curve (orange curve) in the distance regime of 280 pm ≤ z ≤ 360 pm. Investigating the initial atomic contrast of the corner (c
∗= 2) and edge atoms (c
∗= 4) of the cluster in constant-height mode, shows that atoms appear attractive (dark) with repulsion (bright) in between the atoms [see panel (c)]. The F
z,SR(z, c
∗)-curves on these two atoms [light blue and red curve in panel (a)] show that the atomic contrast occurs shortly before the physisorption force minimum is reached. Hence, we conclude that the initial atomic contrast is not an effect of a hybridization of the CO tip with these atoms (similar as for the 15 atom cluster described in the main text). Similar to the 15 atom cluster shown in Fig.3 of the main text, we find that the appearance of the edge and corner atoms as tori in constant- current mode [see panel (e)] results of the much closer approach of the CO tip at the (x, y)-positions of the appearance of the tori [see e.g. identical located white arrows in panels (c)-(e)]. At these closer distances [grey shaded area in panel (a)] the CO tip transitions from the physisorption force minimum to the chemisorption force minimum (similar to the appearance of the single Fe adatom in Ref. [1]). Hence, the appearance of the edge and corner atoms as tori is a result of the hybridization (chemical bonding) of the electronic states of the CO tip with the states of the individual atoms of the cluster’s edges and corners. Moreover, we find that repulsive vertical forces occur in between the atoms [bright features in panel (c) and (e)] and attractive forces in the center of the individual atoms of the cluster [(dark features in panel (c) and (e)]. Studying the charge density derived from DFT calculations at a height of z = 320 pm reveals that the charge density is increased between the atoms [see panel (b)] possibly leading to increased Pauli repulsion in-between the cluster’s atoms.
Results of corresponding DFT calculations (vertical F
z,DFT(x) and lateral F
x,DFT(x) force curves) along the green arrow in panel (c) are shown in Fig. S6.
10
Δx
-400 -200 0 400
-600 200
x(pm) 1000
0 500
DFT - rigid CO tip (a)
Fz,DFT(pN)
x(pm) 200
0 400
-200
-400
DFT - rigid CO tip (b)
Fx,DFT(pN)
c*=2 c*=6
Δx=90 pm
Δx=90 pm Δx
z=204 pm
=229 pm z
=294 pm z
z=204 pm
=229 pm z
=294 pm z
-400 -200 0 400
-600 200
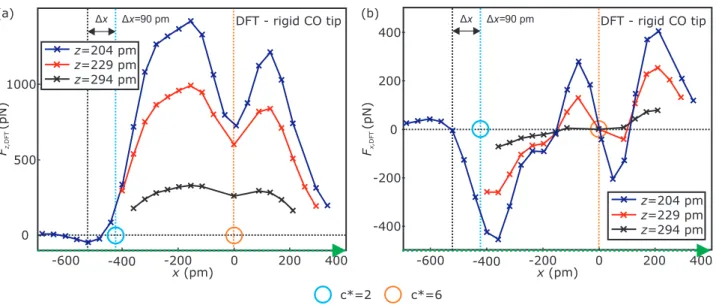
Figure S6. Panels (a) and (b) show vertical force F
z,DFT(x)- and lateral force F
x,DFT(x)-curves obtained from
DFT calculations in three different distances z = {204 pm, 229 pm, 294 pm} across the top corner atom (c
∗= 2)
and central atom (c
∗= 6) of the 10 atom Fe cluster [see green arrow Fig. S5(c)], respectively. The core-core
distance between the O atom of the CO molecule and the central atom of the Fe cluster was transformed to
the z definition, introduced in section SP2, by using the adsorption height h of the central atom (c
∗= 6) of
h = 207 pm, which was calculated by DFT. The light blue (c
∗= 2) and orange (c
∗= 6) circles in both panels
indicate the x-positions of the cluster’s atoms, respectively. A rigid CO molecule was used as a tip model for the
DFT calculations. The experimental F
z,SR(z, c
∗)-curves on the individual atoms of the Fe clusters presented
throughout the main text and the Supplement Material, were acquired by about 200 pm closer than the closest
constant-height in the xy-plane. At these close distances the lateral forces in between the atoms, which are
experimentally inaccessible, are in the range of 100 pN (see panel (b)). Such high lateral forces would result
in losing of the CO from the tip’s apex. However, the lateral forces on top of the individual atoms are much
smaller (c
∗= 2) or zero (c
∗= 6) [see panel (b)]. A positive/negative lateral force indicates a force acting on the
tip which points to the right/left side, respectively. The vertical force F
z,DFT(x) on top of the central atom with
c
∗= 6 (x = 0) shows a local minimum. The corresponding lateral force at x = 0 is zero (F
x,DFT(x = 0) = 0)
for all depicted z-distances [see vertical orange dotted line in panel (b)]. Hence, the CO remains upright if the
CO tip is positioned above the center of the central atom with c
∗= 6 in the three calculated heights. A slight
misplacement of the tip results in a lateral force acting on the CO which points to x = 0. Hence, the CO tip
will always be bent to the center. The appearance of two force minima in the F
z,SR(z, c
∗)-curves acquired on
top of the atoms with c
∗= 6 cannot be a result of CO bending. As described in the main text, the experimental
F
z,SR(z, c
∗)-curves on the atoms with c
∗= 2 − 5 were acquired in the most attractive part of the constant-
height vertical force images. The experimental attractive vertical force minima were found to be about 80 pm
off center of the investigated atoms. This lateral offset is confirmed (∆x ≈ 90 pm) by the DFT calculations [see
dark blue F
z,DFT(x)-curve and vertical black and light blue dotted lines in panel (a)] in case of the 10 atom
Fe cluster. The lateral force at the corresponding x-position of the vertical force minimum (x = −521 pm) is
almost zero (F
x,DFT(x = −521 pm) = −7 pN) at z = 204 pm. Additionally, the lateral force curve is asymmetric
with respect to x = −521 pm. Therefore, the tip’s CO molecule is bent towards x = −521 pm if the tip is
slightly laterally offset to the position of highest vertical attraction. Moreover, DFT calculations reproduced
the double minima shape of the experimental vertical force curves using a rigid CO molecule as a tip model
[see Fig. S5(a)]. CO bending can, therefore, be neglected in the experimental F
z,SR(z, c
∗)-curves throughout
the manuscript and is not the reason for the appearance of the second minimum in the experimental vertical
force curves.
500pm 500pm
Fz,SR ΔfSR
z= 335pm z= 335pm
-58pN 13pN -2.6Hz 1.5Hz
(a) (b)
500pm 500pm
Fz,SR ΔfSR
z= 335pm z= 335pm
-58pN 13pN -2.6Hz 1.5Hz
(c) (d)
top center repulsion top repulsion left repulsion c*=2 c*=3 c*=4 c*=6
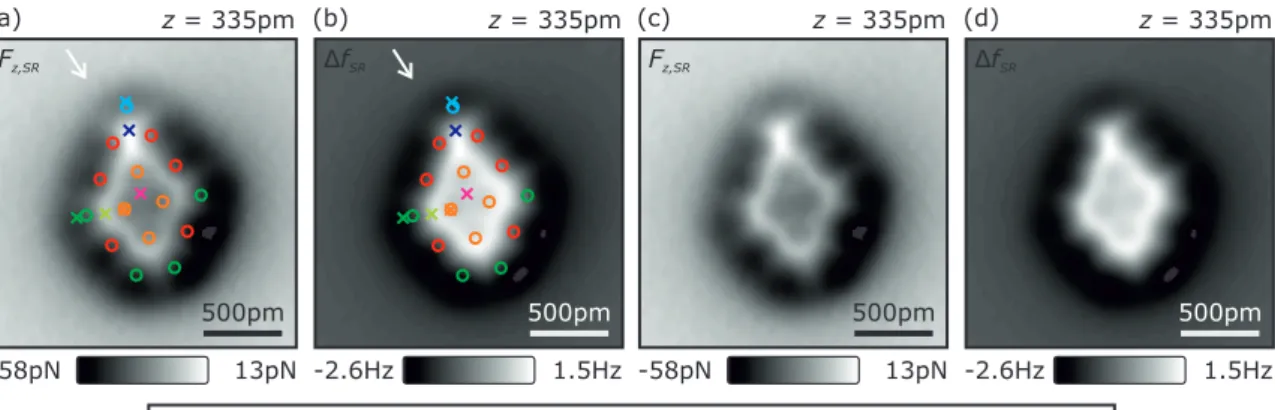
Figure S7. (a) Identical to Fig. 3(b) of the main text. (b) Corresponding short-range frequency shift ∆f
SR(x, y)- image at the same tip-sample distance of z = 335 pm. The colored circles indicate the atomic positions and the colored crosses the locations of the short-range force-distance spectra depicted in Fig. 3(a) of the main text.
Panels (c) and (d) are identical to panels (a) and (b) while the colored circles and crosses were removed for clarity, respectively.
12
-5.8Hz -1.1Hz (a)
Δf(Hz) [constant-current]
100 300 500 700
-100 -120 -80 -60 -40 -20
0 CO tip 4
(b)
Fz,SR(pN)
z(pm)
500pm
c*=2, left corner c*=2, bottom corner
c*=2 c*=4
Figure S8. (a) Atomically resolved ∆f (x, y) image of a six-atom Fe cluster recorded with CO tip 4. The
colored circles indicate the fcc adsorption sites of the underlying Cu(111) substrate. The light blue colored
crosses indicate the (x, y) positions of the F
z,SR(z, c
∗= 2) spectra shown in panel (b). The color of the circles
and crosses displays the reduced coordination number c
∗of the cluster’s specific Fe atom. Theoretically, the
F
z,SR(z, c
∗= 2) curves above the left corner and the bottom corner atoms (see light blue crosses in panel
(a)) are identical. In experiment, the chemisorption force minimum and the physisorption force minimum is
more attractive for the F
z,SR(z, c
∗= 2) curve recorded above the bottom corner Fe atom compared to the
F
z,SR(z, c
∗= 2) acquired above the left corner atom (see light blue dotted curve vs. solid light blue curve in
panel(b)). The differences can be attributed to a non-radially symmetric tip background. The asymmetric tip
background also results in the non-symmetric dark halo around the six-atom Fe cluster in the ∆f (x, y) image
depicted in panel (a). However, comparing a F
z,SR(z, c
∗= 2) and a F
z,SR(z, c
∗= 3) curve with each other (as
shown in Fig. 2(a) for an ten-atom Fe cluster) shows that the physisorption (chemisorption) force minimum of
the F
z,SR(z, c
∗= 3) curve is more (less) attractive compared to the F
z,SR(z, c
∗= 2) curve. This is strikingly
different for the two F
z,SR(z, c
∗= 2) curves shown in panel (b).
100
100 300
300 500
500 z(pm) 700
-400
-500 -300 -200 -100 0
Fz,SR(pN)
i=2 i=3
Cu C O Fe
CO tip 1 CO tip 2 CO tip 3 -200
0 200
Fz,SRCO tipi-Fz,SRCO tip 1 (pN)
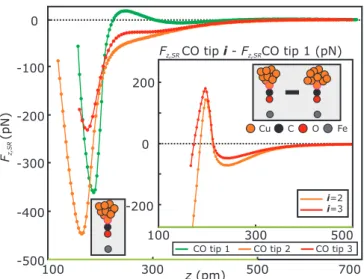
Figure S9. Copy of Fig. 1 of the main text while the data points are presented as dots connected by lines.
This figure shows that the representation of the experimental curves as solid lines as done in Fig. 1 of the main text is justified as the stepsize in z-direction is only ∆z = 5 pm. To simplify the experimental graphs and their discussion, the experimental data are plotted as connected (solid) lines in all other figures of the main text and Supplemental Material.
100 300 z(pm) 500 700
-400 -500 -300 -200 -100 0
Fz,SR(pN)
CO tip 1 CO tip 2 CO tip 3 -600