Report
Eurostars – The International Programme for Research Intensive SMEs: A Joint Swiss Danish Impact Study
Author(s):
Beck, Mathias; Hansen, Jette; Kaiser, Boris; Sonne-Holm, Peter; Wörter, Martin Publication Date:
2020-12
Permanent Link:
https://doi.org/10.3929/ethz-b-000457665
Rights / License:
In Copyright - Non-Commercial Use Permitted
This page was generated automatically upon download from the ETH Zurich Research Collection. For more information please consult the Terms of use.
ETH Library
KOF Studies, No. 159, December 2020
A Joint Swiss Danish Impact Study
Mathias Beck, Jette Hansen, Boris Kaiser,
Peter Sonne-Holm and Martin Wörter
© 2020 KOF Swiss Economic Institute, ETH Zurich DOI: 10.3929/ethz-b-000457665
Authors
Mathias Beck Jette Hansen Boris Kaiser Peter Sonne-Holm Martin WörterETH Zurich
KOF Swiss Economic Institute LEE G 116
Leonhardstrasse 21 8092 Zurich, Switzerland Phone +41 44 632 42 39 Fax +41 44 632 12 18 www.kof.ethz.ch kof@kof.ethz.ch
The International Programme for Research Intensive SMEs
A Joint Swiss Danish Impact Study
Authors: Mathias Beck, Jette Hansen, Boris Kaiser, Peter Sonne-Holm and Martin Wörter.
January 2020
Introduction
Denmark and Switzerland have invested in Eurostars projects since its launch in 2008. The purpose is to support innovative product development and international cooperation between firms and knowledge institutions.
Eureka, which facilitates the Eurostars system, have conducted several impact studies including all 36 Eurostars member states (not all are in EU). These studies have been based on European databases with few or no data on
SME’swith less than 20 employees. Given that Eurostars is aimed at
SME’s,many with less than 20 employees, this is a significant shortcoming.
This report is the first impact study of Eurostars in Denmark and Switzerland based on national register data covering all firms and their employees in the two countries. This allows us to extract new and valuable information about the firms and the impact of participating in Eurostars.
Denmark and Switzerland are well suited for a joined study such as this. As the report shows, there are many similarities between Eurostars projects in the two countries with respect to size of the program, the nature of the projects andthe participants. Also both countries are small, open economies and generally characterized as knowledge intensive and highly productive. It is therefore natural to compare the findings for the two countries.
The report is a the result of a joint study performed by DAMVAD Analytics from Denmark and ETH Zürich KOF and B,S,S. from Switzerland on behalf of The Innovation Fund Denmark, The Danish Agency for Science and Higher Education and The Swiss Secretariat for Education, Research and Innovation.
We have used similar data sources for the studies in the two countries. This is mainly data from Eureka about the program and the projects and firm level data from the statistical bureaus (referenced as register data). There are some differences in the data available in the two countries. In particular there are some limitations on Swiss register data with respect to available variables and firm coverage.
Generally, we apply the same analytical methods in the two countries. This includes the econometric analysis. However, the data availability in the two countries has some influence on the specific method we apply. Therefore, not all the presented results are directly comparable between the two countries.
It is our hope that the report provide new insights about Eurostars, which can be used to further develop the program.
We also hope future evaluations of Eurostars and other research and innovation programs
will benefit from the findings. In particular we advice evaluators to consider if the available
data is sufficient to apply the desired method.
Table of content
Executive Summary 4
Part 1 – Descriptive Analysis 11
1. Eurostars in the Danish & Swiss Innovation landscape 12
2. Participation in Eurostars 17
3. The Danish and Swiss companies in Eurostars 25
4. Descriptive Economic Indicators 39
Part 2 – Econometric Analysis 49
5. Impact on Firms’ performance 50
6. Recommendations for Future Impact Analysis 57
References 59
Annex (methodology and data issues) 62
3
Executive Summary
Executive Summary
Eurostars has successfully attracted innovative SMEs in Switzerland and Denmark
The Eurostars programme has been successful in attracting Swiss and Danish firms to apply for direct financial innovation support. From 2008 to June 2018 Swiss organizations have participated 400 times in Eurostars projects and Danish organizations have participated 347 times.
The Eurostars programme particularly attracts small and young innovative firms
–which is also a main purpose of Eurostars. Small and young firms face serious difficulties to realize financial funding for their innovative activities. It is the greatest innovation obstacle for small firms according to the Swiss Innovation Survey 2017 (Spescha & Wörter 2018) and recently outlined in the report on Venture Capital in Europe issued by Roland Berger, (Berger, 2019).
Moreover, small firms have a strong growth potential. The direct innovation support provided by the Eurostars programme complements the national available funding schemes, which makes it in particular attractive for financially constraint small firms.
Generally, Eurostars funding areas matches the technology orientation of Danish and Swiss firms with their strength in Biotech and other technology-oriented industries. More than one third of the projects are in biotech. Other common areas are industrial technology and ICT.
5
Eurostars allows SMEs to cooperate with other companies and universities in other countries Eurostars is designed to promote cooperation between R&D-performing SMEs and larger firms, universities and research institutes.
The Eurostars programme also promotes cross-border cooperation. It is a requirement that the each project have partners from different countries. This is reflected by the fact that a majority of the partners of the
main applicantsare from other countries both inside and outside EU. This creates a potential for transfer of knowledge and technology, which may help the firms grow and become more productive.
Cooperating with foreign firms let the participants increase their network, which may allow them to unveil new potentials. For example new trade deals to increase export. These kinds of effects may also benefit rejected applicants.
0% 20% 40% 60% 80% 100%
Switzerland Denmark
Same country EU Non-EU
Geographical region of partners’ origin of main applicants
Executive Summary
SMEs that participate in Eurostars grow after the projects start
Evidence from Denmark, where we have access to more data than in Switzerland, shows that the SMEs that participate in Eurostars projects (the funded SMEs) have a high growth in turnover, exports and productivity (labor productivity) in the years immediately after the projects start. The turnover for the funded firms is on average 67% higher three years after the projects start compared to one year before the projects start
–and exports is 76% higher.
Compared to this the SMEs that applied for Eurostars projects, but were rejected, (not- approved) SMEs, grew slower, though faster than other SMEs of similar size and in the same sectors (Similar SMEs).
The funded SMEs growth is not directly a result of solutions and products developed in the Eurostars project. These projects takes three years to complete, and the firms are expected to use another couple of years to prepare the solutions for the market. Therefore, the growth is spurred by other factors, for example learning effects and the effects of obtaining new contacts in other companies and foreign countries. We do not yet have enough data to robustly calculate the growth after the projects end.
The not-approved SMEs may also benefit from learning effects and new contacts obtained in the application process. Furthermore, they may have started the project they applied for without the funding from Eurostars.
The funded SMEs have not grown significantly with respect to the number of employees.
2%
67%
76%
92%
11%
26%
45%
29%
10% 16%
34%
6%
Employment Turnover Exports Productivity
Funded SMEs Not-approved SMEs Similar SMEs
Average growth (%) from one year before project start to three years after project
start (two years after for productivity) for Danish SMEs
Executive Summary
7
Employment growth between approved SMEs and control group SMEs in Switzerland
Average number of FTEs
Project start
Control group SMEsFunded SMEs
30 35 40 45 50
Eurostars has a positive impact on employment according
Comparing the economic outcomes of the different groups over time is not enough to conclude anything about the effect of participating in the Eurostars Programme, as the differences in growth may be due to other factors that affect growth. Therefore, we have applied econometric methods in order to identify and estimate the causal impact of Eurostars participation on
firms’performance.
The figure to the right shows the evolution of average employment across a period of eight years for funded Swiss SMEs and a constructed control group: four years prior to three years after the project start year. The results suggest that Eurostars participation boosted employment in the first three years after the project start. If we take the figure at face value, the increase in employment appears to be around 5 FTEs.
Employing an econometric model, the estimated effect of Eurostars participation on employment is roughly 12 percent in the project start year and about 17
–19 percent in the first three years after project start. These effects are statistically significant. In other words, Eurostars funding appears to have increased employment growth among approved SMEs quite substantially.
The econometric results on Danish data confirm that Eurostars has a positive impact on
employment. The effects on turnover, exports, investments and labor productivity is less
clear, and the results are quite sensitive to even small changes in the model. Partly because
the results are based on a relatively small number of treated observations.
Executive Summary
Eurostars is well aligned with the national research and innovation programmes
Eurostars support SMEs and international projects in the early stage of research and innovation (R&I). The programme acts as a catalyst for engaging SMEs in more collaborative R&I-activities. We find that many Danish participants in Eurostars also participate in other key innovation programs, both national and Horozon 2020.
Generally we find that the share of firms that participate in these programs is higher after firms have completed a Eurostars project. Interestingly, the same is true for the rejected applicants. Many of these have participated in other programs after being rejected by Eurostars.
In Switzerland The Eurostars programme complements two other main R&I support programmes: Innosuisse R&D project support as well as Horizon 2020. By providing access to direct R&D funding for international breakthrough innovation projects, the Eurostars programme targets key objectives of the innovation policy in Switzerland,
These key objectives are:
•
increasing
SME’sinvestments in R&I,
•
stimulating
SME’scooperation with universities, knowledge institutions and other companies
•
facilitating Swiss participation in international cooperation
•
strengthening the
firms’absorptive capacity by increasing the highly educated workforce.
Learnings and recommendations for future studies
A key learning from this project is that it will take another couple of years before we have sufficient data to measure Eurostars impact on firms performance after the projects end.
There are still too few firms that have reached the marked with the new solutions and products, even though the programme started in 2008. There are three main reasons for this lack of data.
First of all, relatively few projects started in the initial years, and a large part of the projects started in 2015 and the following years. Secondly, it takes five years or more to complete the projects and implement the solutions or introduce new products to the market. And finally there is a lag of up to two years before data on firm performance in available from the statistical bureaus.
Future evaluations of the programme should add further indicators to the analyses to measure the programme's effectiveness in terms of RD investments and innovation output performance (e.g. Czarnitzki & Hussinger, 2018; Beck et al. 2016). To enable such an enriched evaluation, involved policy makers might initiate a systemic data monitoring, which could be guided by a data monitoring board consisting of policymakers and officers from statistical bureaus together with evaluation experts.
Such enriched data would allow extending the evaluation of the programme in terms of
providing more detailed evidence about the legitimacy of the programme and effectiveness
of the policy design. Second, it would also allow for improved, evidence-based policy
consulting. This would be possible by studying the effectiveness of the funding in terms of
what projects to support (e.g. market vs. technology oriented projects; consortia of the
projects) and what firms to support (e.g. SMEs vs. large firms;
”pickingwinners vs. catching
up”).Eurostars in Switzerland at a glance
Eurostars supports international R&D-projects where participants from Switzerland collaborate to develop new products, services and processes.
Eurostars’ raison d'être purpose is that the
firms’level of innovation and thereby growth increases.
The programme is aimed at SMEs, which often have financial and capacity constraints that larger firms may easier overcome (see e.g. Spescha & Wörter 2018).
The first projects in Switzerland started in 2008. A total of 400 projects with Swiss participants from industries and universities have started since then.
Relatively few projects started in the first six years, but the number of annual projects with Swiss firm participation has so far topped in 2017 with 43 projects. The projects typically last about three years.
More than one third of the projects are in biotech.
Other common areas are industrial technology and ICT, which makes up about 53 percent of the projects.
We have tracked the Eurostars
firms’performance to see if they grow faster than comparable firms. In particular, we investigate if their R&D investment, R&D employment, turnover, net profit and total employment and productivity increases faster than non-approved Eurostars SMEs as well as in terms of employment than the average Swiss SMEs.
Not conclusive, but there are substantial signals for the effectiveness of the programme. The econometric treatment analysis yield a substantial positive impact on employment. The difference-in- differences estimation isolates causal effects on employment that are observed at the time after project start and increase over time.
Approximately, the increase amounts to 5 FTEs on average for the treated firms after three years after project start. The analysis is restricted to FTE employment due to data limitations.
A purely descriptive analysis compares the development of economic outcomes of funded Eurostars firms to non-approved Swiss Eurostars firms. We see that, on average, R&D investments, R&D employment and net profit increase after project start and are substantially higher in Eurostars firms than in rejected Swiss Eurostars SMEs. Average turnover increases as well, but remains below the level of non- approved Swiss Eurostars SMEs.
256 partners from Swiss enterprises, 93 partners from Swiss universities and 47 partners from other research institutes have participated in Eurostars projects. Several of these have participated in more than one Eurostars project.
236 of the firms are SMEs and 20 are large enterprises. 57% of the firm applications come from micro sized firms (fewer than 10 full time equivalent employees (FTEs)) and another 26%
from small sized firms (fewer than 50 FTEs).
Two out of three Eurostars funded firms had a turnover of less than 2 million euro and a group of 23.2% firms had no earnings the year their project started.
Overall, the Eurostars firms have on average a similar turnover, but less employees compared to the average Swiss SMEs before the project starts.
The projects The participants The impact
9
Eurostars in Denmark at a glance
Eurostars supports international R&D-projects where participants from Eurostars countries collaborate to develop new products, services and processes. Eurostars’ raison d'être is that the
firms’level of innovation and thereby growth increases.
The program is aimed at SMEs, which often have financial and capacity constraints that larger firms may easier overcome.
The first projects in Denmark started in 2008. A total of 224 projects with Danish participants have started since then. Relatively few projects started in the first six years, but in 2015 the number of annual projects more than doubled and have so far topped in 2017 with 38 projects. The projects last about three years.
More than one third of the projects are in biotech.
Other common areas are industrial technology and ICT, which makes up about 40 percent of the projects.
We have tracked the Eurostars
firms’performance to see if they grow faster than comparable firms. In particular we wish to investigate if their turnover, exports, employment and productivity increases faster.
There are indications of a positive impact. The majority of the firms believe the projects were successful and overall they grow significantly faster than their peers in terms of employment, turnover, export and productivity in the years immediately after the projects start.
Econometric analysis confirms that approved SMEs employ more people when we take account to other factors that may spur growth. But the econometric evidence of effects on turnover, export and productivity is less clear and not robust.
The impact measurement is limited by lack of data. Only few of the projects have reached the market yet. This is certainly true for the projects started after 2013 in Eurostars 2 given that the projects last 3 years and it takes an additional 2 years or more to reach the market and an additional 1-2 years before the impact can be detected in the national statistical databases. There are therefore yet too few observations to statistically conclude if Eurostars help firms perform better or not. In a couple of years there will be better data for the performance after the projects finish and even reach the market. It may be worth reexamining the possibilities for making a proper statistical evaluation in the fall 2020 or 2021.
234 partners from Danish firms, 46 partners from universities and 62 partners from other research institutes have participated in Eurostars projects.
Several of these have participated in more than one Eurostars project.
Almost all of the firms were SMEs and 9 out of 10 were small or micro sized (fewer than 50 employees).
Two out of three firms had a turnover of less than 2 million euro and a smaller group (4%) had no earnings the year their project started. This reflects that some of the firms are established to develop and market the technology in focus of the particular projects.
Overall, though, the Eurostars firms have significantly more employees as well as a higher turnover and export than average SMEs in Denmark.
The projects The participants The impact
Part 1 – Descriptive Analysis
1. Eurostars in the Danish &
Swiss innovation landscape
13
What is a Eurostars project?
Eurostars is
Europe’slargest collaborative programme focused on applied research and development for small- and medium-sized enterprises (SMEs). The purpose is to promote innovation activities and international cooperation by enabling SMEs to conduct joint research and innovation. The programme is market oriented and product market introduction is expected within two years after project completion.
A Eurostars projects have a minimum of two participants from at least two Eurostars countries. The project leader («main participant») is an R&D-performing SME and a minimum of 50% of the project activities must be conducted by the R&D performing SMEs. However, other participants such as other SMEs, universities, research institutes and large companies can also participate in the programme.
The qualified projects are selected among a group of applicants after a thorough evaluation of the applications. This includes a preliminary eligibility check, an expert evaluation and a rating made by an independent panel of experts. The qualified applications with the highest ratings above a score threshold are approved for funding until the funding budget from the participating countries is spent.
Eurostars is a joint programme between EUREKA and the European Union and is funded by 36 of
EUREKA’smembers and partner countries and the European Union through Horizon 2020.
Most of the participating countries are European, however, Canada, Israel, Turkey, South Africa and South Korea are also part of the programme. The combined funding budget for Eurostars in Horizon 2020 is
€1,2 billion. The Eurostars programme started in 2007 under the7th EU Framework Programme for Research and Innovation.
Danish partner
Swiss partner Canadian
partner
Eurostars connects research intensive SMEs with other SMEs and other types of partners
from 36 different countries – here is an illustrative example with three participants:
What kind of impact do we expect from Eurostars projects?
In this evaluation we examine if Eurostars have a positive impact on firms performance. The rationale for Eurostars is illustrated below including examples of the key performance indicators we use to measure the impact of Eurostars on the participating companies. We do not have sufficient data to measure the impact on all these indicators. This will be elaborated later in the report.
The projects last up to three years and thereafter it will typically take an additional two years to market the new solutions. For example a new product or service that generates sales or a new process or technology that benefits the firms productivity. Therefore, we expect to see the full impact of the projects five years or later after the projects start. But, we may see some changes before that as a result of learning and new contacts gained in the application phase and project phase. For example a participant may get new contacts in another country that leads to export of existing products and services. The rejected applicants may also benefit from learning and new connections from the application phase.
In this impact study we have access to unique firm and project level data from Eureka and national statistical bureaus. These data have detailed information about the firms before and during the projects. There are yet limited data for the
firms’performance for the period after the new solutions reach the market. Therefore, it is not yet possible to fully determine the long term impact of Eurostars on
firms’performance.
Within two years the new solution is implemented in the companies production line or is marketed and
generates sales
•
No. of projects
•
No. of participants from different sector, size and age groups etc.
•
Investments
•
Employment
•
New products and services
•
Participation in other R&D programmes
•
Turnover
•
Exports
•
Employment
•
Productivity KEY
PERFORMANCE INDICATORS PROJECT PHASE
DATA AVAILABLE
FOR EVALUATION Full coverage. Main data
source is Eureka’s database.Very high coverage. Main data source is firm level data from statistical bureaus.
Very high coverage. Main data source is final reports from the participants.
Few observations. Main data source is firm level data from statistical bureaus and market impact reports from participants.
At the end of the project there is a solution (for example a new technology) ready for market introduction within two years The companies execute R&D projects.
This phase can take up to three years.
Eurostars enables cooperation between companies and institutions
from different countries
15
A catalyst for R&I activities – evidence from Denmark
The Eurostars program is well aligned with the key objectives for the Innovation Fund Denmark, which are to:
- increase
SME’sinvestments in research and innovation (R&I),
- facilitate
SME’scooperation with universities, knowledge institutions and other companies on innovation and new technologies
- facilitate Danish participation in international cooperation on research and development of new technology and innovation
- increase the share of highly educated staff in companies.
Eurostars support SMEs and international projects in the early stage of R&I. The figures in the illustration indicates that Eurostars acts as a catalyst for engaging SMEs in more collaborative R&I activities, regardless whether the application results in rejections or approved.
A significant share of the Eurostars firms (participants) and rejected applicants have participated in 3 Danish programs and Horizon 2020.
Grand Solutions is a research and innovation programme often used by larger firms and organizations, Industrial Researcher invests in Industrial PhD and Postdoc projects, and InnoBooster is an SME program close to market. Horizon 2020 is the biggest EU Research and Innovation Programme.
Generally we find that the share of firms that participate in Horizon 2020 and Grand Solutions is higher after firms have completed a Eurostars project compared to before.
This is true for both the participants and rejected applicants.
Source: Innovation Fund Denmark and Cordis
Eurostars
Before After
11 % Horizon 2020 Horizon 2020 17 %
7 % Grand Solutions Grand Solutions 9 %
6 % Horizon 2020 Horizon 2020 11 %
5 % Grand Solutions
6 % Grand Solutions 15 % InnoBooster
13 % Industrial Researcher
9 % InnoBooster
9 % Industrial Researcher 188
participants
373 applicants who where
not approved 13 % InnoBooster
10 % Industrial Researcher
6 % InnoBooster
5 %
Industrial Researcher
A catalyst for R&I activities in Switzerland
The Eurostars programme complements two other existing main Research & Innovation (R&I) support programmes: Innosuisse R&D project support (which provides practice- oriented indirect R&D subsidies particularly for SMEs) and Horizon 2020 (which is the 8th EU Framework Programme for Research and Innovation). By providing access to direct R&D funding for international breakthrough innovation projects, the Eurostars programme targets key objectives of the innovation policy in Switzerland, specifically:
•
increasing
SME’sinvestments in R&I,
•
stimulating
SME’scooperation with universities, knowledge institutions and other companies
•
facilitating Swiss participation in international cooperation
•
strengthening the
firms’absorptive capacity by increasing the highly educated workforce.
Recent studies have found empirical evidence of the effectiveness of Swiss innovation promotion in increasing private R&D investment and radical innovation performance in companies (Beck et al. 2016). However, these studies have highlighted that
firms’engagement in collaboration lead to ambiguous results (e.g. Beck & Lopes Bento, 2016). In the past, R&D project support has been predominantly provided by Innosuisse. Innosuisse offers indirect financial support for firms, which means the (mostly national) scientific partner of a supported firm receives the financial aid.
Horizon 2020 introduced new programmes fostering the access of SME to finance innovation besides the financial support for Eurostars. They are a) the mono-beneficiary SME instruments and pilot calls of the European Innovation Council as well as b) the Fast Track to Innovation programme fostering R&D cooperation like Eurostars. Swiss SME can access these instruments only since 2017 due to the partial association of Switzerland to Horizon 2020 in the years 2014
–2016. The participation figures of Swiss SME to the Horizon 2020 instruments show a similar positive trend as for Eurostars underlining the need of Swiss SME for finance to innovate.
Illustration: Innosuisse, SERI
The complementarity of Eurostars to the Horizon 2020 SME instruments lies in the facts that:
•
the participation of Switzerland to Eurostars is open, whether or not Switzerland is associated to the EU Framework Programmes for R&I
•
the combination of national and EU funding enlarges the financial volume allowing a success rate for funding of more than 30% compared to the Horizon 2020 programmes where the success rate can fall below 10%.
•
Non-European countries such as Canada, South Korea and South Africa participate at Eurostars providing a more global cooperation than in the framework of Horizon 2020 programmes.
Eurostars addresses one of the major barriers of SMEs for innovation, which are the financial constraints (e.g. Spescha & Woerter, 2018). Through the international collaboration, Eurostars projects generate knowledge spillovers from international collaboration partners from industry and scientific institutions. As reported in the R&I report for Switzerland (Spescha & Woerter, 2018), Swiss firms have strengthened their collaboration with international partners over time, and there is an increasing importance of international knowledge sources for the promotion of innovation and productivity in Switzerland (Arvanitis et al., 2019).
Beyond the direct financial support, Eurostars enables companies to strengthen their absorptive capacity by increasing their highly educated workforce in R&D activities. Sufficient levels of absorptive capacity is the key performance drivers for Swiss private enterprises, which benefit from knowledge and technology exchange activities between private enterprises and scientific institutions (Beck, Hulfeld, Spescha & Woerter, forthcoming).
Notably, the Eurostars programme complements existing policy instruments by its international
character, and the possibility to directly support innovation activities of R&D intensive Swiss
firms (i.e. SMEs). It represents a milestone towards a more open innovation support policy in
Switzerland by offering complementary funding tools and sophisticated project monitoring (see
e.g. Bloom et al., 2019). Generally, we find that the Eurostars programme matches the key
priorities of Swiss innovation policy, in particular, it serves as a catalyst for growth orientation,
initiating international innovation activities, connecting with collaboration networks.
2. Participation in Eurostars
Number of approved firms in Eurostars projects
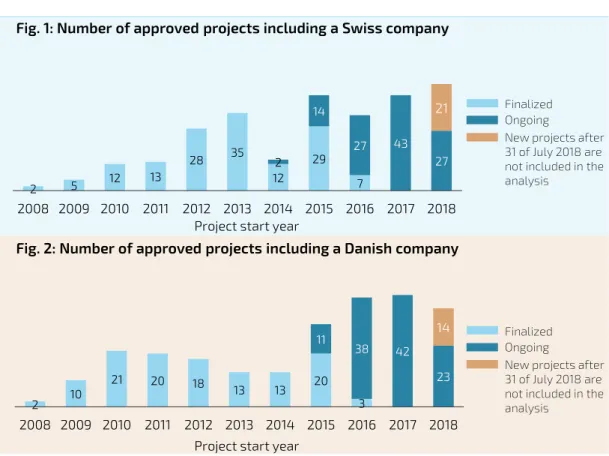
Since 2008 Swiss companies have been approved 256 times for Eurostars projects. In Denmark the number is 234.* The number of approved company projects per year has increased in both countries during the
programme’slifespan. Since 2015 the number of annual projects has been above 30 in both countries.
Denmark and Switzerland have a similar number of approved projects per year. This is also true with respect to the status of the project, i.e. if the project is still ongoing or finalized.
*Only projects approved before 31 July 2018 are included in the subsequent analyses. Notice, if the same firm has participated in two different projects, it is counted as 2 approvals in the figures and tables.
Project start year
Project start year
Project status Switzerland Denmark
Finalized 143 120
Ongoing 113 114
Total 256 234
Project status of all projects with company participation
Fig. 1 and fig. 2 show the number of all Swiss and Danish firms for a given project start year that have been involved in approved projects and whether those projects have been finalized or are ongoing by the 31 of July 2018. If there is a project with two Swiss or Danish companies involved, the graph shows this as two “Swiss /Danish projects” in one year.
Fig. 1: Number of approved projects including a Swiss company
Fig. 2: Number of approved projects including a Danish company
2 10
21 20 18 13 13 20
3
11 38 42
23 14
2008 2009 2010 2011 2012 2013 2014 2015 2016 2017 2018
2 5 12 13
28 35
12 29
7 2
14
27 43
27 21
2008 2009 2010 2011 2012 2013 2014 2015 2016 2017 2018
Finalized Ongoing
New projects after 31 of July 2018 are not included in the analysis
Finalized Ongoing
New projects after 31 of July 2018 are not included in the analysis
19
Project duration – Switzerland and Denmark
Eurostars projects are intented to last up to three years. Almost two-thirds of the projects in Switzerland and Denmark are finalized within three years from the project start. Some projects appear to have a longer duration due to substantiated delays in the project approved by the corresponding authorities.
The project duration is very similar in Denmark and Switzerland. The average duration for Eurostars projects is approximately 30 months in both Denmark and Switzerland.
Half of the projects have been finalized before 30 months (2.5 years), both in Denmark and Switzerland.
Project duration Switzerland Denmark
Mean 30.6 months 30.0 months
Median 2.5 years 2.5 years
Minimum 0.5 years 1 year
Maximum 4.5 years 4 years
Switzerland Denmark
Project duration in years Share of projects completed (%)
2
10
30
21
33
4 1 2
15
31
18
29
5
2 0
10 20 30 40
1-1.5 1.5-2 2-2.5 2.5-3 3-3.5 3.5-4 >4
Project duration of Eurostars projects
Data Source: Eureka. Calculations: ETH Zurich, Swiss Economic Institute (KOF); B,S,S. Volkswirtschaftliche Beratung.
Technological areas
Biotech Energy Environment ICT
Industrial
Biotech Energy Environment ICT
Industrial
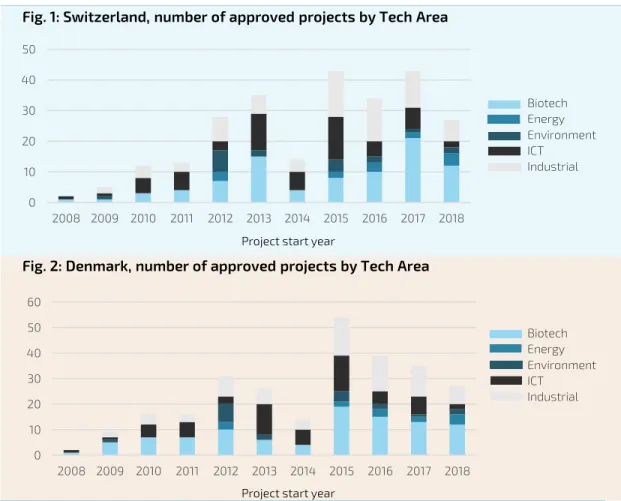
The Eurostars programme classifies the projects according to five different
technological areas. In terms of technological areas, Denmark and Switzerland show very similar characteristics. Figure 1 shows the number of approved projects of Swiss companies per technological area from 2008-2018 according to the year of the project start. Figure 2 shows the numbers for Denmark.
For Switzerland, from the beginning of the programme in 2008 until 2018, 86 (34%) of approved projects
–in which a Swiss firm has been involved
–have been assigned to Biotech, 75 projects (29%) to Industrial, 62 projects (24%) to ICT, 19 projects (7%) to Environment and 14 projects (5%) to Energy.
For Denmark, 93 (40%) of approved projects have been assigned to Biotech, 59 projects (25%) to Industrial, 42 projects (18%) to ICT, 22 projects (9%) to Environment and 18 projects (8%) to Energy.
Both figures and table: Data source: Eureka. Calculations: ETH Zurich, Swiss Economic Institute (KOF); B,S,S.
Volkswirtschaftliche Beratung.
Fig. 1 shows the number of approved project from Swiss companies per technological area in the year of the project start from 2008-2018. Fig. 2 indicates the number for Denmark from 2008-2018. The table summarizes the absolute number and percentages of the specific technological areas.
Technological area Switzerland Denmark
Biotech 86 (33.7%) 93 (39.7 %)
Energy 14 (5.5 %) 18 (7.7 %)
Environment 19 (7.4 %) 22 (9.4 %)
ICT 62 (24.2 %) 42 (18.0 %)
Industrial 75 (29.3 %) 59 (25.2 %)
Total 256 (100 %) 234 (100%)
15
3 7
1
1 3 3 4
3 2
Technological area of approved projects
Project start year
Project start year
Fig. 1: Switzerland, number of approved projects by Tech Area
Fig. 2: Denmark, number of approved projects by Tech Area
010 20 30 40 50
2008 2009 2010 2011 2012 2013 2014 2015 2016 2017 2018
0 10 20 30 40 50 60
2008 2009 2010 2011 2012 2013 2014 2015 2016 2017 2018
21
Market areas of approved Eurostars projects
Fig.2: Number of Danish approved projects by market area Fig. 1: Number of Swiss approved projects by market area
Environment ICT
Industrial Transportation Biotech
Construction Consumer Energy
Environment ICT
Industrial Transportation Biotech
Construction Consumer Energy
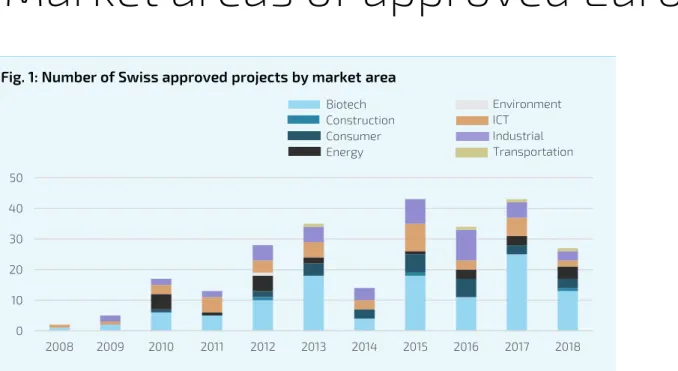
Beyond the technological area, approved projects in the Eurostars programme are classified according to the market area of the involved companies. Alike the technological areas, Denmark and Switzerland are also very similar in terms of market areas of the approved projects. Figure 1 indicates the number of approved projects of Swiss companies per market area from 2008-2018 according to the year the project starts. Figure 2 shows the numbers for Denmark. The table summarizes the absolute number and percentages of the specific market areas.
Both figures and table: Data source: Eureka. Calculations: ETH Zurich, Swiss Economic Institute (KOF); B,S,S.
Volkswirtschaftliche Beratung.
Fig. 1 shows the number of approved project from Swiss companies per market area in the year of the project start from 2008-2018. Fig. 2 indicates the number for Denmark from 2008-2018. The table summarizes the absolute number and percentages of the specific market areas the companies operate. If there is a project with two Swiss or Danish companies involved, this is indicated as two “Swiss/Danish projects” in one year.
1 5
2 1
3 3
4
1
1 3
1
3 5
4 4
2 0
Market area Switzerland Denmark Market area Switzerland Denmark
Biotech 113 (44.1%) 107 (45.7%) Consumer 28 (10.9%) 23 (9.8%)
Environment 1 (0.4%) 4 (1.7%) Industrial 46 (18.0%) 33 (14.1%)
Construction 3 (1.2 %) 8 (3.4%) Energy 19 (7.4%) 21 (9.0%)
ICT 42 (16.4%) 27 (11.6%) Transportation 4 (1.6%) 11 (4.7%)
Total 256 (100%) 234 (100%)
0 10 20 30 40 50
2008 2009 2010 2011 2012 2013 2014 2015 2016 2017 2018
0 10 20 30 40 50
2008 2009 2010 2011 2012 2013 2014 2015 2016 2017 2018
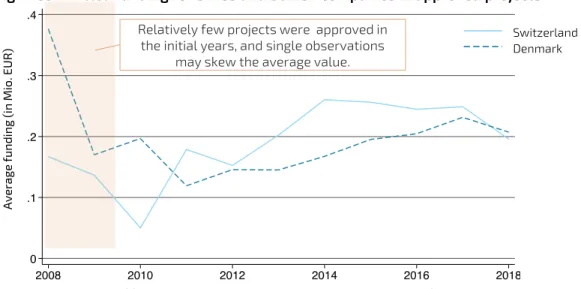
Eurostars financial support for approved projects
Fig. 1: Committed funding for Swiss and Danish companies in approved projects
Fig. 1 & 2 Source: Eureka. Calculations: ETH Zurich, Swiss Economic Institute (KOF); B,S,S. Volkswirtschaftliche Beratung.
The average public funding per firm partner amounts to 182k EUR in Switzerland and to 189k EUR in Denmark. This is close to the overall average of 181K EUR of the entire Eurostars programme. The average public funding for approved projects varies from 44k EUR in 2010 to 260K EUR in 2014 in Switzerland and ranges from 119k EUR to 377K EUR in Denmark.
Fig. 2 shows financial support grouped into classes. The money obtained by Swiss or Danish companies is defined by the committed public funding received from Eurostars.
Fig. 2: Committed funding per partner for Swiss and Danish companies in approved projects
Fig. 1 shows the mean of financial support in Switzerland and Denmark obtained for the approved project per year.
Average funding (in Mio. EUR)
Switzerland Denmark
Financial support (in Mio EUR)
Percentage of funded projects
Switzerland Denmark Relatively few projects were approved in
the initial years, and single observations may skew the average value.
23
Project cost coverage in Switzerland and Denmark
Data Source: Eureka. Calculations: ETH Zurich, Swiss Economic Institute (KOF); B,S,S. Volkswirtschaftliche Beratung.
Average coverage of total project costs through public funding (per partner)
The figure shows the funding ratio of the approved projects per partner, meaning the percentage of total project costs covered by Eurostar‘s committed financial support. The figures for 2018 are not presented due to missing information..
Average coverage
Project start year
The Eurostars programme provides direct financial support for the approved projects.
The graph on the right shows the average funding rate of the
projects per Danish and Swiss partners. The funding rate corresponds to the percentage of total project costs covered byEurostar‘scommitted financial support per partner.In Switzerland the average funding rate is 43.6% compared to 49.1% in Demark (period from 2008-2017). The funding rates varies between 34.0% and 48.0% for Swiss firms, and between 40.9% to 54.7% for Danish firms.
Overall in all Eurostars countries, on average around 45.8% of the total projects costs are covered by the Eurostars programme (period from 2011 to 2017).
The development of the average cost coverages does not differ systematically in
Denmark and Switzerland, and hence we conclude that the project cost coverage does
not introduce a systematic bias in the impact of funding. However, it can be seen that the
funding rates are a little bit higher in Denmark compared to Switzerland.
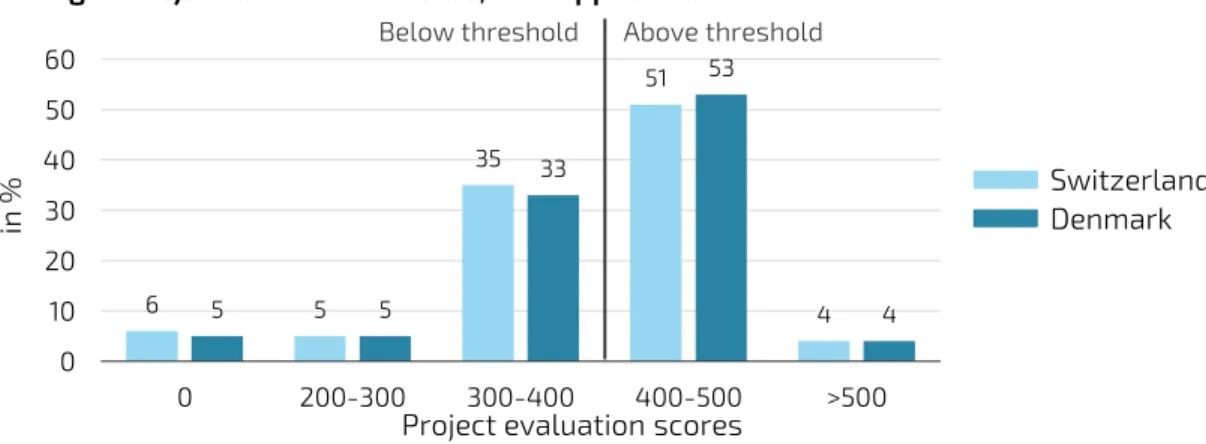
Project evaluation scores
Submitted applications are evaluated by an expert panel on a score from 0 to 600. Over all the scores for Swiss and Danish applications are remarkably similar. This finding rules out that the systematic differences in the quality of the projects might possibly affect the effect of funding.
The actual scores range from to 0 to 545 in Switzerland, respectively to 541 in Denmark.
Figure 1 groups Swiss and Danish firm applicants depending on their achieved evaluation scores for their Eurostars application.
Further data shows us that (not presented here), the average evaluation score of all applicants is 383 in Switzerland and 387 in Denmark. Half of the submitted Eurostars
applications obtain scores above 406 in Switzerland and 408 in Denmark.
6 535
51
5 5 4
33
53
4 0
10 20 30 40 50 60
0 200-300 300-400 400-500 >500
Switzerland Denmark
Project evaluation scores
in %
Below threshold Above threshold
Fig. 1: Project evaluation scores, firm applicants
Fig. 1 Data Source: Eureka. Calculations: ETH Zurich, Swiss Economic Institute (KOF); B,S,S.
Volkswirtschaftliche Beratung. Fig. 1 groups Swiss and Danish Firm applicants into groups depending on their score for their Eurostars application.
3. The Danish & Swiss
companies in Eurostars
Most Eurostars companies have less than 50 employees
Most companies in Eurostars projects are small or micro sized, which is defined as less than 50 full time employees (FTEs). 9 out of 10 Eurostars companies in Denmark and Switzerland have less than 50 FTEs. This is in line with the purpose of the Eurostars Programme that mainly funds and supports SMEs and their partners. There are few companies larger than 250 FTEs, and they participate as partnering companies.
Regarding size, the companies (applicants) with non-approved project proposals are similar to the companies that were approved.
Source: Eureka; Statistics Denmark; CVR; Swiss Federal Statistical Office (SFSO).
62%
29%
7% 2%
65%
25%
8% 3%
Micro (0-9 FTEs) Small (10-49 FTEs) Medium (50-249 FTEs) Large (250+ FTEs) Approved Not approved
Fig 2: Size of Danish Eurostars companies at start of project
49%
28%
10% 13%
55%
25%
8% 11%
Micro (0-9 FTEs) Small (10-49 FTEs) Medium (50-249 FTEs) Large (250+ FTEs) Approved Not approved
Fig 1: Size of Swiss Eurostars companies at start of project
27
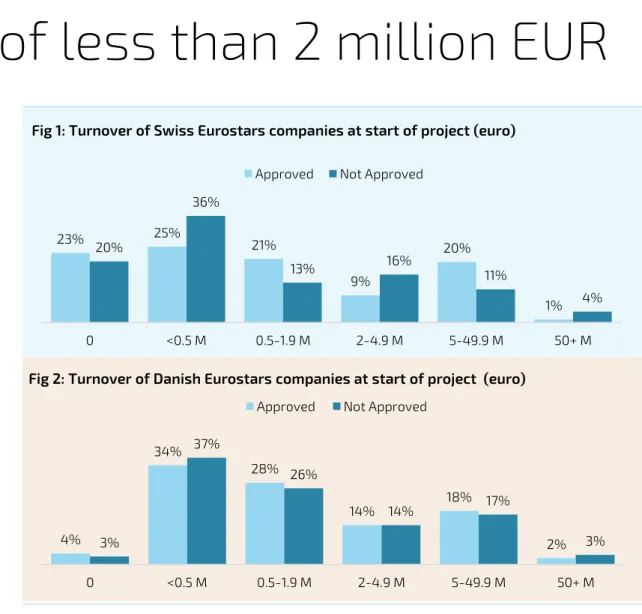
The majority has a turnover of less than 2 million EUR
Approximately 7 out of 10 Eurostars participants in Switzerland and Denmark had a turnover of less than 2 million EUR the year their project started. This is in line with the Eurostars Programme targeting
SME’s.In Denmark, 4 percent did not earn anything the year their project started. In Switzerland it is 23 percent. It is not clear what causes this difference, but part of it is likely driven by minor differences in the data used for the two countries.
Given the descriptive information in the figure, there seems to be no discrimination in terms of realized turnover in order to get the project approved. This means firm applicants with with non-approved projects are similar in turnover to approved enterprises.
Fig 2: Turnover of Danish Eurostars companies at start of project (euro) Fig 1: Turnover of Swiss Eurostars companies at start of project (euro)
4%
34%
28%
14% 18%
3% 2%
37%
26%
14% 17%
3%
0 <0.5 M 0.5-1.9 M 2-4.9 M 5-49.9 M 50+ M
Approved Not Approved
23% 25%
21%
9%
20%
1%
20%
36%
13% 16%
11%
4%
0 <0.5 M 0.5-1.9 M 2-4.9 M 5-49.9 M 50+ M
Approved Not Approved
Source: Eureka; Statistics Denmark; CVR; Swiss Federal Statistical Office (SFSO).
Note: The figure shows the turnover in the project start year. For not approved projects, the project start date is the intended project start date in the application form.
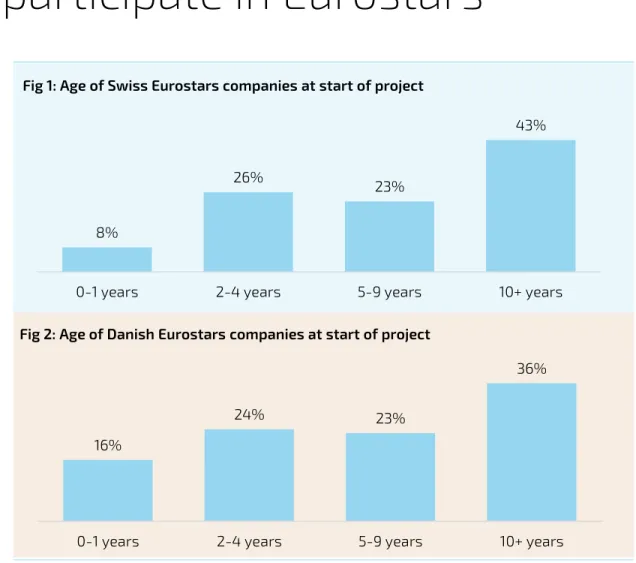
Both young and older companies participate in Eurostars
Both young and older companies participate in Eurostars. In terms of age, 43% of the Swiss and 36% of the Danish companies were established at least 10 years before their project started. At the end 8% and 16% of the participants in Switzerland and Denmark are less than one year old. This reflects that the participants are both new companies with new ideas and settled companies that know how to navigate the market and the field of research.
Source: Eureka; Statistics Denmark; CVR; Swiss Federal Statistical Office (SFSO).
Fig 2: Age of Danish Eurostars companies at start of project Fig 1: Age of Swiss Eurostars companies at start of project
8%
26% 23%
43%
0-1 years 2-4 years 5-9 years 10+ years
16%
24% 23%
36%
0-1 years 2-4 years 5-9 years 10+ years
29
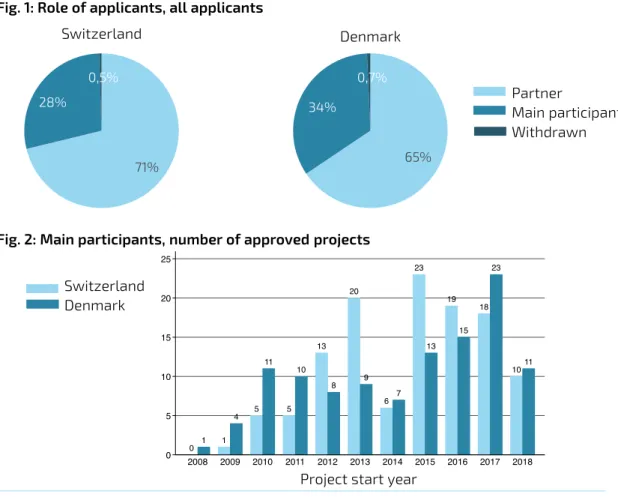
The role of Eurostars applicants
Switzerland Denmark
Fig. 1 & 2 Data Source: Eureka. Calculations: ETH Zurich, Swiss Economic Institute (KOF); B,S,S.
Volkswirtschaftliche Beratung.
A Eurostars applicant is characterized by its role within the Eurostars consortium. The project leader must be a R&D intensive SME and takes the role of a «main participant»
within the project whereas the other applicants take the role of a «partner» .
Literature points out that the role of a partner affects the outcome of a consortium participants (see e.g. Gulati, 1995). Figure 1 shows the percentages of applicants by the role as a main participant or partner. Figure 2 shows the number of projects with a Swiss and Danish main participant per project start year.
71% of Swiss applicants act as a partner, 28% as a main applicant (project leader). 65%
of Danish applicants are a partner, and 34% are a main applicant (project leader) within a Eurostars consortium.
The number of approved projects where a Swiss or Danish applicant act as a main participant has continuously risen since the start of the Eurostars programme in 2007. In 2017, 18 projects started with a Swiss main participant and 23 projects with a Danish main participant.
Project start year
Partner
Main participant Withdrawn Fig. 1: Role of applicants, all applicants
Fig. 2: Main participants, number of approved projects
65%
34%
0,7%
71%
28%
0,5%
Switzerland Denmark
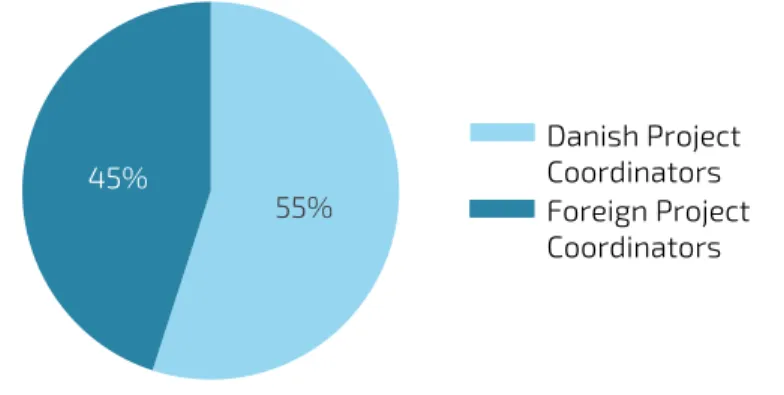
Relatively many project coordinators
Fig. 1 & 2 Data Source: Eureka. Calculations: Eureka.
Each Eurostars project has a coordinator who syndicates the project. The coordinator often has relatively large influence on the project, and may arguably get relatively large benefits from the project. However, this hypothesis have not been tested in this analysis.
About 40% of the projects with Swiss partners have a Swiss coordinator. And for
Denmark the share is 55%. Swiss Project
Coordinators Foreign Project Coordinators Fig. 1: Distribution of Coordinators 2008-2018 in funded projects with Swiss partners
Fig. 2: Distribution of Coordinators 2008-2018 in funded projects with Danish partners
45% 55%
40%
60%
Danish Project Coordinators Foreign Project Coordinators 336 funded projects:
261 funded projects:
31
The organizations that participate in Eurostar projects
Tab. 1 & Tab. 2 Source: Eureka. Calculations: ETH Zurich, Swiss Economic Institute (KOF); B,S,S.
Volkswirtschaftliche Beratung
Swiss organizations have participated 400 times in Eurostars projects since the first
Swiss projects in 2008. Of these, 224 are finalized. Note, that since more than one organization can participate in the same project, this number is higher than the total number of projects.
As shown in Table 1, the programme is mostly used by R&D intensive SMEs (R&D SMEs).
Universities and other research institutes are frequently chosen as project partner.
Type of organisation In approved projects In finalized approved projects
Large company 20 (5%) 8 (3.57%)
Other 4 (1%) 2 (0.9%)
R&D SME 230 (57.5%) 132 (58.9%)
Research Institute 47 (11.75%) 29 (12.9%)
SME 6 (1.5%) 3 (1.3%)
University 93 (23.25%) 50 (22.3%)
Total 400 (100%) 224 (100%)
Tab. 1: Swiss organisations in approved projects, number of participations
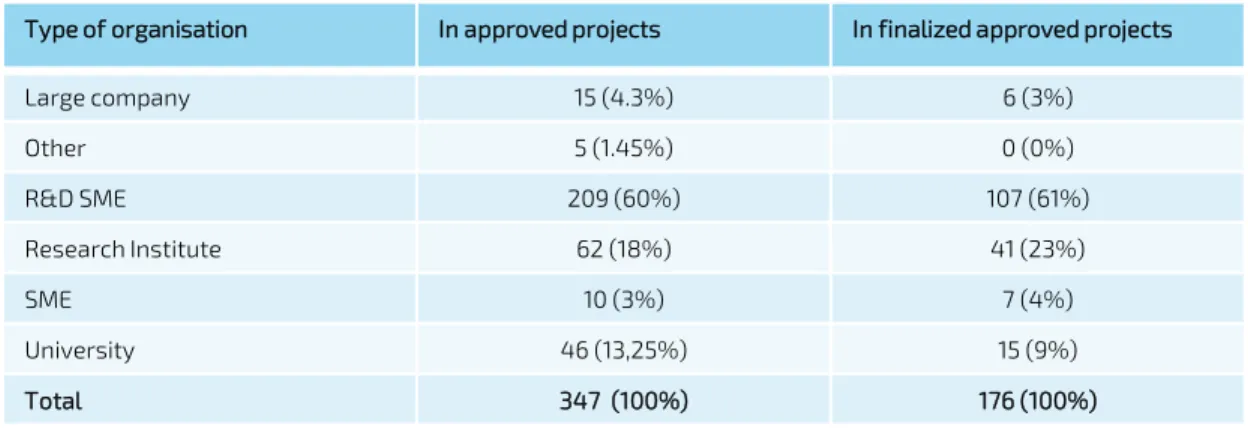
Type of organisation In approved projects In finalized approved projects
Large company 15 (4.3%) 6 (3%)
Other 5 (1.45%) 0 (0%)
R&D SME 209 (60%) 107 (61%)
Research Institute 62 (18%) 41 (23%)
SME 10 (3%) 7 (4%)
University 46 (13,25%) 15 (9%)
Total 347 (100%) 176 (100%)
The general picture is similar in Denmark. Danish organizations have participated in Eurostars projects 347 times. Most users are R&D intensive SMEs.
Universities participate relatively less, but this is countered by more participations by research institutes. The Danish Research and Technology Organizations (GTS) participate in several projects and contribute with knowledge and technical equipment, that to some extent are handled by universities in other countries.
Tab. 2: Danish organisations in approved projects, number of participations
R&D - Employees
Number of R&D employees in funded firms in Switzerland and Denmark Around 80% in Switzerland and 90% in Denmark of all participating firms in Eurostars
have less than 50 FTEs
–around half of the Eurostars firms in Switzerland and around 60% in Denmark have less than 10 FTEs. Given this background, Eurostars firms with approved projects are characterized by a relatively high number of dedicated R&D employees compared to their total employment. These findings hold for both countries, Switzerland and Denmark alike.
In absolute numbers, 54% of firms in Switzerland, respectively 71% in Denmark have less than 6 R&D employees. Notably, only 6% (Switzerland) and 5% (Denmark) of participating Eurostars firms have more than 25 employees assigned to R&D activities.
The figure shows the distribution of Swiss and Danish firms with approved projects classified by the number of R&D employees.
Number of R&D employees
Percentage of funded firms
Data Source: Eureka. Calculations: ETH Zurich, Swiss Economic Institute (KOF); B,S,S. Volkswirtschaftliche Beratung.
10%
44%
29%
2%
7%
2%
6%
15%
56%
11% 8%
4% 1%
5%
0 1-5 6-10 11-15 16-20 21-25 >26
Switzerland Denmark
33
Consortium size involving a Swiss or Danish main participant
One partner Two partners Three partners Four partners More than four partners
Fig. 1 & 2 Data Source: Eureka. Calculations: ETH Zurich, Swiss Economic Institute (KOF); B,S,S. Volkswirtschaftliche Beratung. Figures 1 & 2 show the number of approved projects of all Swiss (Fig. 1) and Danish main participants (Fig.
2) and with how many partners they have been working in the project.
The diversity of the collaboration alliance has an important role for the success of the collaboration (e.g. Beck & Schenker-Wicki, 2014; Gulati, 1995). According to the literature the main project leader provides a strong signal to the environment, and motivates other partners to engage in a collaboration (Lokshin et al., 2011).
The figures indicate the number of approved projects of all Swiss (Fig. 1) and all Danish main participants (Fig. 2) and show with how many partners they have been collaborating in the project.
While the number of approved projects with a Swiss or Danish main participant has been constantly increasing over time, the number of collaborating partners within a project has rather been stable over time and it is similar between Denmark and Switzerland. In Switzerland, 83% of the main participants collaborate with up to three partners, respectively 88% in Denmark.
One partner Two partners Three partners Four partners More than four partners Project start year
Project start year
Fig. 1: Number of cooperation partners of projects with a Swiss main participant
Fig. 2: Number of cooperation partners of projects with a Danish main participant
Partners’ organisation types involving a Swiss and Danish main participant
Fig. 1 & 2 Data Source: Eureka. Calculations: ETH Zurich, Swiss Economic Institute (KOF); B,S,S. Volkswirtschaftliche Beratung. The figures show the type of organisation a Swiss main participant (Fig. 1) and Danish main participant (Fig. 2) collaborates within the consortium. The pool of partners refers to all organisation types, and is regardless of the status of the project or whether the project has been approved or not.
The alliance partner portfolio has a strong impact on innovation generated by the collaboration consortium (e.g. Beck & Lopes-Bento, 2016; Phelps, 2010; Sampson, R. C.
(2007). We are to characterize the consortium by different organisation types such as R&D intensive SMEs, large companies, universities and other research institutions.
Figures 1 & 2 show the type of organisation a Swiss main participant (Fig. 1) and Danish main participant (Figure 2) collaborates within the consortium.
For example, 42% of the organizations that Swiss main participants collaborate with are R&D intensive SMEs. 46% are universities or research institutes.
The picture is similar for Danish main participants. 46% of their partners are R&D intensive SMEs and 38% are universities or research institutes.
In sum, the composition of the consortium appears comparable among Swiss and Danish main participants.
Fig. 1: Organization types, partners of Swiss main participants
Fig. 2: Organization types, partners of Danish main participants
43%33%
13%
6% 4%
R&D SME University
Research Institute Large Company SME
Other
46%
21%
17%
7%
5% R&D SME
University
Research Institute Large Company SME
Other
35
Partners’ geographical region of origin
Fig. 1 & 2 Data Source: Eureka. Calculations: ETH Zurich, Swiss Economic Institute (KOF); B,S,S. Volkswirtschaftliche Beratung. The figures show the partners’ geographical region of Swiss (Fig. 1) and Danish main participants (Fig. 2) . The pool of partners refers to all firm partners, and is regardless of the project status or whether or not the project has been approved.
Fig. 1: Geographical region of partners’ origin of Swiss Main participants
Denmark EU Non-EU Fig. 2: Geographical region of partners’ origin of Danish Main participants
Switzerland EU Non-EU
The figures show the
partners’geographical region of origin of Swiss (Fig. 1) and Danish main participants (Fig. 2).
As can be seen from Figure 1, the majority of partners of Swiss main participants originates from abroad. Only about 20% of the partners come from Switzerland. Most of the foreign partners come from EU-member countries.
Figure 2 draws a similar picture for Denmark. However, the share of partners originating from Denmark is higher (33%). About 13% of the partners come from countries outside EU, namely Canada, Israel, Turkey, South Africa and South Korea, which also participate in Eurostars.
Both figures highlight the openness of the economy in Switzerland and Denmark in particular when it comes to the transfer of knowledge and technology.
Project start year Project start year
Number of Partners (Firms) Number of Partners (Firms)
5 4 8 11
1
10 9 7
2 14
9
34 31
9
36
25 31
16 0
1
1 4
0
4
2
2
3
2010 2011 2012 2013 2014 2015 2016 2017 2018*
6 6 4 8 7 9 13 20
12 19
11 9
10 10
25 17
28
11 1
2 4
4 3
2 5
12
1
2010 2011 2012 2013 2014 2015 2016 2017 2018*
Partners’ country of origin involving a Swiss or Danish Main applicant
Fig. 1: Country of origin of the partners of Swiss main participants Fig. 2: Country of origin of the partners of Danish main participants
Fig. 1 & 2 Data Source: Eureka. Calculations: ETH Zurich, Swiss Economic Institute (KOF); B,S,S. Volkswirtschaftliche Beratung. The figures show the partners’ country of origin of Swiss (Fig. 1) and Danish Main participants (Fig. 2). The pool of partners refers to all firm partners, is regardless of the project status, but refers to approved projects only.
The figures show the
partners’country of origin of Swiss (Fig. 1) and Danish (Fig. 2) Main partners.
Figure 1 exhibits that 91% of firms as a partner of Swiss main participants come from outside Switzerland. A considering number of firms come from neighbouring countries such as Germany (23%), France (11%), and Italy (5%). Notably, 15% of the partners come from Nordic countries, such as Sweden (10%) and Denmark (5%).
Fig. 2 mirrors the picture in the case of Denmark, however only 76% of firms as a partner of Danish main participants come from outside Denmark. Many firms come from neighbouring countries such as Sweden (13%), Germany (13%) or Norway (5%). Notably, 6% of the partners come from the UK.
Other countries;
33%
Germany; 23%
France; 11%
Sweden; 10%
Switzerland; 9%
Italy; 5%
Denmark; 5%
The Netherlands;
3%
Other countries;
32%
Denmark; 24%
Sweden; 13%
Germany; 12%
United Kingdom;
6%
The Netherlands;
5%
Norway; 5% Switzerland; 3%
37
More than 4 out of 5 achieve successful project result
Fig. 1: 85% of Swiss participants say the project result was successfully achieved Fig. 2: 80% of Danish participants say the project result was successfully achieved
80%
20%
Yes No
Question: ”Is the project result (product, process/services) successfully achieved?”Question: ”Is the project result (product, process/services) successfully achieved?”
82%
18%
Yes No
Source: Eureka, Final Impact Reports.
Note: The data stems from the first round of funding (E-1). Fig. 1: N = 93. Fig. 2: N = 105.
Almost all Eurostars firms submit a Final Reports (FIR) when the projects are finalized. The FIRs are mandatory and each participant has to fill them out right after project end or face a reduction
in the funding. The questions in the FIR focus primarily on the results of the projects. For example, the participants are asked if the outcomes of the project are what they expected before
submitting the application and if the project results are successfully achieved. According to the FIRs, 4 out of 5 participants agree that the project result is successfully achieved, meaning that
the majority have had a immediate positive result from participating in the Eurostars Programme.
Case: A Danish-Swiss project
Eurostars promotes international cooperation. The project SensiScreen Lung is one of many examples of how companies, universities and other organizations have joined forces to develop new solutions. In this project PentaBase, a Danish biotech company, collaborated with Danish Technological Institute and Instituto Cantonale Di Patologia, a Swiss reference laboratory. The project ran from 2013 to 2016. There was high expectations for this project. The application received the best evaluation out of 600 applications.
Pentabase has participated in five Eurostars projects. When they began they had 3 full time employees
–they now have 14.
PentaBase needed access to clinical trials to develop new method to screen for lung cancer
The purpose of the project was to carry out sensitive diagnostics for lung cancer patients using biopsies to be able to monitor the patients. PentaBase applied for the Eurostars Programme as they needed access to clinical trials to carry out the project, and they found the best way to get this was to team up with a hospital, that had access to patients. The Swiss laboratory had this.
Outcome and impact
PentaBase introduced a new screening method to the market in the fall 2018, approximately two years after the project end. The product generates turnover, half of which comes from exports, and they have increased staff with 3 full time employees as a result of the project. They expect to increase their total revenue by 40 percent the following year, of which 30 percent can be credited to this project/product.
In addition, the project have resulted in an expansion of
PentaBase’snetwork, a patent and three forthcoming articles. However, the product has only been on the market for less than a year, and therefore the full impact have absolutely not been realized yet.
According to PentaBase, they could not have developed the product without the help and funding they received from
Eurostars. At least not at the same speed.
4. Descriptive economic
indicators
40