Review
Functional Characterization of Rare RAB12 Variants and Their Role in Musician’s and Other Dystonias
Eva Hebert
1,†, Friederike Borngräber
1,2,3,†, Alexander Schmidt
1,2,3, Aleksandar Rakovic
1, Ingrid Brænne
4, Anne Weissbach
1, Jennie Hampf
1, Eva-Juliane Vollstedt
1, Leopold Größer
5, Susen Schaake
1, Michaela Müller
4, Humera Manzoor
1,6, Hans-Christian Jabusch
7,
Daniel Alvarez-Fischer
1, Meike Kasten
1,8, Vladimir S. Kostic
9, Thomas Gasser
10,
Kirsten E. Zeuner
11, Han-Joon Kim
12, Beomseok Jeon
12, Peter Bauer
13, Eckart Altenmüller
14, Christine Klein
1and Katja Lohmann
1,*
1
Institute of Neurogenetics, University of Luebeck, 23538 Luebeck, Germany;
eva.hebert@neuro.uni-luebeck.de (E.H.); friederike.borngraeber@charite.de (F.B.);
alexander.schmidt@charite.de (A.S.); aleksandar.rakovic@neuro.uni-luebeck.de (A.R.);
anne.weissbach@neuro.uni-luebeck.de (A.W.); jennie.hampf@neuro.uni-luebeck.de (J.H.);
jule.vollstedt@neuro.uni-luebeck.de (E.-J.V.); susen.schaake@neuro.uni-luebeck.de (S.S.);
humi_902@yahoo.com (H.M.); daniel.alvarez@neuro.uni-luebeck.de (D.A.-F.);
meike.kasten@neuro.uni-luebeck.de (M.K.); christine.klein@neuro.uni-luebeck.de (C.K.)
2
Kurt Singer Institute for Music Physiology and Musicians’ Health, Hanns Eisler School of Music Berlin, 10595 Berlin, Germany
3
Berlin Center for Musicians’ Medicine, Charité—University Medicine Berlin, 10117 Berlin, Germany
4
Institute for Integrative and Experimental Genomics, University of Luebeck, 23538 Luebeck, Germany;
imb9y@eservices.virginia.edu (I.B.); michaela.mueller@iieg.uni-luebeck.de (M.M.)
5
Department of Dermatology, University of Regensburg, 93053 Regensburg, Germany;
Leopold.Groesser@klinik.uni-regensburg.de
6
School of Biological Sciences, University of the Punjab, Quaid-i-Azam Campus, Lahore 54590, Pakistan
7
Institute of Musician’s Medicine, University of Music, 01069 Dresden, Germany;
Hans-Christian.Jabusch@hfmdd.de
8
Department of Psychiatry and Psychotherapy, University of Lübeck, 23538 Lubeck, Germany
9
Department of Neurodegenerative Diseases, Clinical Center of Serbia, 11000 Belgrade, Serbia;
vladimir.s.kostic@gmail.com
10
Department of Neurology, University of Tübingen, 72076 Tubingen, Germany;
thomas.gasser@uni-tuebingen.de
11
Department of Neurology, University of Kiel, 24105 Kiel, Germany; k.zeuner@neurologie.uni-kiel.de
12
Department of Neurology, Movement Disorder Center, Seoul National University Hospital, Seoul 03080, Korea; cupofcoffee@daum.net (H.-J.K.); brain@snu.ac.kr (B.J.)
13
Centogene AG, 18057 Rostock, Germany; peter.bauer@centogene.com
14
Institute of Music Physiology and Musician’s Medicine, Hanover University of Music, Drama and Media, 30175 Hanover, Germany; eckart.altenmueller@hmtm-hannover.de
* Correspondence: katja.lohmann@neuro.uni-luebeck.de; Tel.: +49-451-3101-8209
† These two authors contributed equally to this study.
Academic Editor: Dale R. Nyholt
Received: 13 September 2017; Accepted: 17 October 2017; Published: 18 October 2017
Abstract: Mutations in RAB (member of the Ras superfamily) genes are increasingly recognized as cause of a variety of disorders including neurological conditions. While musician’s dystonia (MD) and writer’s dystonia (WD) are task-specific movement disorders, other dystonias persistently affect postures as in cervical dystonia. Little is known about the underlying etiology. Next-generation sequencing revealed a rare missense variant (c.586A>G; p.Ile196Val) in RAB12 in two of three MD/WD families. Next, we tested 916 additional dystonia patients; 512 Parkinson’s disease patients; and 461 healthy controls for RAB12 variants and identified 10 additional carriers of rare missense changes among dystonia patients (1.1%) but only one carrier in non-dystonic individuals
Genes2017,8, 276; doi:10.3390/genes8100276 www.mdpi.com/journal/genes
(0.1%; p = 0.005). The detected variants among index patients comprised p.Ile196Val (n = 6);
p.Ala174Thr (n = 3); p.Gly13Asp; p.Ala148Thr; and p.Arg181Gln in patients with MD; cervical dystonia; or WD. Two relatives of MD patients with WD also carried p.Ile196Val. The two variants identified in MD patients (p.Ile196Val; p.Gly13Asp) were characterized on endogenous levels in patient-derived fibroblasts and in two RAB12-overexpressing cell models. The ability to hydrolyze guanosine triphosphate (GTP), so called GTPase activity, was increased in mutants compared to wildtype. Furthermore, subcellular distribution of RAB12 in mutants was altered in fibroblasts.
Soluble Transferrin receptor 1 levels were reduced in the blood of all three tested p.Ile196Val carriers. In conclusion, we demonstrate an enrichment of missense changes among dystonia patients.
Functional characterization revealed altered enzyme activity and lysosomal distribution in mutants suggesting a contribution of RAB12 variants to MD and other dystonias.
Keywords: musician’s dystonia; RAB12; GTPase; Transferrin receptor; lysosomal degradation
1. Introduction
Musician’s dystonia (MD) is a task-specific movement disorder that is characterized by painless muscle incoordination or loss of voluntary motor control while the musician is playing the instrument [1,2].
It occurs in professional instrumentalists with a prevalence of 1–2% [3]. About 20% of MD patients report a positive family history, including MD or writer’s dystonia (WD) [4]. WD is another form of a task-specific dystonia involving the fingers, hand, and/or forearm. Symptoms usually appear when a person is trying to do a task that requires fine motor movements, such as writing. Of note, MD may be accompanied by additional WD [5]. Thus, MD and WD may share a molecular cause.
However, little is known about the etiology of MD and WD and both environmental and genetic factors have been discussed. Among the environmental risk factors for MD, extensively trained maximal fine-motor skills and high levels of anxiety and perfectionism have received increasing attention over the past few years [6–8]. On the other hand, a considerable genetic contribution is suggested by its high heritability [4,5]. In a recent genome-wide association study, an intronic variant (rs11655081) in the arylsulfatase G (ARSG) gene was identified as a potential genetic risk factor [9].
However, known monogenic causes of segmental and generalized dystonia including mutations in TOR1A, THAP1, and GNAL have been excluded as a major cause in MD [4,10,11].
RAB12, member RAS oncogene family, is part of a large family of small guanosine triphosphate (GTP)-hydrolyzing enzymes (GTPases) that play an important role in vesicle transport and trafficking within cells [12,13]. RAB12 regulates the degradation of transmembrane proteins on the membranes of different cellular compartments including the Golgi complex, endosomes and lysosomes. One well characterized target of RAB12 degradation includes the transferrin receptor 1 (TFRC) [14–16]. RAB12 is highly expressed in the human brain (The Human Protein Atlas, http://www.proteinatlas.org/
ENSG00000206418-RAB12/tissue) and many RAB genes have been linked to neurological disorders.
For instance, mutations in RAB3 are associated with Warburg Micro syndrome [17], and functional impairments in RAB7 have been linked to Charcot-Marie-Tooth disease Type 2B [18]. More recently, mutations in RAB39B were postulated as a rare cause of Parkinson’s disease [19,20].
In the present study, we initially used next-generation sequencing (NGS) in three German families with autosomal dominantly inherited MD/WD to unravel the presumably monogenic disease cause.
We identified a likely pathogenic variant in the RAB12 gene in two out of three families. Genetic screening of unrelated patients revealed two additional RAB12 mutation carriers among MD patients.
To confirm a functional effect of the identified mutations, we analyzed the consequences of these RAB12
mutations on GTPase activity, its intracellular localization, lysosomal distribution, TFRC degradation,
and autophagy. Additional RAB12 variants were found in other dystonia patients but were largely
absent in the investigated controls as well as in publically available databases.
2. Materials and Methods
2.1. Subjects
The study was approved by the ethics committee at the University of Lübeck (Lübeck, Germany, No 04-180 from 1 July 2005). All participants gave written informed consent. We included a total of 1906 subjects (Table 1) comprising 241 professional musicians diagnosed with MD, 14 relatives from four MD families (Figure 1), 74 WD patients, 604 other dystonia patients (Table S1), 512 patients with Parkinson’s disease (PD), and 461 healthy controls from the population-based control cohort EPIPARK from Lübeck (Germany) [21]. All subjects were of European origin (mainly German) with the exception of 86 dystonia patients from South Korea. Three of the MD patients and their families (Families A–C, Figure 1) were previously reported [4,22] and originated from Germany. The diagnostic work-up of MD patients included a complete neurological examination and visual inspection while patients were playing their instruments. All other patients were diagnosed by movement disorder specialists in Lübeck, Kiel, Tübingen (Germany), Seoul (South Korea), and Belgrade (Serbia).
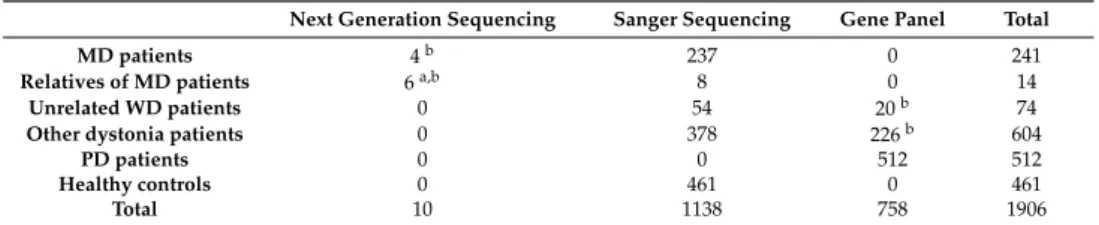
Table 1. Overview of the sequenced patient and control cohorts.
Next Generation Sequencing Sanger Sequencing Gene Panel Total
MD patients 4b 237 0 241
Relatives of MD patients 6a,b 8 0 14
Unrelated WD patients 0 54 20b 74
Other dystonia patients 0 378 226b 604
PD patients 0 0 512 512
Healthy controls 0 461 0 461
Total 10 1138 758 1906
MD: musician´s dystonia; WD: writer´s dystonia, PD: Parkinson´s disease; a includes 5 patients with WD;
bAll identified mutations were confirmed by Sanger sequencing and all available family members including unaffected were tested for the respective mutation by Sanger sequencing.
Genes 2017, 8, 276 3 of 19
dystonia patients but were largely absent in the investigated controls as well as in publically available databases.
2. Materials and Methods
2.1. Subjects
The study was approved by the ethics committee at the University of Lübeck (Lübeck, Germany, No 04‐180 from 1 July 2005). All participants gave written informed consent. We included a total of 1906 subjects (Table 1) comprising 241 professional musicians diagnosed with MD, 14 relatives from four MD families (Figure 1), 74 WD patients, 604 other dystonia patients (Table S1), 512 patients with Parkinson’s disease (PD), and 461 healthy controls from the population‐based control cohort EPIPARK from Lübeck (Germany) [21]. All subjects were of European origin (mainly German) with the exception of 86 dystonia patients from South Korea. Three of the MD patients and their families (Families A–C, Figure 1) were previously reported [4,22] and originated from Germany. The diagnostic work‐up of MD patients included a complete neurological examination and visual inspection while patients were playing their instruments. All other patients were diagnosed by movement disorder specialists in Lübeck, Kiel, Tübingen (Germany), Seoul (South Korea), and Belgrade (Serbia).
Table 1. Overview of the sequenced patient and control cohorts.
Next Generation Sequencing Sanger Sequencing Gene Panel Total
MD patients 4 b 237 0 241
Relatives of MD patients 6 a,b 8 0 14
Unrelated WD patients 0 54 20 b 74
Other dystonia patients 0 378 226 b 604
PD patients 0 0 512 512
Healthy controls 0 461 0 461
Total 10 1138 758 1906
MD: musician´s dystonia; WD: writer´s dystonia, PD: Parkinson´s disease; a includes 5 patients with WD; b All identified mutations were confirmed by Sanger sequencing and all available family members including unaffected were tested for the respective mutation by Sanger sequencing
Figure 1. Pedigrees of four musician´s dystonia (MD) families. Black symbols represent individuals with MD, gray symbols mark individuals with WD, the dotted filled symbol indicates an individual with possibly mild, generalized dystonia, and the question mark points to an individual that was initially reported to have dystonia which however was not confirmed upon re‐evaluation by two neurologists. L‐2329 did not agree to be neurologically examined. A photograph of L‐10289 illustrating her dystonic postures is shown in Figure S1. Patients of Family A were exome sequenced at Atlas Biolabs (superscript “E”) and three patients of Families B and C underwent genome sequencing at Complete Genomics (superscript “G”). Additional exome sequencing was performed for individuals of Families A, B, and D at Centogene (superscript“+E”). Mutational status for the
Figure 1. Pedigrees of four musician´s dystonia (MD) families. Black symbols represent individuals with MD, gray symbols mark individuals with WD, the dotted filled symbol indicates an individual with possibly mild, generalized dystonia, and the question mark points to an individual that was initially reported to have dystonia which however was not confirmed upon re-evaluation by two neurologists. L-2329 did not agree to be neurologically examined. A photograph of L-10289 illustrating her dystonic postures is shown in Figure S1. Patients of Family A were exome sequenced at Atlas Biolabs (superscript “E”) and three patients of Families B and C underwent genome sequencing at Complete Genomics (superscript “G”). Additional exome sequencing was performed for individuals of Families A, B, and D at Centogene (superscript“+E”). Mutational status for the p.Ile196Val mutation in RAB12 is indicated: +/+ for homozygous carriers; +/ − for heterozygous carriers; − / − for non-carriers.
For individuals for whom DNA was available a sample ID number (L code) is shown. Dashed symbols represent deceased family members.
2.2. Mutation Screening
We initially performed exome or genome sequencing in 2011/2012 in six patients from three
families (Figure 1). Specifically, genome sequencing was carried out in three patients of Families B and
C (Complete Genomics, Mountain View, AB, Canada) while three patients of Family A were exome sequenced on an Illumina Genome Analyzer (Atlas Biolabs, Berlin, Germany). Variant calling and annotation were performed by Complete Genomics and Atlas Biolabs, respectively. Detected variants were filtered (a) to be exonic or splicing; (b) to affect amino acid sequence (synonymous variants were discarded); (c) to be rare, with a known frequency < 1% in the database for single nucleotide polymorphisms (dbSNP132, http://www.ncbi.nlm.nih.gov/projects/SNP/snp_summary.cgi?build_id=132); and (d) to be shared among definitely affected members within a family (Table S2). We further hypothesized that at least two of the families shared a mutation in the same gene. Candidate variants were validated by Sanger sequencing. All available family members were tested for segregation using Sanger sequencing.
We recently (in 2016) repeated exome sequencing in Family A (3 affected) and B (3 affected), and also included Family D (patient-parent trio) at Centogene, Rostock, Germany using an Illumina HiSeq 2000 machine and an in-house-annotation pipeline. In each of these families, we filtered for rare, protein-changing variants that were shared by all affected within a given family (Table S3).
Based on the NGS analyses, a rare variant in RAB12 was the only plausible candidate. Next, we used Sanger sequencing to screen Exons 2 to 6 of RAB12 in 238 unrelated German MD patients, 54 WD patients, 378 patients with different forms of dystonia, and 461 unrelated healthy subjects. Exon 1, which has a high GC content of 78% and thus was difficult to amplify, was tested in all MD and WD patients as well as in 170 healthy controls. Primer sequences are shown in Table S4.
Furthermore, all exons and exon/intron boundaries of RAB12 were included in an NGS-based gene panel analysis (Centogene, Rostock, Germany) that was performed for another 246 dystonia and 512 PD patients.
2.3. cDNA Analysis
A synonymous variant (c.276A>G, p.Arg92=) in Exon 2 of RAB12 that was predicted by MutationTaster to affect splicing of RAB12 was investigated on the RNA level. For this, RNA was extracted from a blood sample of a carrier using the QIAmp RNA Extraction Kit (QIAGEN, Germantown, MD, USA). Oligo-dT-Nucleotides of the Maxima First Strand cDNA Synthesis Kit (ThermoFisher, Waltham, MA, USA) served as primers to synthesize the complementary DNA (cDNA) by use of reverse transcriptase. PCR was performed with primers in Exons 1 and 4 (Table S4) and the respective product was inspected for its size and Sanger sequenced.
2.4. Plasmid and Viral Construction
The complete coding sequence of RAB12 (RefSeq: NM_001025300.2) was subcloned into a pcDNA vector containing a FLAG
TM-tag upstream of RAB12. The FLAG-tagged RAB12 sequence was then introduced into a lentiviral expression vector containing a puromycin resistance cassette. The mutations (c.38G>A, p.Gly13Asp and c.586A>G, p.Ile196Val) were introduced by site-directed mutagenesis (QuikChangeII, Stratagene, Cedar Creek, TX, USA, for primers see Table S4). Sequences of all RAB12 constructs were verified by Sanger sequencing. For lentiviral production, Human Embryonic Kidney (HEK293T) cells were transfected with vectors containing vsv-g envelopes, pCMV delta R8.2, and expression vectors with the RAB12 constructs using FuGENE HD transfection reagent (Promega, Madison, WI, USA). The virus was harvested from the supernatant by ultracentrifugation and the titer was determined using the RETRO-TEK HIV p24 Antigen ELISA (enzyme-linked immunosorbent assay) (Zeptometrix, Buffalo, NY, USA).
2.5. Cell Culture and Stable Transfection
Skin biopsies were collected from two MD patients carrying the Ile196Val mutation and two
healthy controls. Fibroblasts and SH-SY5Y cells were cultivated in Dulbecco’s modified eagle medium
supplemented with 10% fetal bovine serum and 1% penicillin/streptomycin (all medium components
were provided by PAA Laboratories, Pasching, Upper Austria, Austria). The cells were incubated at
37
◦C and 5% CO
2in a humidified atmosphere. Fibroblasts of the MD patients were used to study
effects of mutations in endogenously expressed RAB12. For overexpression studies, SH-SY5Y cells and fibroblasts from a healthy control subject were stably transfected with lentivirus (multiplicity of infection = 5) containing expression vectors with RAB12 wildtype (WT) and mutated cDNA sequences (c.38G>A, p.Gly13Asp and c.586A>G, p.Ile196Val). Selection of transfected cells was performed with 2 µg/mL puromycin (Sigma, St. Louis, MO, USA).
2.6. GTPase Assay
Proteins from SH-SY5Y cells stably expressing RAB12 WT and mutated proteins were extracted with an isotonic lysis buffer (15 mM Tris/HCl pH 7.4, 150 mM NaCl, 1% NP-40, 1 mM EDTA (Ethylendiamin-tetraacetat) protease inhibitor cocktail (Roche, Basel, Switzerland)) and subsequently centrifuged at 4
◦C at 16,000 × g for 20 min. Protein concentration was measured using the Dc Protein Assay (BioRad, Hercules, CA, USA). Whole protein extracts were used for the measurement of GTPase activity because effector proteins of RAB12, except for the Guanine nucleotide exchange factor DENND3 (DENN domain containing 3) [23], are largely unknown. The rate of inorganic phosphate that was newly produced within one hour of incubation was determined with the ATPase/GTPase Activity Assay Kit (Sigma), which was used according to the manufacturer’s protocol. Absorption was measured at 620 nm. The specific GTPase activity was calculated and data were normalized for the GTPase activity in RAB12 WT in each experiment. Means of four independent experiments were calculated.
2.7. RAB12 Protein Structure Modeling and Molecular Dynamics Simulations
The X-ray structure of inactive, guanosine diphosphate (GDP)-bound WT RAB12 (Protein Data Bank [PDB] ID: 2IL1, www.rcsb.org) was prepared using the Protein Preparation workflow (Schrödinger Suite 2014-2 Protein Preparation Wizard; Epik version 2.8; Impact version 6.3; Prime version 3.6, Schrödinger, LLC, New York, NY, 2014) [24]. Inactive p.Ile196Val-RAB12 was modeled with Schrödinger Prime (version 3.6, Schrödinger, LLC, New York, NY, 2014) based on the 2IL1-X-ray.
Active, GTP-bound RAB12 models were built using the RAB1A X-ray structure (Protein Data Bank (PDB) ID: 3TKL [25], chain A, resolution: 2.18 Å) and the homology-modeling module of Schrödinger Prime (version 3.6) with default settings. Non-template loops were refined by loop refinement (Prime, version 3.6). Additionally, the models were optimized employing the OPLS2005 [26] force field for energy minimization. Validation of the homology models was done using Prosa2003 [27] and PROCHECK. [28] All molecular dynamics simulations were performed using the Desmond package (Desmond Molecular Dynamics System, version 3.8, D. E. Shaw Research, New York, NY, USA, 2014) [29] and the OPLS 2005 force field [26]. Prepared X-ray structures and homology models of RAB12 were used as starting structures; each system was solvated in an orthorhombic box of TIP3P (transferable intermolecular potential with 3 points)-modeled water molecules [30]. The simulations were carried out with the default protocol provided in Desmond. Molecular dynamics simulations were performed at 300 K and 1bar for either 10 ns or 20 ns, if not stable after 10 ns simulation.
2.8. Immunostaining
For immunostaining, patient-derived fibroblasts, control fibroblasts, and fibroblasts stably
expressing WT and mutant forms of RAB12 were cultured on glass cover slips in a 24-well plate. Cells
were fixed with 4% paraformaldehyde (Sigma) and FLAG-tagged RAB12 proteins were detected with a
primary antibody raised against FLAG (1:1000, rabbit, Cell Signaling, Cambridge, UK). For detection of
lysosomes and TFRC, monoclonal antibodies raised against LAMP-1 (lysosomal associated membrane
protein 1) as a lysosomal marker (1:200, mouse, Santa Cruz, Dallas, TX, USA) and TFRC (1:300, mouse,
Invitrogen, Carlsbad, CA, USA) were used. The Endoplasmic reticulum (ER) and the Golgi apparatus
were detected with monoclonal antibodies raised against PDI (1:500, mouse, Abcam, Cambridge,
UK) and 58K Golgi protein (1:50,000, mouse, Abcam), respectively. Alexa fluor 488 and Alexa fluor
568 coupled secondary antibodies (1:400, goat, Life Technologies, Carlsbad, CA, USA) were utilized
for visualization. Cell nuclei were stained with 1 µ g/mL DAPI in DAPI Fluoromount G mounting medium (Southern Biotech, Birmingham, AL, USA). Images were analyzed with a Zeiss Axiovert 200 M microscope (Zeiss, Oberkochen, Germany) with ApoTome and Axiovision Rel 4.8 software (Zeiss, Oberkochen, Germany). For each of the three constructs (1 WT, 2 mutants), we randomly chose areas for analysis. Within these areas, all cells with intact nuclei (in total 110 cells per construct) were analyzed and assigned to one of three groups according to their properties: (a) RAB12 and lysosomes were uniformly distributed in the cytosol; (b) RAB12 and lysosomes were located in the perinuclear region and in large parts of the cytosol; (c) RAB12 and lysosomes accumulated exclusively in the perinuclear region.
2.9. Autophagy Inhibition and TFRC Degradation
SH-SY5Y cells stably expressing mutant and WT RAB12 were treated with the lysosomal inhibitor Bafilomycin A1 (3 nM, Sigma) for 24 h. Cells were detached using Accutase (PAA laboratories, Pasching, Austria) and proteins were extracted with RIPA buffer (50 mM Tris-HCl, pH 7.6, 150 mM NaCl, 1% deoxycholate (DOC), 1% NP-40 and 0.1% sodium dodecyl sulfate (SDS)). After centrifugation at 4
◦C at 16,000 × g for 20 min, the proteins of the supernatant were used for Western blot analysis.
Protein concentrations were determined utilizing Dc Protein Assay (BioRad) and 10 µ g of the proteins were loaded on NuPAGE 4–12% Bis-Tris protein gels (Life technologies). Proteins were then transferred to a nitrocellulose membrane (Protran, AnalytikJena, Jena, Germany) and primary antibodies raised against FLAG (1:1 × 10
7, mouse, Sigma), TFRC (1:20,000, mouse, Invitrogen), p62 (1:1000, rabbit, Cell Signaling), LC3 (1:4000, rabbit, Novus, Wiesbaden Nordenstadt, Germany), and β -actin (1:1 × 10
6, mouse, Cell Signaling) were used. The signal intensities of TFRC, p62, β -actin, and LC3 II (light chain 3, also known as microtubule associated protein 1 light chain 3 alpha) were analyzed densitometrically with the Totallab 100 v2006 software. For calculations of TFRC degradation, the protein bands of bafilomycin-treated cells were set to 100%.
2.10. Endogenous TFRC Levels in Patients’ Blood
To test for the concentration of soluble TFRC levels in the blood of available patients from Family A (L-2283, L-2381, L-2276), we used routine blood count measurements from local medical laboratories.
2.11. Statistical Analysis
To compare frequencies of diseased and healthy RAB12 variant carriers, Chi-square test (comparison with frequencies in about 60,000 individuals from the Exome Aggregation Consortium (ExAC) at http://exac.broadinstitute.org/) and Fisher’s exact test (comparison with our control individuals) were performed. All statistical tests related to the functional assays were performed with Graph Pad Prism 6. One-way analysis of variance (ANOVA) with Bonferroni’s post-hoc test was carried out to analyze the effect of RAB12 mutations on the GTPase activity, TFRC degradation, and the activation of autophagy. A Chi-square test was used for comparison of the cellular distribution of RAB12 and LAMP-1 in fibroblasts stably expressing WT or mutant RAB12. Likewise, for comparison of LAMP-1 distribution in patient and control fibroblasts, a Chi-square test was utilized.
3. Results
3.1. Identification of RAB12 Mutations in Patients with Musician’S Dystonia
Next-generation sequencing analyses in 2011/2012 revealed about 25,000 variants per exome
and approximately 3.5 million variants per genome (Table S2). Filtering for rare, exonic and splicing
as well as protein-changing variants shared among affected individuals within families, revealed
83, 509, and 1023 changes in Families A, B, and C, respectively. While there was no gene with rare,
protein-changing variants in affected individuals of all three families, the same rare missense change in
RAB12 (c.586A>G, p.Ile196Val, rs143888944) was found among the four affected patients of Families A
and C (Figures 1 and 2a). This variant was also detected in the presumably unaffected mother (L-2329) of the index patient in Family C. She is a 76-year old, retired secretary who did not play a musical instrument. She did not report any dystonic symptoms on the telephone-based Beth Israel Medical Center Dystonia Screen (BIDS) but could not be neurologically examined [4].
This RAB12 variant was not detected in 461 ethnically matched controls and has been reported in GnomAD in the heterozygous state only with a frequency of 0.0003. The p.Ile196Val substitution is highly conserved (Figure 2b) and predicted to be damaging by MutPred (http://mutpred.mutdb.org/) and MutationTaster (www.mutationtaster.org), and received a Combined Annotation Dependent Depletion (CADD) score of 16.5 (http://cadd.gs.washington.edu/) (Table 2).
Next, we searched for genetic variations of RAB12 in other MD patients. Sequencing of all six coding exons in 238 unrelated MD patients of European ancestry revealed two additional carriers of rare missense variants (p.Ile196Val, p.Gly13Asp) as well as one carrier of a synonymous change (p.Arg92=, Tables 2 and 3). The p.Ile196Val substitution was detected in another 39-year old German MD patient (Patient D, Figure 1). The patient first noticed embouchure problems when playing the trumpet at the age of 17 years. He changed his instrument and started to study the tuba. At the age of 21 years, he also developed embouchure dystonia on the tuba and had to stop his musical career.
His father had WD (age at onset: 27 years) and the maternal grandmother as well as the paternal grandfather were both reported to also suffer from writing problems (Figure 1). Segregation analysis revealed that the mildly affected mother of Patient D carried the p.Ile196Val variant in the homozygous state. Upon neurological examination and based on an unblinded as well as a blinded video review by three independent movement disorder specialists, she displayed several mild motor signs. These included dystonic posturing of her right hand with flexion of the third to fifth finger and of the thumb and extension of the index finger, perioral dyskinesia entrained with hand and finger movements, slowness of finger and hand movements bilaterally, more pronounced on the right-hand side and accompanied by curling of the third to fifth finger, as well as a 15-degree tilt to the right of her trunk in keeping with mild axial dystonia (Figure S1). The father was carrier of two WT alleles. He also tested negative for the GAG deletion in TOR1A (NM_000113.2: c.904_906delGAG, p.Glu303del) and negative for mutations in other dystonia-related genes [31] by exome sequencing.
The second missense variant (c.38G>A, p.Gly13Asp) was found in a 36-year old percussionist suffering from MD (Patient E, Figure 2a,b). He developed task-specific dystonia of his right leg when playing the percussion at the age of 25 years.
The synonymous variant was located near the acceptor splice site of Exon 2 (c.276A>G, p.Arg92=) and detected in a 39-year old MD patient. The variant was predicted to affect splicing by MutationTaster.
However, analysis of mRNA expression revealed only one transcript and sequencing of the cDNA confirmed the presence of both alleles, indicating that the variant does not impair splicing (data not shown).
Recent exome sequencing of Families A, B, and D with good coverage (mean coverage depth:
120 × , with approximately 95% of bases covered at >20 × ) excluded known dystonia genes and
confirmed RAB12 as the only plausible candidate (Table S5). Except for variants in MUC4 in Families B
and D, none of the candidate genes from an individual family were found in a second family. MUC4
encodes a mucin that is expressed in epithelial cells and does not represent a convincing candidate
for a neurological disorder. In Family A, B, and D, we identified 60, 46, and 80 individual, rare,
protein-changing variants shared among the affected family members (Table S5).
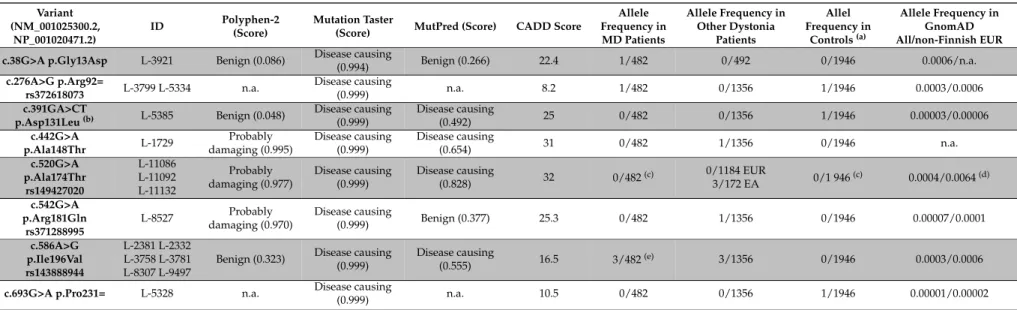
Table 2. Detected variants in RAB12 in musician´s dystonia and other dystonia patients as well as in the control group.
Variant (NM_001025300.2,
NP_001020471.2)
ID Polyphen-2
(Score)
Mutation Taster
(Score) MutPred (Score) CADD Score
Allele Frequency in MD Patients
Allele Frequency in Other Dystonia
Patients
Allel Frequency in
Controls(a)
Allele Frequency in GnomAD All/non-Finnish EUR c.38G>A p.Gly13Asp L-3921 Benign (0.086) Disease causing
(0.994) Benign (0.266) 22.4 1/482 0/492 0/1946 0.0006/n.a.
c.276A>G p.Arg92=
rs372618073 L-3799 L-5334 n.a. Disease causing
(0.999) n.a. 8.2 1/482 0/1356 1/1946 0.0003/0.0006
c.391GA>CT
p.Asp131Leu(b) L-5385 Benign (0.048) Disease causing (0.999)
Disease causing
(0.492) 25 0/482 0/1356 1/1946 0.00003/0.00006
c.442G>A
p.Ala148Thr L-1729 Probably
damaging (0.995)
Disease causing (0.999)
Disease causing
(0.654) 31 0/482 1/1356 0/1946 n.a.
c.520G>A p.Ala174Thr
rs149427020
L-11086 L-11092 L-11132
Probably damaging (0.977)
Disease causing (0.999)
Disease causing
(0.828) 32 0/482(c) 0/1184 EUR
3/172 EA 0/1 946(c) 0.0004/0.0064(d) c.542G>A
p.Arg181Gln rs371288995
L-8527 Probably
damaging (0.970)
Disease causing
(0.999) Benign (0.377) 25.3 0/482 1/1356 0/1946 0.00007/0.0001
c.586A>G p.Ile196Val rs143888944
L-2381 L-2332 L-3758 L-3781 L-8307 L-9497
Benign (0.323) Disease causing (0.999)
Disease causing
(0.555) 16.5 3/482(e) 3/1356 0/1946 0.0003/0.0006
c.693G>A p.Pro231= L-5328 n.a. Disease causing
(0.999) n.a. 10.5 0/482 0/1356 1/1946 0.00001/0.00002
(a)The control population includes 461 healthy individuals and 512 Parkinson’s disease patients;(b)c.391G>C (p.Asp131His) and c.392A>T (p.Asp131Val) are reported in GnomAD with the exact same minor allele frequency;(c)Not ethnically matched (patients were of East Asian origin);(d)Since the variant was exclusively found among East Asian patients, the provided GnomAD frequency is for East Asians instead of Non-Finish Europeans;(e)In addition, two affected relatives with writer’s dystonia also carried this variant. GnomAD: Genome Aggregation Database athttp://gnomad.broadinstitute.org/gene/ENSG00000206418. EUR: Europeans; EA: East Asians; n. a.: not available.
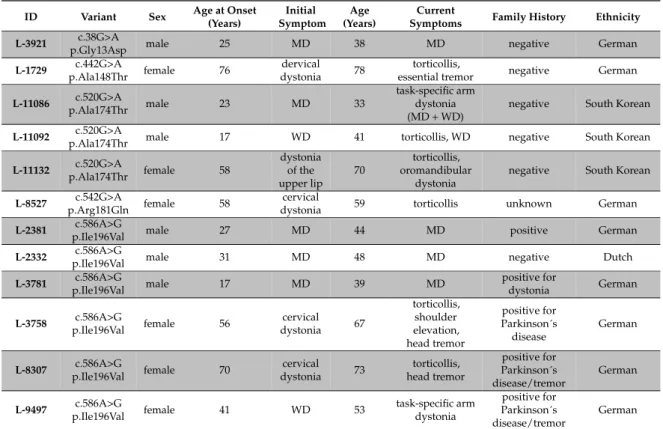
Table 3. Clinical findings in RAB12 mutation carriers.
ID Variant Sex Age at Onset
(Years)
Initial Symptom
Age (Years)
Current
Symptoms Family History Ethnicity L-3921 c.38G>A
p.Gly13Asp male 25 MD 38 MD negative German
L-1729 c.442G>A
p.Ala148Thr female 76 dervical
dystonia 78 torticollis,
essential tremor negative German L-11086 c.520G>A
p.Ala174Thr male 23 MD 33
task-specific arm dystonia (MD + WD)
negative South Korean L-11092 c.520G>A
p.Ala174Thr male 17 WD 41 torticollis, WD negative South Korean
L-11132 c.520G>A
p.Ala174Thr female 58
dystonia of the upper lip
70
torticollis, oromandibular
dystonia
negative South Korean L-8527 c.542G>A
p.Arg181Gln female 58 cervical
dystonia 59 torticollis unknown German
L-2381 c.586A>G
p.Ile196Val male 27 MD 44 MD positive German
L-2332 c.586A>G
p.Ile196Val male 31 MD 48 MD negative Dutch
L-3781 c.586A>G
p.Ile196Val male 17 MD 39 MD positive for
dystonia German
L-3758 c.586A>G
p.Ile196Val female 56 cervical
dystonia 67
torticollis, shoulder elevation, head tremor
positive for Parkinson´s disease
German
L-8307 c.586A>G
p.Ile196Val female 70 cervical
dystonia 73 torticollis, head tremor
positive for Parkinson´s disease/tremor
German
L-9497 c.586A>G
p.Ile196Val female 41 WD 53 task-specific arm
dystonia
positive for Parkinson´s disease/tremor
German
3.2. RAB12 Variants Are More Frequent in Dystonia Patients
The detection of four MD patients carrying rare missense variants in RAB12 was followed by genetic analysis of additional patients and controls. Among 74 unrelated WD patients, we found another carrier of p.Ile196Val (L-9497) and two patients with another substitution (c.520G>A, p.Ala174Thr, L-11086, L-11092). Of note, the first symptoms in L-11086 occurred in his left hand after prolonged clarinet playing over two months for more than 10 hours in an army band, indicating that he actually suffers from MD. Screening of 604 non-MD/WD dystonia patients revealed a total of five heterozygous carriers of rare missense variants in RAB12 including p.Ile196Val (n = 2), p.Ala174Thr, c.442G>A (p.Ala148Thr), and c.542G>A (p.Arg181Gln, rs371288995) (Tables 2 and 3).
Among 461 healthy controls, we found one carrier of a rare missense variant (p.Asp131Leu) and two carriers of synonymous base pair substitutions (p.Arg92=, p.Pro231=) (Table 2). While p.Arg92=
did not affect splicing (see above), an RNA sample of the carrier of the p.Pro231= variant was not available. Both synonymous variants received a relatively low CADD score (<11) and activation of a cryptic splice site was not predicted using a splice site prediction tool (http://www.fruitfly.org/seq_
tools/splice.html, donor and acceptor score cutoff: 0.1). In 512 PD patients that were screened using
a GenePanel and served as controls to test for disease specificity of the RAB12 variants, we did not
detect any rare sequence change (Table 2).
3.3. GTPase Activity Seems to Be Elevated in RAB12 Mutants
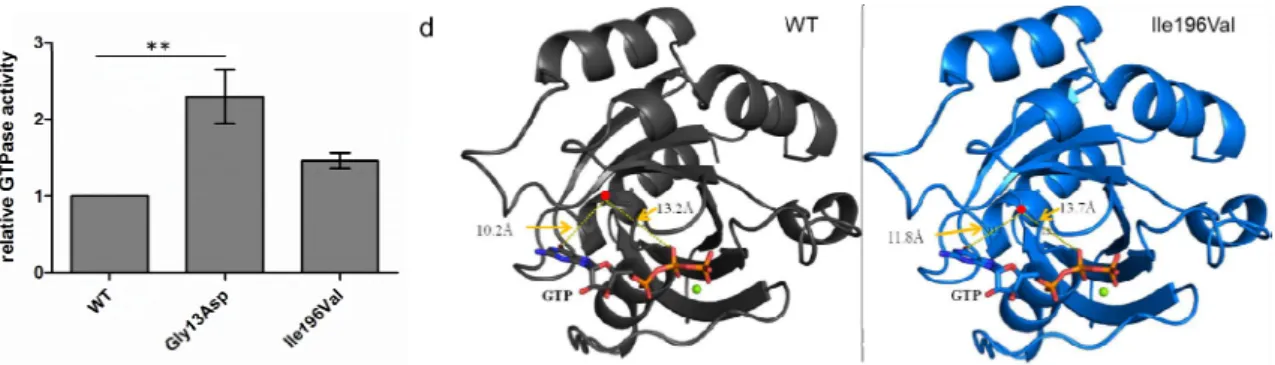
We aimed to test whether the RAB12 missense variants identified in MD patients (p.Gly13Asp, p.Ile196Val) have an impact on the enzymatic activity of the small GTPase RAB12. To compare the GTPase activity between SH-SY5Y cells stably expressing FLAG-tagged WT, p.Gly13Asp, and p.Ile196Val forms of RAB12, proteins were isolated in a native buffer and GTP hydrolysis was performed for one hour. Colorimetric measurements in four independent experiments revealed that GTP hydrolysis in FLAG-RAB12 p.Gly13Asp expressing SH-SY5Y cells was significantly increased compared to SH-SY5Y cells expressing FLAG-RAB12 WT (2.3-fold, p = 0.0065, Figure 2c). The GTP hydrolysis in FLAG-RAB12 p.Ile196Val expressing SH-SY5Y cells seemed also to be increased (1.4-fold) but the effect did not reach significance. Both mutations are located outside of the predicted GDP/GTP binding sites (49–57, 97–101, 155–159, and 187–188, www.uniprot.org, Figure 2a) and the predicted effector protein binding site (amino acids 71–79, www.uniprot.org).
3.4. The p.Ile196Val Mutation Does Not Change the Secondary and Tertiary Structure of RAB12 In Silico To investigate the impact of RAB12 mutations on the protein structure, in silico modeling was performed. RAB proteins switch between a GDP- (inactive) and a GTP-bound (active) conformation and these two protein states differ in the conformation of the switch regions [32]. A RAB12 X-ray structure (PDB ID: 2IL1, resolution: 2.1 Å) in complex with GDP representing the inactive form is publically available. Amino acid residue Gly13 is missing in this crystal structure and could not be modeled. Since no 3D structure of RAB12 in its active conformation is available, homology models of active, GTP-bound WT- and p.Ile196Val-RAB12 were built. The human RAB1A X-ray structure (PDB ID: 3TKL [25], chain A, resolution: 2.18 Å), representing the active form, was used as template (50% sequence identity with RAB12 and covering Arg37-Met208). Homology models of active RAB12 WT and p.Ile196Val were generated (Figure 2d). Gly13Asp was not covered by the template and thus could not be modeled. Residue 196 is located in an α -helix about 10 Å away from GDP/GTP and its binding site. Using these models, there was no major effect on GDP/GTP binding or protein structure comparing the molecular dynamics simulations of WT- and p.Ile196Val-RAB12 (inactive and active, data not shown).
3.3. GTPase Activity Seems to Be Elevated in RAB12 Mutants
We aimed to test whether the RAB12 missense variants identified in MD patients (p.Gly13Asp, p.Ile196Val) have an impact on the enzymatic activity of the small GTPase RAB12. To compare the GTPase activity between SH‐SY5Y cells stably expressing FLAG‐tagged WT, p.Gly13Asp, and p.Ile196Val forms of RAB12, proteins were isolated in a native buffer and GTP hydrolysis was performed for one hour. Colorimetric measurements in four independent experiments revealed that GTP hydrolysis in FLAG‐RAB12 p.Gly13Asp expressing SH‐SY5Y cells was significantly increased compared to SH‐SY5Y cells expressing FLAG‐RAB12 WT (2.3‐fold, p = 0.0065, Figure 2c). The GTP hydrolysis in FLAG‐RAB12 p.Ile196Val expressing SH‐SY5Y cells seemed also to be increased (1.4‐fold) but the effect did not reach significance. Both mutations are located outside of the predicted GDP/GTP binding sites (49–57, 97–101, 155–159, and 187–188, www.uniprot.org, Figure 2a) and the predicted effector protein binding site (amino acids 71–79, www.uniprot.org).
3.4. The p.Ile196Val Mutation Does Not Change the Secondary and Tertiary Structure of RAB12 In Silico To investigate the impact of RAB12 mutations on the protein structure, in silico modeling was performed. RAB proteins switch between a GDP‐ (inactive) and a GTP‐bound (active) conformation and these two protein states differ in the conformation of the switch regions [32]. A RAB12 X‐ray structure (PDB ID: 2IL1, resolution: 2.1 Å) in complex with GDP representing the inactive form is publically available. Amino acid residue Gly13 is missing in this crystal structure and could not be modeled. Since no 3D structure of RAB12 in its active conformation is available, homology models of active, GTP‐bound WT‐ and p.Ile196Val‐RAB12 were built. The human RAB1A X‐ray structure (PDB ID: 3TKL [25], chain A, resolution: 2.18 Å), representing the active form, was used as template (50%
sequence identity with RAB12 and covering Arg37‐Met208). Homology models of active RAB12 WT and p.Ile196Val were generated (Figure 2d). Gly13Asp was not covered by the template and thus could not be modeled. Residue 196 is located in an α‐helix about 10 Å away from GDP/GTP and its binding site. Using these models, there was no major effect on GDP/GTP binding or protein structure comparing the molecular dynamics simulations of WT‐ and p.Ile196Val‐RAB12 (inactive and active, data not shown).
Figure 2. Cont. Figure 2. Cont.
Figure 2. RAB12 and functionally investigated variants. (a) Schematic view of the RAB12 protein with the identified mutations p.Gly13Asp and p.Ile196Val in MD patients (red arrows), the guanosine diphosphate/guanosine triphosphate (GDP/GTP)‐binding sites (red), the predicted effector region (blue), and the posttranslational modifications on amino acid positions 1 (N‐acetylation), 21, 25, 106 (phosphorylations), 243, and 244 (geranylgeranylations) are indicated.
RefSeq: NM_001025300.2, NP_001020471; (b) The Glycine at position 13 (left panel, red) and the Isoleucine at position 196 (right panel, red) are conserved across different species; (c) Proteins of transfected SH‐SY5Y cells were incubated with GTP for 1 h and PO
43−production was measured.
GTPase activity of mutant RAB12 expressing cells was normalized for GTPase activity of wild‐type (WT) RAB12 expressing cells. The bars indicate the means ± standard error of mean, One‐way analysis of variance (ANOVA) with Bonferroni’s post‐hoc test. ** p < 0.01, n = 4; (d) Homology model of active/GTP‐bound RAB12 in ribbon representation. WT is presented in black (left model) and p.Ile196Val in blue (right model). Magnesium ions are shown as green spheres, amino acid residue 196 is marked by red points, and GTP is indicated by sticks. The figures were generated with PyMOL (PyMOL Molecular Graphics System, Version 1.7.0 Schrödinger, LLC, New York, NY, USA).
3.5. RAB12 Mutations Alter the Subcellular Localization of RAB12 and Lysosomes
An increase in active/GTP‐bound RAB12 may result in altered RAB12 function. In a first step, we confirmed that transfected SHSY‐5Y cell lines expressed similar levels of mutant and WT RAB12 as examined by Western blotting. Further, the RAB12 mutants had no effect on the levels of the lysosomal marker LAMP‐1 (Figure 3a). To investigate the cellular localization of mutant (p.Gly13Asp, p.Ile196Val) and WT RAB12, immunofluorescent staining was performed in fibroblasts expressing FLAG‐tagged mutant and WT RAB12. We observed in each line different patterns of RAB12 distribution that were classified as (a) uniform distribution of RAB12 throughout the cytoplasm (example see Figure 3b, upper left panel); (b) accumulation of RAB12 in the perinuclear region (Figure 3b, upper right panel); and (c) a combination of cytoplasmic and perinuclear localization (Figure 3b, upper middle panel). While WT RAB12 demonstrated uniform cytoplasmic localization in 53% of cells, this type of distribution was only present in 18% of cells with p.Gly13Asp and 15% of cells with p.Ile196Val overexpression (Figure 3c). Accordingly, the percentage of cells with exclusively perinuclear accumulation of RAB12 was lower in fibroblasts expressing WT (10%) compared to those expressing mutant proteins (p.Gly13Asp: 39%, p.Ile196Val:
45%, p < 0.0001).
RAB12 has previously been shown to colocalize with lysosomes [15]. Here, we evaluated lysosomal localization of mutant and WT RAB12 by immunocytochemistry using the lysosomal marker LAMP‐1 and an anti‐FLAG antibody (since there is no human RAB12 antibody commercially available for immunocytochemistry). We observed lysosomal localization of WT and both mutant forms of RAB12 (Figure 3b, lower panels). Of note, immunofluorescence experiments revealed no colocalization of FLAG‐RAB12 WT and mutated proteins with the ER or the Golgi apparatus (data not shown). In the patient‐derived fibroblasts expressing endogenous levels of mutant RAB12, the number of cells with uniformly distributed lysosomes was reduced by about 50% compared to control fibroblasts (Figure 3d). There was also an increase in the fraction of cells with predominant perinuclear accumulation in the patient fibroblasts compared to controls (controls: 17% and 18%, patients: 24% and 31%, p = 0.0002).
Figure 2. RAB12 and functionally investigated variants. (a) Schematic view of the RAB12 protein with the identified mutations p.Gly13Asp and p.Ile196Val in MD patients (red arrows), the guanosine diphosphate/guanosine triphosphate (GDP/GTP)-binding sites (red), the predicted effector region (blue), and the posttranslational modifications on amino acid positions 1 (N-acetylation), 21, 25, 106 (phosphorylations), 243, and 244 (geranylgeranylations) are indicated. RefSeq: NM_001025300.2, NP_001020471; (b) The Glycine at position 13 (left panel, red) and the Isoleucine at position 196 (right panel, red) are conserved across different species; (c) Proteins of transfected SH-SY5Y cells were incubated with GTP for 1 h and PO
43−production was measured. GTPase activity of mutant RAB12 expressing cells was normalized for GTPase activity of wild-type (WT) RAB12 expressing cells.
The bars indicate the means ± standard error of mean, One-way analysis of variance (ANOVA) with Bonferroni’s post-hoc test. ** p < 0.01, n = 4; (d) Homology model of active/GTP-bound RAB12 in ribbon representation. WT is presented in black (left model) and p.Ile196Val in blue (right model).
Magnesium ions are shown as green spheres, amino acid residue 196 is marked by red points, and GTP is indicated by sticks. The figures were generated with PyMOL (PyMOL Molecular Graphics System, Version 1.7.0 Schrödinger, LLC, New York, NY, USA).
3.5. RAB12 Mutations Alter the Subcellular Localization of RAB12 and Lysosomes
An increase in active/GTP-bound RAB12 may result in altered RAB12 function. In a first step, we confirmed that transfected SHSY-5Y cell lines expressed similar levels of mutant and WT RAB12 as examined by Western blotting. Further, the RAB12 mutants had no effect on the levels of the lysosomal marker LAMP-1 (Figure 3a). To investigate the cellular localization of mutant (p.Gly13Asp, p.Ile196Val) and WT RAB12, immunofluorescent staining was performed in fibroblasts expressing FLAG-tagged mutant and WT RAB12. We observed in each line different patterns of RAB12 distribution that were classified as (a) uniform distribution of RAB12 throughout the cytoplasm (example see Figure 3b, upper left panel); (b) accumulation of RAB12 in the perinuclear region (Figure 3b, upper right panel); and (c) a combination of cytoplasmic and perinuclear localization (Figure 3b, upper middle panel). While WT RAB12 demonstrated uniform cytoplasmic localization in 53% of cells, this type of distribution was only present in 18% of cells with p.Gly13Asp and 15% of cells with p.Ile196Val overexpression (Figure 3c).
Accordingly, the percentage of cells with exclusively perinuclear accumulation of RAB12 was lower in fibroblasts expressing WT (10%) compared to those expressing mutant proteins (p.Gly13Asp: 39%, p.Ile196Val: 45%, p < 0.0001).
RAB12 has previously been shown to colocalize with lysosomes [15]. Here, we evaluated
lysosomal localization of mutant and WT RAB12 by immunocytochemistry using the lysosomal
marker LAMP-1 and an anti-FLAG antibody (since there is no human RAB12 antibody commercially
available for immunocytochemistry). We observed lysosomal localization of WT and both mutant
forms of RAB12 (Figure 3b, lower panels). Of note, immunofluorescence experiments revealed no
colocalization of FLAG-RAB12 WT and mutated proteins with the ER or the Golgi apparatus (data
not shown). In the patient-derived fibroblasts expressing endogenous levels of mutant RAB12, the
number of cells with uniformly distributed lysosomes was reduced by about 50% compared to control
fibroblasts (Figure 3d). There was also an increase in the fraction of cells with predominant perinuclear
accumulation in the patient fibroblasts compared to controls (controls: 17% and 18%, patients: 24%
and 31%, p = 0.0002).
Genes 2017, 8, 276 12 of 19
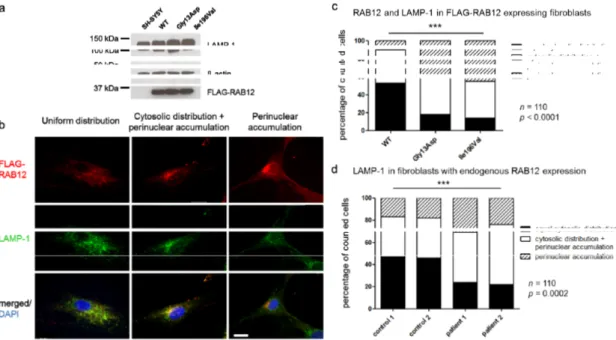
Figure 3. RAB12 mutations changed the subcellular localization of RAB12 proteins and lysosomes.
(a) Ectopical protein expression of FLAG‐RAB12 and expression of the lysosome‐associated protein LAMP‐1 (lysosomal associated membrane protein 1) is equal in RAB12 WT and mutant SH‐SY5Y cells. All protein signals were detected on the same membrane. Blots were cropped for clarity but no bands were removed. Original blots are shown in the supplementary material (Figure S5); (b) In WT and mutated RAB12‐overexpressing cells, three different patterns of RAB12 distribution were observed and categorized. Proportions of cells revealed RAB12 (red) that was evenly distributed in the cytoplasm (upper left panel), that was distributed in the cytoplasm and accumulated in close proximity to the nucleus (upper middle panel), or that accumulated exclusively in the perinuclear region of the fibroblast (upper right panel). FLAG‐RAB12 and LAMP‐1 (green) colocalized in the cytoplasm (lower panels). Nuclei were stained with DAPI (blue). Scale bar: 20 μm; (c) 110 randomly chosen fibroblasts with each construct were categorized and cellular localization of FLAG‐RAB12 and LAMP‐1 was quantified. Chi‐square test: p < 0.0001; (d) 110 randomly chosen fibroblasts of two MD patients (p.Ile196Val) and two healthy controls were categorized and cellular localization of LAMP‐1 was quantified. Chi‐square test: p = 0.0002.
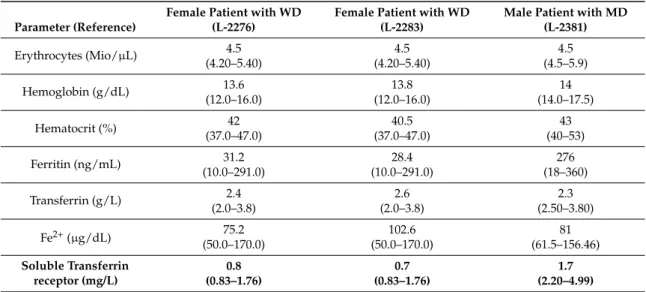
3.6. Soluble TFRC Levels in Patients’ Blood Were Reduced
It has been reported that RAB12 regulates the degradation of TFRC [15]. All three tested patients with the p.Ile196Val mutation showed reduced soluble TFRC levels in blood (Table 4).
While in both female WD patients soluble TFRC levels at 0.7 and 0.8 mg/L were only slightly below the reference range (0.83–1.76 mg/L), levels in the male MD patient at 1.7 mg/L were more clearly below the reference range (2.2–4.99 mg/L). Except for the Transferrin level which was slightly decreased in the male patient (2.3 g/L, ref: 2.50–3.80g/L), all other parameters reflecting iron metabolism were in the normal range in all three patients (Table 4).
Table 4. Results of blood count for members of Family A with the p.Ile196Val mutation.
Parameter (Reference)
Female Patient with WD (L‐2276)
Female Patient with WD (L‐2283)
Male Patient with MD (L‐2381)
Erythrocytes (Mio/μL) 4.5 4.5 4.5
(4.20–5.40) (4.20–5.40) (4.5–5.9)
Hemoglobin (g/dL) 13.6 13.8 14
(12.0–16.0) (12.0–16.0) (14.0–17.5)
Hematocrit (%) 42 40.5 43
(37.0–47.0) (37.0–47.0) (40–53)
Figure 3. RAB12 mutations changed the subcellular localization of RAB12 proteins and lysosomes.
(a) Ectopical protein expression of FLAG-RAB12 and expression of the lysosome-associated protein LAMP-1 (lysosomal associated membrane protein 1) is equal in RAB12 WT and mutant SH-SY5Y cells.
All protein signals were detected on the same membrane. Blots were cropped for clarity but no bands were removed. Original blots are shown in the supplementary material (Figure S5); (b) In WT and mutated RAB12-overexpressing cells, three different patterns of RAB12 distribution were observed and categorized. Proportions of cells revealed RAB12 (red) that was evenly distributed in the cytoplasm (upper left panel), that was distributed in the cytoplasm and accumulated in close proximity to the nucleus (upper middle panel), or that accumulated exclusively in the perinuclear region of the fibroblast (upper right panel). FLAG-RAB12 and LAMP-1 (green) colocalized in the cytoplasm (lower panels).
Nuclei were stained with DAPI (blue). Scale bar: 20 µm; (c) 110 randomly chosen fibroblasts with each construct were categorized and cellular localization of FLAG-RAB12 and LAMP-1 was quantified.
Chi-square test: p < 0.0001; (d) 110 randomly chosen fibroblasts of two MD patients (p.Ile196Val) and two healthy controls were categorized and cellular localization of LAMP-1 was quantified. Chi-square test: p = 0.0002.
3.6. Soluble TFRC Levels in Patients’ Blood Were Reduced
It has been reported that RAB12 regulates the degradation of TFRC [15]. All three tested patients
with the p.Ile196Val mutation showed reduced soluble TFRC levels in blood (Table 4). While in both
female WD patients soluble TFRC levels at 0.7 and 0.8 mg/L were only slightly below the reference
range (0.83–1.76 mg/L), levels in the male MD patient at 1.7 mg/L were more clearly below the
reference range (2.2–4.99 mg/L). Except for the Transferrin level which was slightly decreased in the
male patient (2.3 g/L, ref: 2.50–3.80g/L), all other parameters reflecting iron metabolism were in the
normal range in all three patients (Table 4).
Table 4. Results of blood count for members of Family A with the p.Ile196Val mutation.
Parameter (Reference)
Female Patient with WD (L-2276)
Female Patient with WD (L-2283)
Male Patient with MD (L-2381)
Erythrocytes (Mio/µL) 4.5 4.5 4.5
(4.20–5.40) (4.20–5.40) (4.5–5.9)
Hemoglobin (g/dL) 13.6 13.8 14
(12.0–16.0) (12.0–16.0) (14.0–17.5)
Hematocrit (%) 42 40.5 43
(37.0–47.0) (37.0–47.0) (40–53)
Ferritin (ng/mL) 31.2 28.4 276
(10.0–291.0) (10.0–291.0) (18–360)
Transferrin (g/L) 2.4 2.6 2.3
(2.0–3.8) (2.0–3.8) (2.50–3.80)
Fe2+(µg/dL) 75.2 102.6 81
(50.0–170.0) (50.0–170.0) (61.5–156.46)
Soluble Transferrin receptor (mg/L)
0.8 0.7 1.7
(0.83–1.76) (0.83–1.76) (2.20–4.99)