A TLAS-CONF-2010-026 13 July 2010
ATLAS NOTE
ATLAS-CONF-2010-026 23 April 2010
The ATLAS missing E T trigger performance with initial LHC runs at √
s = 900 GeV
The ATLAS Collaboration
Abstract
This paper presents an early study of the performance of the ATLAS trigger based on the vector (E
Tmiss) and scalar ( P
E
T) sums of the measured transverse energies, obtained with data collected during the 2009 LHC runs, with proton-proton collisions at √
s = 900 GeV.
1 Introduction
The performance of the ATLAS [1] missing tranverse-energy (E
Tmiss) trigger [2] during the initial LHC operation at √
s = 900 GeV can be studied by looking at the runs taken by ATLAS in 2009 with stable LHC beams and good detector conditions, triggered by L1 [3] only. In this note, we will focus on the runs 142165, 142166, 142171, 142174, 142189, 142191, 142193, 142195, for which the HLT [4] algorithms operated online, though they have been enabled relatively late in each run. To increase the statistics, all events have been reprocessed offline to get the HLT result for all luminosity blocks.
In 2009, the HLT was run in pass-through mode, which means that it did not reject any events. In addition, the E
Tmisstrigger has been configured to process all events passing L1. This allowed processing all events in the random stream (useful for evaluating the rate contribution due to the detector noise) as well as all other physics streams.
At EF, energies have been calculated using three different configurations [2]: a sum over all calorimeter cells with and without noise suppression, and a sum over front-end boards (FEB)
1). Having different measurements is fundamental for debugging the calorimeter input and validat- ing and optimizing the calculation. However, this note is only about the default EF configuration, which sums all cells with measured energy above a threshold set at 3 noise RMS (referred to below as “1-sided 3-RMS cut”).
Because hadronic calibrations are still to be fully commissioned, we compare the trigger output from 2009 data with the values reconstructed offline without correcting for hadronic to electromagnetic (e.m.) layer differences. Actually, the EF included some simple hadronic correction, which has been unfolded offline for this analysis. In the following, all plots will show distributions of the vector (E
Tmiss) and scalar ( P
E
T) sums over the transverse energies measured at e.m. scale by each trigger-tower (at L1) or all calorimeter cells (at EF) above the noise threshold.
As described in [2], at L2 both E
Tmissand P
E
Tare computed adding the vector and scalar sums of all muon momenta reconstructed at L2 to the calorimetric measurement done at L1; at EF the contributions from both calorimetry and muon spectrometer are recomputed. Because the muon trigger (hence the muon correction at HLT) is not yet fully validated, this note will show distributions obtained without muon correction. For this reason, L2 is not shown in any plot and both EF and offline values were recomputed offline without the muon contribution.
Trigger distributions are compared to the available reference offline reconstructions at e.m.
scale based on calorimetry only: MET Topo, the sum over all 4/2/0 topological clusters
2), and MET Base, obtained by taking all cells with energy exceeding (in absolute value) 2 noise RMS. In offline analysis, the best performance is achieved at e.m. scale by using MET Topo [5], however we also compare to MET Base because the algorithm of the latter is more similar to what it is computed by the trigger.
2 Distributions obtained with different streams
In 2009, the ATLAS HLT E
Tmisstrigger (when enabled) was run over all events passing L1. This allowed for trigger commissioning and for the tuning of the trigger menus prepared for physics runs. In this section, the distributions of E
Tmissand P
E
Tcomputed at L1, EF and offline are shown for samples selected from the runs mentioned in section 1 in the following ways:
1)
FEBs are used for LAr only. For Tile, all cells above the noise threshold have been used.
2)
Built starting from seed cells with absolute value of the signal above 4 noise RMS and adding first all
neighboring cells above 2 RMS, then all adjacent cells.
(GeV) Missing ET
0 10 20 30 40 50
Events / (3 GeV)
1 10 102
103
104
105
L1 EF MET_Base ATLAS Preliminary
(GeV) Sum ET
0 20 40 60 80 100
Events / (6 GeV)
1 10 102
103
104
105
L1 EF MET_Base ATLAS Preliminary
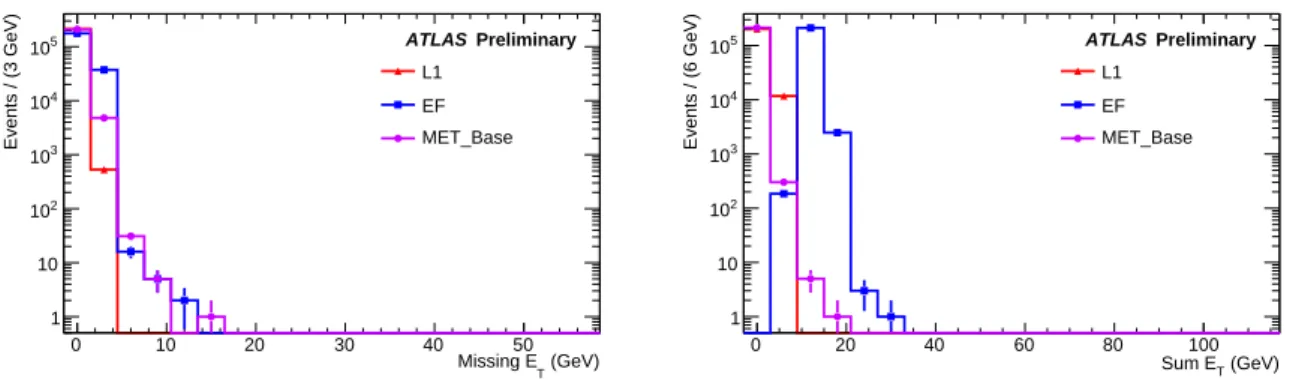
Figure 1: E
Tmiss(left) and P
E
T(right) distributions from the random stream.
1. events falling in the random stream. They have been triggered at L1 by a random gen- erator in coincidence with bunch crossings
3), hence provide a way to estimate the noise contribution;
2. events falling in the L1Calo stream. They have been triggered at L1 from at least one among electron/photon, tau, jet, forward jet, E
Tmissor P
E
Ttriggers, which means that there was non negligible (transverse) energy measurement in calorimeters. From the point of view of the E
Tmisstrigger, they are to be considered the “interesting” events;
3. events falling in the MinBias stream in coincidence with a hit in both sides of the minimum bias trigger scintillators (MBTS 1 1), for which the MBTS time difference is consistent with zero and the LAr time difference is consistent with zero
4). Such events are the proton-proton collision candidates;
4. events selected from the previous set, after rejection of the ones with badly reconstructed (offline) jets or isolated energy blobs likely due to cosmic-ray or beam-gas/beam-halo tracks. This also removes jets reconstructed in poorly instrumented or problematic regions and is a common clean-up in all physics analyses.
2.1 Noise contribution Figure 1 shows E
Tmissand P
E
Tdistributions obtained taking events falling in the random stream. In this figure and all the following ones, the histogram binning is 3 GeV/bin for E
Tmissand 6 GeV/bin for P
E
T(the bin at zero is centered on zero). These histograms include signals from mechanisms that cannot be easily excluded at trigger time, such as calorimeter noise or the (rarer) in-time cosmic rays and non-collision beam effects.
During the initial LHC running, the collision rate was low enough that no HLT rejection was needed and events were filtered by the L1 trigger alone. To avoid a trigger rate dominated by noise, a conservative approach to noise rejection is adopted by the Level-1 calorimeter trigger [6].
Any individual towers with an ET of less than about 1.2 GeV were set to zero
5). This cut has the effect of significantly reducing the noise in the E
Tmissand P
E
Tcalculations, at the cost of
3)
This type of trigger is meant to provide a “zero bias” reference for efficiency estimates, but in practice allowed us to make a study of the noise impact on the measured distributions.
4)
The delays are set so to have almost a zero time difference if the signals are induced by particles emitted at the same time from the interaction point.
5)
The cut value actually varies between about 1.0 to 1.25 GeV on a tower by tower basis, depending on exactly
where the channel pedestal level sits.
(GeV) Missing ET
0 10 20 30 40 50
Events / (3 GeV)
1 10 102
103
L1 EF MET_Base ATLAS Preliminary
(GeV) Sum ET
0 20 40 60 80 100
Events / (6 GeV)
1 10 102
103
L1 EF MET_Base ATLAS Preliminary
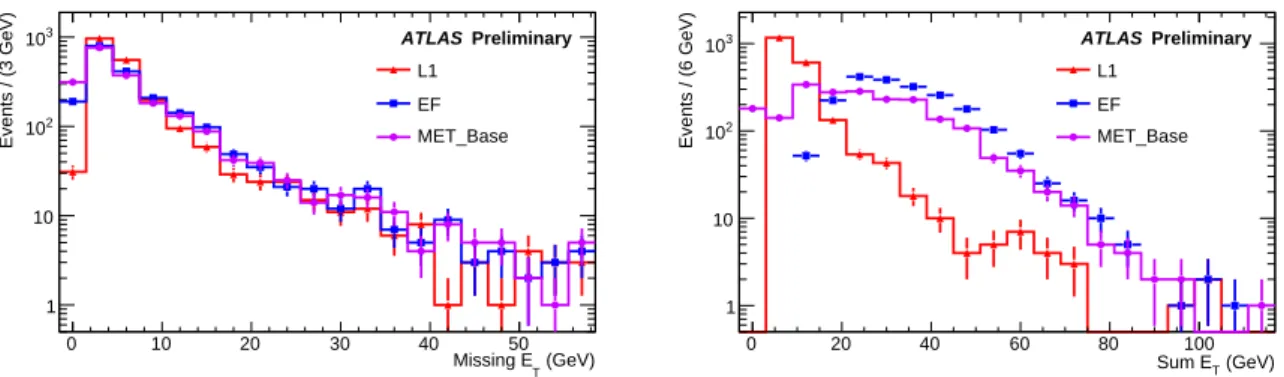
Figure 2: E
missT(left) and P
E
T(right) distributions for events in the L1Calo stream.
reducing the sharpness of the threshold behaviour. In comparison, the EF distributions, as well as the offline ones, have larger tails due to the less severe noise suppression schemes with respect to L1.
As the right plot in figure 1 shows — the same being true for all following figures — the choice of a 1-sided cut at EF induces a bias in the measured P
E
Tdistribution of about 10 GeV. This is expected, since no negative energy fluctuation can balance the positive noise tail
6). The choice of applying a 1-sided cut is driven by performance and robustness considerations: rejecting negative values protects against large negative values, which may arise from hardware failures and are a source of fake E
Tmiss. Because the purpose of the trigger is to reject events, not making a precise energy measurement, the existence of a small bias is not a problem at all: to compensate for it, a comparable increase in the P
E
Tthreshold is sufficient to keep the rate under control (more details are provided in section 2.4 below).
2.2 Events triggered by L1Calo Figure 2 shows the E
Tmissand P
E
Tdistributions measured with events falling in the L1Calo stream. From the trigger point of view, they are “signal” events, in the sense that they have a real energy deposition in calorimeters which satisfies at least one among the different L1 triggers based on calorimetry.
Actually, whether the measured energy in calorimeters is due to fake sources, such as hard- ware failures, cosmic rays or beam-pipe/beam-gas collisions, is something which can only be determined offline, though some work is in progress to implement additional “intelligence” at the trigger level. In the 2009 runs, the collision rate was so low that a non negligible contribu- tion from non-collision events is present in these distributions. With increasing luminosity it is expected that the relative importance of such spurious events will decrease.
The effects of the conservative L1Calo settings are visible in the comparison between the E
Tmissdistributions, which shows good agreement between the L1, EF and offline measurements, and expecially in P
E
T, which is steeper at L1 due to the stronger noise suppression. Again, the O(10) GeV bias on the EF P
E
Tis clearly visible, even though the slope of its distribution matches quite well the offline reference above a few tens of GeV.
2.3 Events triggered by collision candidates Figure 3 shows the E
Tmissand P
E
Tdistributions measured with collision candidates satisfying selections 3 (above) and 4 (below) mentioned in section 1. The collision candidates are defined
6)
A 1-sided cut with threshold at 2 noise RMS has a bias which is one order of magnitude higher.
(GeV) Missing ET
0 10 20 30 40 50
Events / (3 GeV)
1 10 102
103
104
105
L1 EF MET_Base ATLAS Preliminary
(GeV) Sum ET
0 20 40 60 80 100
Events / (6 GeV)
1 10 102
103
104
105
L1 EF MET_Base ATLAS Preliminary
(GeV) Missing ET
0 10 20 30 40 50
Events / (3 GeV)
1 10 102
103
104
105
L1 EF MET_Base ATLAS Preliminary
(GeV) Sum ET
0 20 40 60 80 100
Events / (6 GeV)
1 10 102
103
104
105
L1 EF MET_Base ATLAS Preliminary
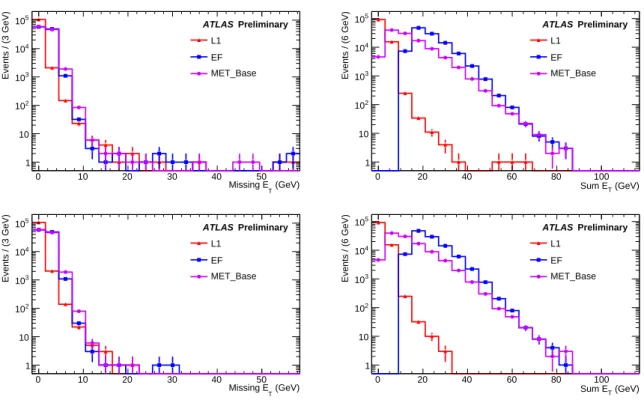
Figure 3: E
Tmiss(left) and P E
T(right) distributions for collision candidates before (above) and after (below) removal of events with bad jet measurement or an excess of E
Tmisswith respect to P E
T.
by the requirement of a signal in both sides of the MBTS with time difference compatible with zero, both for MBTS paddles and for LAr cells above some threshold (5 noise RMS and 250 MeV).
Jets have been reconstructed offline by the anti-k
Talgorithm [7] with cone R = 0.6 and are required to have at least 7 GeV (at e.m. scale). In case they include problematic cells, the latter are masked out and their energy is estimated from the neighboring cells. The “bad”
events removed by the last selection are those for which such corrected cells constitute more than 20% of the cells used in jet reconstruction or for which 90% of jet energy is deposited in less than 3 calorimeter cells. In addition, events are discarded if the magnitudes of E
Tmissand P E
Tare very similar
7). The latter cut rejects events in which a cosmic ray muon induced (via bremsstrahlung) a shower in the calorimeters which dominates the overall energy measurement.
The cleanup removes only a few events, falling in the high-energy tails. Because this could be important to keep the trigger rate under control, work is in progress to find whether such cuts (or a slightly simpler version) can also be applied online
8).
Compared with figure 2, the E
Tmissspectra in figure 3 are much steeper: real collisions at 900 GeV have a very small E
Tmiss, as expected. The “missing” E
Tdominating the L1Calo distribution is actually a “measured” asymmetric energy deposition in calorimeters (the operational definition of E
Tmissis the opposite of the E
Tvector) coming from non-collision events.
7)
An event is rejected if E
Tmiss/ P
E
T> 0.9, using offline quantities at e.m. scale.
8)
A flagging mechanism based on the ratio between E
Tmissand P
E
Tis already running online.
)2Events / (9 GeV
1 10 102
(GeV) MET_Base Missing ET
0 10 20 30 40 50 60
(GeV) TL1 Missing E
0 10 20 30 40 50 60
ATLAS Preliminary
)2Events / (36 GeV
10-1
1 10
(GeV) MET_Base Sum ET
0 20 40 60 80 100 120
(GeV)TL1 Sum E
0 20 40 60 80 100 120
ATLAS Preliminary
)2Events / (9 GeV
10-1
1 10
(GeV) MET_Base Missing ET
0 10 20 30 40 50 60
(GeV) TEF Missing E
0 10 20 30 40 50 60
ATLAS Preliminary
)2Events / (36 GeV
10-1
1 10
(GeV) MET_Base Sum ET
0 20 40 60 80 100 120
(GeV)TEF Sum E
0 20 40 60 80 100 120
ATLAS Preliminary
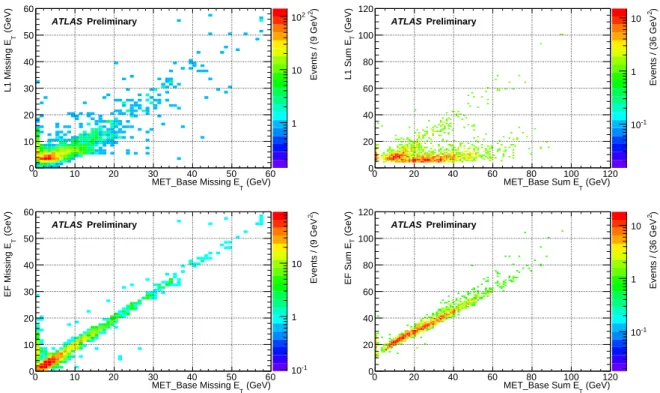
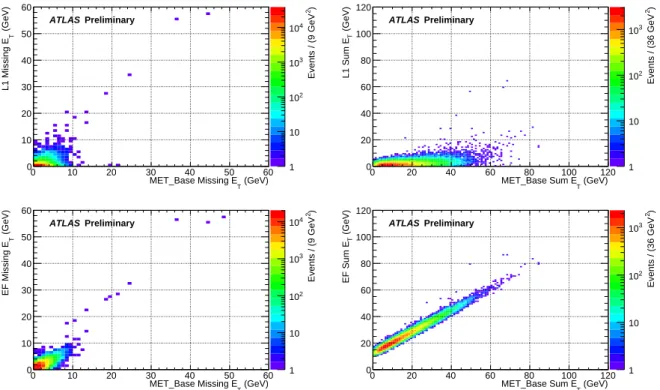
Figure 4: E
Tmiss(left) and P E
T(right) distributions from the L1Calo stream, measured at L1 (top) and EF (bottom), are compared to the offline reconstruction.
2.4 Comparison to MET Base
Though MET Topo provides the best offline e.m. scale reconstruction based on calorimetry only [5], in this section we take the MET Base algorithm as the reference, because it is more similar to what is computed by the trigger. The reason is that, in order to build topological clusters (3D objects), more than a single pass is needed over the calorimeter cells, whereas the trigger performs the full computation with a single loop over all channels (trigger towers at L1, cells at EF), to keep the execution time at a minimum. Actually, MET Base makes a single loop over all cells, applying a 2-sided noise suppression (after the removal of bad channels performed during offline reconstruction). The main difference with EF is that the latter applies a 1-sided cut with a higher noise threshold (3 noise RMS instead of 2).
Figures 4 (L1Calo stream) and 5 (all collision candidates, no cleanup applied) show the correlation between trigger and offline quantities. Trigger and offline E
Tmissvalues are linearly correlated in all cases, with the EF having a better resolution than L1, as expected. On the other hand, the relation between trigger and MET Base is less trivial for P
E
T. The L1 P
E
Tdistribution in figure 4 has a minimal cut at few GeV because this is the minimum transverse energy to fire any L1 calorimetry item (electron or photon, tau, jet, forward jet, E
Tmissand P
E
T). This cut is not present in figure 5, because the minimum bias stream contains events which do not need to fire any calorimeter based trigger. The comparison between the two figures clearly shows that the overall calorimetric activity seen at L1 is quite low for collision events, whereas it is considerably larger for cosmic ray events.
This is expected, being the result of the strong noise suppression applied at L1. Minimum
bias events deposit energy in large areas in (η, φ) space, so that each trigger tower gets a very
small fraction of it, which is often below the noise threshold. On the other hand, non-collision
events tend to deposit energy in smaller areas, increasing the fraction measured by each trigger
)2Events / (9 GeV
1 10 102
103
104
(GeV) MET_Base Missing ET
0 10 20 30 40 50 60
(GeV) TL1 Missing E
0 10 20 30 40 50 60
ATLAS Preliminary
)2Events / (36 GeV
1 10 102
103
(GeV) MET_Base Sum ET
0 20 40 60 80 100 120
(GeV)TL1 Sum E
0 20 40 60 80 100 120
ATLAS Preliminary
)2Events / (9 GeV
1 10 102
103
104
(GeV) MET_Base Missing ET
0 10 20 30 40 50 60
(GeV) TEF Missing E
0 10 20 30 40 50 60
ATLAS Preliminary
)2Events / (36 GeV
1 10 102
103
(GeV) MET_Base Sum ET
0 20 40 60 80 100 120
(GeV)TEF Sum E
0 20 40 60 80 100 120
ATLAS Preliminary
Figure 5: E
Tmiss(left) and P E
T(right) distributions from the collision candidates, measured at L1 (top) and EF (bottom), are compared to the offline reconstruction.
tower. This means that it is more likely that a better correlation with offline (and EF, not shown here) P
E
Tis visible for e.g. cosmic rays than collision candidates. In practice, as shown in figures 4 and 5, most of the correlation disappears when selecting collision candidates, for which the cosmic ray contribution is almost negligible. It is expected that the correlation appears again for events containing very energetic objects.
At EF, the main feature of P
E
Tis the presence of the bias due to the choice of a 1-sided cut. As said above, this automatically protects against large negative energies which may arise from hardware problems (which get filtered out during offline reconstruction but cannot be avoided online), but also lacks the balancing effect of negative energy fluctuations. Both vector and scalar sums are computed by the same algorithms, and the small bias in the scalar sum is tolerated because of the better robustness of the vector sum. The effect of the EF bias becomes almost negligible above roughly 50 GeV, as shown in the bottom-right plots of figures 4 and 5.
3 Distributions after consecutive cuts
In this section, the result of nested selections is shown for events belonging either to the MinBias stream or to the L1Calo stream. From the trigger point of view, the “signal” is what can be found in the L1Calo stream. However, the physicist considers “signal” only the actual collisions.
Finally, in data analysis the “signal” is whatever survives the cuts, and the removal of bad events
discussed in section 2.3 (or some cleanup which gets very similar results) is a standard selection
used in practically all analyses.
(GeV) L1 Missing ET
0 20 40 60 80 100
Events / (3 GeV)
1 10 102
103
104
105 Random stream
Collision candidates Coll. cand. with L1Calo Good events with L1Calo
ATLAS Preliminary
(GeV) L1 Sum ET
0 50 100 150 200
Events / (6 GeV)
1 10 102
103
104
105 Random stream
Collision candidates Coll. cand. with L1Calo Good events with L1Calo
ATLAS Preliminary
(GeV) at e.m. scale EF Missing ET
0 20 40 60 80 100
Events / (3 GeV)
1 10 102
103
104
105
Random stream Collision candidates Coll. cand. with L1Calo Good events with L1Calo
ATLAS Preliminary
(GeV) at e.m. scale EF Sum ET
0 50 100 150 200
Events / (6 GeV)
1 10 102
103
104
105
Random stream Collision candidates Coll. cand. with L1Calo Good events with L1Calo
ATLAS Preliminary
(GeV) MET_Base Missing ET
0 20 40 60 80 100
Events / (3 GeV)
1 10 102
103
104
105
Random stream Collision candidates Coll. cand. with L1Calo Good events with L1Calo
ATLAS Preliminary
(GeV) MET_Base Sum ET
0 50 100 150 200
Events / (6 GeV)
1 10 102
103
104
105
Random stream Collision candidates Coll. cand. with L1Calo Good events with L1Calo
ATLAS Preliminary
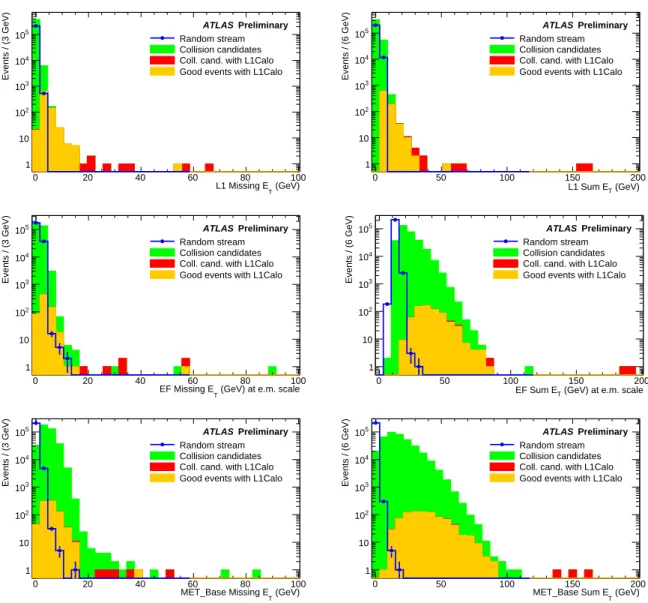
Figure 6: E
Tmiss(left) and P E
T(right) distributions measured at L1 (top), EF (middle) and offline (bottom) for different event selections operated on the MinBias stream. The random stream distributions are shown for comparison.
3.1 Starting from collision candidates
The cumulative effect of different event selection cuts on the MinBias stream is shown in figure 6 for trigger and offline measurements of E
Tmissand P
E
T. Such plots show the distributions ob- tained starting with collision candidates and by successively applying more and more restrictive criteria:
1. collision candidates from the MinBias stream (selected requiring a time difference consis- tent with zero in MBTS and LAr);
2. collision candidates which also triggered L1Calo;
3. collision candidates with L1Calo triggers, without events with badly reconstructed jets or
isolated energy blobs.
The distributions obtained with the random stream are also displayed, even though they do not correspond to the same integrated luminosity, in order to indicate the regions where the noise is expected to contribute.
The E
Tmissdistribution has a large overlap with the noise even after the most stringent selection, as expected in 900 GeV proton-proton collisions. On the other hand, the overlap is much smaller for P
E
T, which accounts for the total calorimetric activity in the event. L1Calo triggers are sensitive to localized objects (jet, egamma and tau signatures), in addition to the total energy, so that they significantly suppress the noise contribution. The difference between the samples is most apparent in the distributions measured at EF and offline, because L1 has a more severe noise suppression. As already noted above, the EF P
E
Tdistribution has some offset due to the choice of applying a 1-sided noise suppression cut on each calorimeter cell. This appears clearly at low energy but does not significantly alter the tail of the distribution, which is important for the rate estimates.
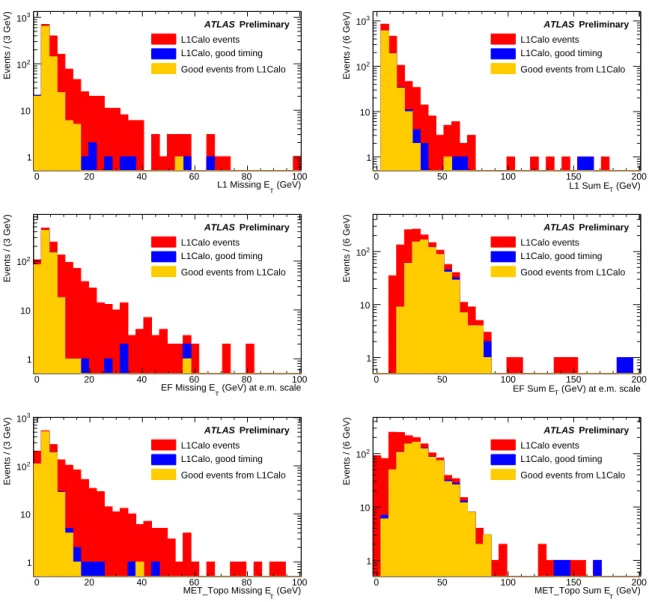
3.2 Starting from L1Calo events
The effect of the different event selections is also shown in figure 7, starting from the L1Calo stream. The distributions of trigger and MET Topo E
Tmissand P
E
Twere obtained for:
1. all events falling in the L1Calo stream;
2. the subset of L1Calo with good timing for MBTS and LAr (collision candidates);
3. all collision candidates in the L1Calo stream without bad jets and isolated energy blobs (as explained in section 2.3).
In 2009, the collision rate was low enough that the contribution from cosmic rays in time with bunch crossings dominates the L1Calo stream. Hence, the E
Tmissdistributions are much steeper if one isolates the collision candidates from the L1Calo stream. Indeed, this eliminates most of the events in which a cosmic ray muon induced an e.m. shower in the calorimeters, which adds an asymmetric energy deposition that is reconstructed as “missing” E
T. Removing bad events further reduces the number of events with non negligible fake E
Tmissdue to bad jet reconstruction.
As mentioned above, work is in progress to find whether such cut (or a bit simpler version) can also be applied online, because the impact on the E
Tmissrate could be important.
4 Summary
The data collected by ATLAS during the first LHC operation in 2009 show that a trigger on global quantities as E
Tmissand P
E
Tis feasible for physics data taking. The comparison with the offline reconstruction shows that the rate from L1, configured with conservative settings and an aggressive noise suppression, is quite low for minimum bias events. In addition, the E
Tmissand P E
Tmeasured at EF behave not much differently from the quantities reconstructed offline, which is very important in the definition of the samples used in physics analyses. EF quantities are linearly correlated with L1 and offline, and the small P
E
Tbias due to the choice of applying
a 1-sided noise cut only affects thresholds as low as few tens of GeV. These results show that it
is safe to enable HLT rejection for the E
Tmisstrigger, when the rate becomes too high for the L1
alone.
(GeV) L1 Missing ET
0 20 40 60 80 100
Events / (3 GeV)
1 10 102
103
L1Calo events L1Calo, good timing Good events from L1Calo
ATLAS Preliminary
(GeV) L1 Sum ET
0 50 100 150 200
Events / (6 GeV)
1 10 102
103
L1Calo events L1Calo, good timing Good events from L1Calo
ATLAS Preliminary
(GeV) at e.m. scale EF Missing ET
0 20 40 60 80 100
Events / (3 GeV)
1 10 102
L1Calo events L1Calo, good timing Good events from L1Calo
ATLAS Preliminary
(GeV) at e.m. scale EF Sum ET
0 50 100 150 200
Events / (6 GeV)
1 10 102
L1Calo events L1Calo, good timing Good events from L1Calo
ATLAS Preliminary
(GeV) MET_Topo Missing ET
0 20 40 60 80 100
Events / (3 GeV)
1 10 102
103
L1Calo events L1Calo, good timing Good events from L1Calo
ATLAS Preliminary
(GeV) MET_Topo Sum ET
0 50 100 150 200
Events / (6 GeV)
1 10
102 L1Calo events
L1Calo, good timing Good events from L1Calo
ATLAS Preliminary