L O N G - T E R M I R R A D I AT I O N E F F E C T S O N R E A C T O R - P R E S S U R E V E S S E L S T E E L S
i n v e s t i g at i o n s o n t h e na n o m e t e r s c a l e
D I S S E R TAT I O N
zur Erlangung des Doktorgrades der Naturwissenschaften (Dr. rer. nat.)
der
Naturwissenschaftlichen Fakultät II Chemie, Physik und Mathematik
der Martin-Luther-Universität Halle-Wittenberg
vorgelegt von
Herrn Dipl.-Phys. Arne Wagner geb. am 13.05.1982in Kronstadt
“
A thing is a thing, not what is said of that thing.”
Susan Sontag, as quoted inBirdmanA B S T R A C T
The exposure of reactor pressure vessel (RPV) steels to neutron irradiation gives rise to irradiation-enhanced diffusion, a rearrangement of solute atoms and, conse- quently, a degradation of the mechanical properties. The increasing age of existing nuclear power plants raises new questions specific to long-term operation. Two of them are addressed in this thesis: flux effects and the late-blooming effect. Can low-flux irradiations up to a given fluence be reproduced by more rapid high-flux irradiations up to the same fluence? Can the irradiation response of RPV steels be extrapolated to higher fluences or are there unexpected “late-blooming” effects.
Small-angle neutron scattering (SANS), atom-probe tomography (APT) and Vickers-hardness testing were applied. A novel Monte-Carlo based fitting algorithm for SANS data was implemented in order to derive statistically reliable characteris- tics of irradiation-induced solute-atom clusters. APT was applied in selected cases to gain additional information on the composition and the shape of clusters. Vickers hardness testing was performed on the SANS samples to link the nanometer-scale changes to irradiation hardening.
The investigations on flux effects show that clusters forming upon high-flux irra- diation are smaller and tend to have a higher volume fraction compared to low-flux irradiations at a given neutron fluence. The measured flux dependence of the cluster- size distribution is consistent with the framework of deterministic growth (but not with coarsening) in combination with radiation-enhanced diffusion. Since the two effects on cluster size and volume fraction partly cancel each other out, no significant effect on the hardening is observed.
The investigations of a possible late-blooming effect indicate that the very existence (yes or no) of such an effect depends on the irradiation conditions. Irradiations at lower fluxes and a lower temperature (255 ◦C) give rise to a significant increase of the slope of both cluster-volume fraction and hardening versus fluence. Irradiations at higher fluxes and a higher temperature (290◦C) do not lead to significant changes of slope.
APT allows Cu-free and Cu-containing solute-atom clusters to be treated sepa- rately. It turned out that Cu-free clusters are responsible for the observation of a late-blooming effect. A two-path mechanistic model of cluster formation rationalizes these findings. An essential ingredient of the model is the Mn segregation to self- interstitial atom clusters and the operation of these objects as nuclei for the formation of Mn-Ni-Si-enriched clusters. The model also rationalizes why no late-blooming ef- fect was observed for the high-flux irradiations.
v
C O N T E N T S
a b s t r a c t v
ta b l e o f c o n t e n t s vii
a b b r e v i at i o n s a n d s y m b o l s ix
1 i n t r o d u c t i o n 1
1.1 Background . . . 1
1.2 Reactor-pressure vessel steels . . . 1
1.3 Nanostructural evolution during neutron irradiation . . . 4
1.4 Long-term irradiation effects . . . 6
1.5 Aims and scope . . . 7
2 na n o s t r u c t u r a l c h a r a c t e r i z at i o n t e c h n i q u e s 9 2.1 Overview . . . 9
2.2 Small-angle neutron scattering (SANS) . . . 11
2.2.1 Principles of SANS . . . 11
2.2.2 Transformation to size domain . . . 16
2.3 Atom-probe tomography (APT) . . . 21
2.3.1 Principles of APT . . . 21
2.3.2 Data treatment . . . 24
3 e x p e r i m e n t s 29 3.1 Materials . . . 29
3.1.1 Chemical composition . . . 29
3.1.2 Thermal treatment . . . 30
3.1.3 Irradiation conditions . . . 31
3.1.4 Tensile Tests . . . 33
3.2 Experimental set-up . . . 35
3.2.1 Small-angle neutron scattering . . . 35
3.2.2 Atom-probe tomography . . . 40
3.2.3 Vickers hardness . . . 43
4 r e s u lt s 45 4.1 Flux effects (SANS) . . . 45
4.2 Late-blooming effect (SANS) . . . 51
4.3 Late-blooming effect (APT) . . . 57
5 d i s c u s s i o n 67 5.1 Flux Effects . . . 67
5.1.1 Approach . . . 67
5.1.2 Normalization of cluster parameters . . . 67
5.1.3 Models of cluster evolution . . . 69
5.1.4 Models of hardening . . . 73
5.2 Late-blooming effect . . . 79
vii
viii ta b l e o f c o n t e n t s
5.2.1 Overview . . . 79
5.2.2 Heterogeneous nucleation via Cu-vac mechanism . . . 83
5.2.3 Heterogeneous nucleation via Mn-SIA mechanism . . . 84
5.2.4 Origin of the change of slope . . . 86
5.2.5 RH irradiation versus BR2irradiation . . . 88
6 c o n c l u s i o n s 91
b i b l i o g r a p h y 95
l i s t o f p u b l i c at i o n s 107
l i s t o f f i g u r e s 109
l i s t o f ta b l e s 111
a c k n o w l e d g m e n t s 113
d e c l a r at i o n 115
A B B R E V I AT I O N S A N D S Y M B O L S
α Obstacle strength
β Geometry factor of APT tip
∆η Scattering contrast
∆R Cluster radius increment
∆σy Yield stress increase
∆TT Transition temperature shift
∆HV10 Vickers hardness increase η Scattering length density θ Half scattering angle
λ Neutron wave length
ρCL Threshold of cluster element concentration
φ Neutron flux
φt Transition neutron flux
φt Neutron fluence
ψ Neutron wave function
a Lattice parameter of bcc Fe aDLD Advance delay line detector
A Aratio
APT Atom-probe tomography
bnuc/mag Nuclear/magnetic scattering length
b Burgers vector
BKS Bacon-Kocks-Scattergood
BR2 Material-test reactor in Mol, Belgium Cm Monomer concentration
CL Cluster elements
CoS Change of slope
CRC Cu-rich cluster
CVN Cu-vacancy nucleus
ds SANS sample thickness dat Atomic plane distance
d Obstacle diameter
dΣ/dΩ Macroscopic scattering cross section Dth Thermal diffusion constant
DB Dispersed barrier
Ebind Lattice binding energy Ekin Kinetic energy of a neutron E Electric field strength
ECoWATAP Energy compensated wide-angle tomographic atom probe
ix
x a b b r e v i at i o n s a n d s y m b o l s
fv Cluster volume fraction
F SANS form factor
FEG-STEM Field-emission gun - scanning TEM FlexTAP Flexible tomographic atom probe FKH Friedel-Kroupa-Hirsch
FP Frenkel pair
G Shear modulus
Gm Monomer generation term
GiPS Gamma-induced positron spectroscopy I SANS scattering intensity
ICP-MS Inductively coupled plasma-mass spectrometry IFT Indirect Fourier transformation
kb Boltzmann constant
Km Monomer reaction-rate constant L APT sample-detector distancer LBE Late-blooming effect
LTO Long-term operation
LaWATAP Laser-assisted wide-angle tomographic atom probe m/n Mass-over-charge ratio
M Taylor factor
MCF Monte Carlo fitting MCP Micro-channel plate
MD Matrix damage
ME Maximum entropy
MNC Mn-Ni(-Si)-rich cluster MTR Material-test reactor
n Ion charge state
Nmon Neutron monitor counts
N Cluster number density
NPP Nuclear power plant
P APT projection point
PAS Positron-annihilation spectroscopy
PD Point defect
PFPE Perfluoropolyether PKA Primary knock-on atom PSD Position sensitive detector Qact Activation energy
Qeff APT detector efficiency
Q SANS scattering vector
r0 Monomer recombination radius re Classical electron radius
R¯ Mean cluster radius Rgyr Radius of gyration Rmax Maximum cluster radius
a b b r e v i at i o n s a n d s y m b o l s xi
Rmin Minimum cluster radius Rtip Tip radius of APT needle
RB Russel-Brown
RED Radiation-enhanced diffusion
RH VVER prototype reactor in Rheinsberg, Germany RPV Reactor pressure vessel
S SANS structure factor
SANS Small-angle neutron scatering SD SANS sample-detector distance SEM Scanning-electron microscopy SIA Self-interstitial atom
SIAC Self-interstital atom cluster tirr Irradiation time
Tirr Irradiation temperature T SANS transmission factor
TEM Transmission electron microscopy TOF Time of flight
U∼ High frequency voltage
U0 Standing voltage
Um Monomer interaction energy Vat Volume of bcc-Fe atom VVER Water-water energetic reactor
I N T R O D U C T I O N
1
1.1 b a c k g r o u n d
The global demand of emission-free electricity continues to rise in today’s society.
Nuclear energy is one pillar of energy sources available in Europe, constituting about 30 % of the current mix of techniques. However, over a third of the nuclear power plants (NPPs) in Europe are older than30 years [1] and are going to reach the end of their planned lifetime in ten years or less. One of the strategies to satisfy the increased energy demand, without increasing the global carbon dioxide emission, is the extension of the lifetime of the NPPs from originally planned 40 years of operation to60–80years.
This raises the essential question, whether the long-term operation (LTO) of an NPP poses potential safety risks, in particular with regard to long-term irradiation effects on the reactor-pressure vessel (RPV), which is the main barrier for shielding the radioactive fuel from the outer environment. Since the RPV is considered to be irreplaceable, its structural integrity directly limits the lifetime of an NPP.
During its operation, the RPV is exposed to high energy neutrons emitted from the core fuel. This has significant detrimental effects on the mechanical properties of the RPV, which manifest themselves in an increased hardening and embrittlement of the material. Since the early 1970s, the effects of neutron irradiation on RPV steels have not only been studied by mechanical testing but also on a nanostructural level.
It was revealed that the deterioration of the mechanical properties mainly originates from nanometer-sized defect-solute clusters, which impede the free movement of dis- locations in the Fe lattice. Despite the significant progress that has been made in the understanding of the nature of irradiation-induced features, some major points, in particular related to long-term effects of neutron irradiation, are not well understood.
This is a matter of ongoing international research projects.
1.2 r e a c t o r-p r e s s u r e v e s s e l s t e e l s
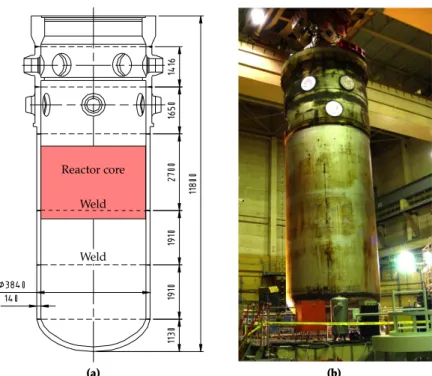
r p v c o n s t r u c t i o n: The RPV in a light-water reactor is made from a low-alloy ferritic steel with a body-centered cubic (bcc) lattice structure. During manufactur- ing, the steel is forged to rings of about 3 to 4 m in diameter, which are welded to form the circumferential part of the pressure vessel. Fig. 1 shows a technical draw- ing and a photograph of an RPV from the now decommissioned VVER-prototype reactor in Greifswald, Germany. The highlighted region next to the reactor core is exposed to the highest neutron fluences. This region consists of base material and weld. Both base material and weld are required to be investigated.
1
2 i n t r o d u c t i o n
(a) (b)
Reactor core Weld
Weld
Figure1:(a) Technical drawing of a VVER-type RPV, dimensions given in mm. The highlighted region next to the reactor core is exposed to the highest neutron fluences. (b) Photograph of a dismounted RPV of the decommissioned VVER-prototype reactor in Greifswald, Germany.
By courtesy of Dr. H.-W. Viehrig.
For safe operation, the steels used for RPVs are required to have a high fracture toughness to prevent brittle fracture even under severe loading conditions, such as a pressurized thermal shock during emergency cooling.
The required properties of the steels are obtained with the addition of alloying elements to the heat, followed by a specific thermal treatment. The chemical com- position and the heat treatment govern not only the initial mechanical properties of the metal but also the sensitivity to neutron irradiation. The three alloying ele- ments [2] known to be most responsible for the sensitivity to neutron irradiation are Manganese, Nickel and Silicon.
– The addition of Mn reduces the brittleness of the steel by binding free sulfur.
Furthermore, Mn refines the grain structure and acts as a deoxidizing agent.
– Ni is added to increase fracture toughness and improve forgeability.
– Si is added to operate as deoxidizer at the molten stage.
Some impurity elements such as Copper and Phosphorus are also known to have a significant influence on the steel’s susceptibility to irradiation.
– Cu has a solubility limit of about 0.005 wt.% [3, 4] at typical RPV operation temperatures. Since the late 1960s it is known that residual Cu can cause se- rious hardening and embrittlement upon neutron irradiation. In modern RPV steels the residual Cu is restricted to be well below 0.05 wt.%.
1.2 r e a c t o r-p r e s s u r e v e s s e l s t e e l s 3
– P tends to segregate to the grain boundaries of the steel. This can lower the cohesion between grains and can, therefore, lead to intergranular fracture in the material, which is the origin of non-hardening embrittlement.
To summarize, the sensitivity to irradiation of the steel is governed by the material composition, that is, the type and amount of alloying elements added to the heat and the purity with regard to residual elements.
r p v i r r a d i at i o n: The fuel core in the center of the RPV emits high energy neutrons. The surrounding materials are exposed to a relatively low neutron flux between 1.2 and 4·1010 n cm−2 s−1. After 40 years of operation [5] this amounts to a fluence of about 4·1019n cm−2.
As the continuous irradiation of the RPV leads to a degradation of the mechan- ical properties, this process needs to be monitored. One approach for this safety assessment is based on the accelerated irradiation of surveillance samples. To this end, samples of the same base and weld material as used for the actual RPV are in- serted into an irradiation channel close to the fuel rods. The increased neutron flux at this position leads to the accumulation of a certain fluence level in a shorter time period. After a specific sample accumulated the required fluence, it is removed from the irradiation channel and its mechanical properties are tested. The test results give insight to the irradiation susceptibility of the specific material used for the RPV, and the material behavior during the next surveillance interval can be anticipated.
Additionally, an interest to describe the materials behavior under irradiation in terms of empirical embrittlement trend curves arose. These trend curves express the hardening and embrittlement as a function of neutron fluence as a shift in Charpy impact transition temperature, ∆TT. ∆TT can also be expressed in terms of an in- crease in yield stress, ∆σy, or hardening, ∆HV10, since the three units are strongly correlated. There are different assumptions on how embrittlement evolves as a func- tion of neutron fluence. In most cases, a power-law dependence turned out to be suitable:
∆TT= χ(φt)n (1)
The chemical pre-factor, χ, expresses the dependency of the embrittlement on the chemical composition of the steel. The exponent, n, is less than one and was found [6] to be in many cases aroundn = (0.4±0.2), as shown in Fig.2, indicated by the black solid line and the grey scatter band.
However, there is increasing evidence [7–9] that under certain conditions the flu- ence dependence of hardening and embrittlement does not follow a power-law-like dependency with an exponentn<1. Instead, a late onset of an additional embrittle- ment mechanism was anticipated [7]. The main feature of this behavior is a (gradual or abrupt) change of slope, typically an increase of slope of the curve. This effect, also referred to as late-blooming effect (LBE), is depicted by the dotted line in Fig.2.
4 i n t r o d u c t i o n
0 2 4 6 8
Neutron fluence,φt(1019cm−2)
Transitiontemperatureshift,∆TT ?
Onset
Typical trend∝(φt)n,n= (0.4±0.2) Late blooming effect
Figure2:Schematic plot of the evolution of the irradiation damage, represented by the transition tem- perature shift,∆TT, as a function of neutron fluence,φt, and its exponent,n.
1.3 na n o s t r u c t u r a l e v o l u t i o n d u r i n g n e u t r o n i r r a d i at i o n
The nuclear fission in the reactor core leads to the emission of high-energy neutrons penetrating the surrounding materials. If a high-energy neutron passes through an RPV steel, it can collide with lattice atoms of the metal. A neutron with a kinetic energy of Ekin = 1 MeV transfers up to 70 keV to a single Fe atom. The energy transfer from the high-energy neutron to this primary knock-on atom (PKA) leads to its displacement from the lattice site. The accelerated PKA interacts with the surrounding lattice atoms in a series of collisions, leading to further displacements of surrounding atoms in a tree-like manner and the formation of Frenkel pairs (FPs).
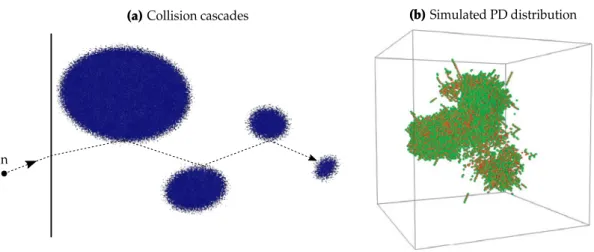
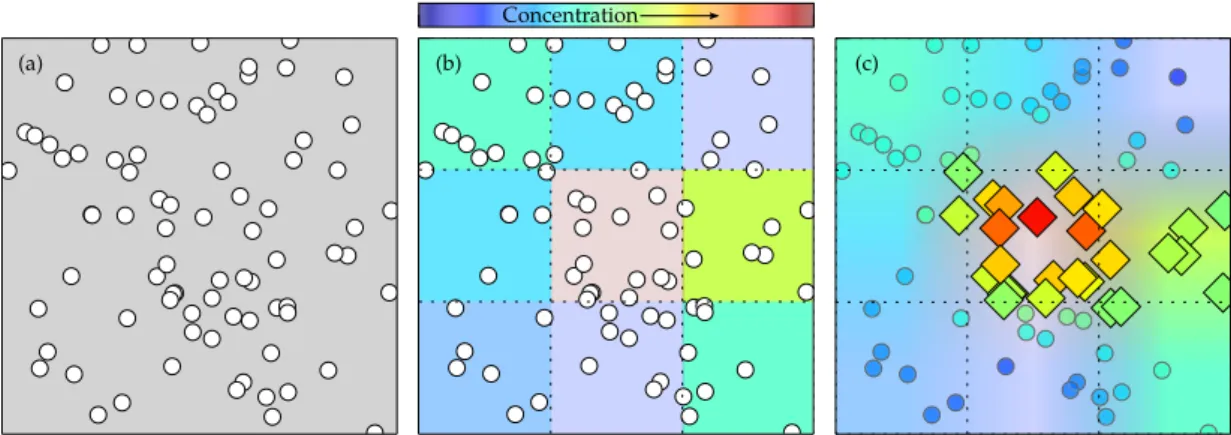
Part of the recoil energy during this process dissipates in the electron cloud of the metal. This process continues until the energy of the PKA is lower than the lattice binding energy of Ebind = 40 eV in bcc Fe. The maximum number of FPs created during the cascade is reached within 1 to 2 ps. A single neutron-PKA collision can induce several hundreds of displacements in the surrounding volume. A schematic representation of the collision cascade caused by a single high-energy neutron is shown in Fig. 3a. Fig. 3b shows a simulated [10] distribution of vacancies (red) and interstitials (green) at the time of maximum damage. The majority of vacancies and interstitials annihilate already within 5−7 ps after the neutron collision and, depending on the irradiation temperature, only a small fraction of point defects (PDs) remains in the surrounding lattice volume.
PDs are mobile in the lattice. Interstitials migrate and rearrange to form disk- shaped self-interstitial clusters, also referred to as dislocation loops. Similarly, vacan- cies migrate and form vacancy clusters. Grain boundaries and pre-existing disloca- tions act as point defect sinks. The supersaturation of PDs, in particular vacancies, in the Fe lattice leads to irradiation-enhanced diffusion of solute atoms giving rise to the rearrangement of solute atoms including the formation of solute atom clus- ters and the segregation to grain boundaries. Dislocation loops, vacancy clusters
1.3 na n o s t r u c t u r a l e v o l u t i o n d u r i n g n e u t r o n i r r a d i at i o n 5
n
(a) Collision cascades (b) Simulated PD distribution
Figure3:(a) Schematic representation of a collision cascade. PDs are represented by blue dots. (b) Simulated PD distribution [10] of a collision event at peak damage for a 20 keV incident neutron. Vacancies and interstitials are indicated by red and green spheres, respectively.
and solute atom clusters additionally impede the movement of dislocations through the lattice. This is the origin of the increase in hardening and embrittlement upon neutron irradiation.
The nano-scale features formed upon neutron irradiation are typically character- ized in two main categories, that is, matrix damage (MD) and solute-atom clusters.
MD refers to self-interstitial atoms, vacancies and their clusters.
Solute-atom clusters comprise alloying and impurity elements, such as Cu, Mn, Ni and Si. Depending on the Cu content of the RPV steel, two different types of clusters, which form upon neutron irradiation, are typically distinguished in the literature. In high-Cu steels, Cu is the main constituent of the clusters forming during neutron irradiation. These clusters are known as Cu-rich clusters (CRCs). Other elements, such as Mn and Ni, are also found in the CRCs, but to a lesser extent than Cu.
In low-Cu steels (< 0.1 wt.% Cu), the clusters are composed mainly of Mn, Ni and Si and only a small amount of Cu is found. By definition, a cluster is referred to as Mn-Ni(-Si-rich) cluster (MNC) if the sum of Mn, Ni and Si atoms is more than the amount of Cu atoms.
Note that the distinction between low- and high-Cu material at a threshold of 0.1 wt.% Cu is not made due to physical considerations. In fact, it is generally accepted in the literature [5,11–13] that CRCs are the predominant features at Cu levels well above 0.1 wt.% and MNCs well below this value, with a region of overlap near this threshold.
The formation of CRCs in irradiated high-Cu steels can be rationalized by the strong supersaturation of Cu in the Fe matrix. Neutron irradiation, leading to radiation-enhanced diffusion [14], merely accelerates the precipitation of Cu.
In contrast, this reasoning cannot be adopted to the formation of MNCs in low- Cu RPV steel. The concentrations of Mn, Ni and Si are well below the solubility limit at typical irradiation temperatures. Thus, under separate consideration of the
6 i n t r o d u c t i o n
solubility limits of either Mn in Fe or Ni in Fe or Si in Fe, the solutes would stay in solid solution even upon neutron irradiation.
1.4 l o n g-t e r m i r r a d i at i o n e f f e c t s
MNCs were clearly identified only in the mid-1990s, when newly acquired SANS and FEG-STEM data were combined [15] with previously published [16] SANS results.
In subsequent studies [7, 11, 17], the experimental findings [15] of MNCs were reproduced by means of equilibrium lattice Monte Carlo simulations [7,11,17] with inputs taken from a CALPHAD [18] database. According to these simulations, it is energetically favorable for Mn, Ni and Si to cluster around a core of Cu atoms and to form a new phase. A low irradiation temperature, high fluence and low neutron flux, i.e. long irradiation times, would favor the formation of such a phase [7,11,15, 17].
In addition, the simulations predicted an incubation period for the formation of MNCs in high-Cu materials. At high fluence levels, once most of the supersaturated Cu in a high-Cu steel is trapped in CRCs, the matrix is low in Cu concentration. In the matrix, now being essentially a low-Cu steel, the formation of MNCs is triggered and the cluster volume fraction increases again at a different rate. It is due to the delayed appearance of these thermodynamically stable phases that MNCs are also known aslate-blooming phases(LBPs).
Recently, the naming LBP has been under debate, e.g. [19, 20], as the naming implicates much about the origin and nature of these features. This is, however, a matter of ongoing scientific discussions: While the classical approach on the basis of Odette’s findings [15] suggests that MNCs are thermodynamically stable phases and that these phases appear late, i.e. after exceeding a threshold fluence, more recent publications [19, 21–23] argue that the formation of MNCs cannot be explained on thermodynamical grounds, but is rather a consequence of solute-atom segregation to PD clusters. In any case, agreement on the dominant formation mechanism and detailed structure of MNCs has not yet been reached.
The label “late-blooming effect” (LBE) seems to be more appropriate than the debatable term “late-blooming phase”, as it does not implicate any assertion on the formation mechanism or thermal stability of the nanoscale features.
The other long-term irradiation effect discussed in this thesis is the influence of neutron flux on the irradiation response of RPV steel. As introduced in Section 1.2, the standard safety procedure in NPPs is based on the accelerated irradiation, that is irradiations at higher flux of surveillance samples to anticipate the neutron embrittlement at higher fluence levels in a shorter period of time. In some reactors, typically in those of highest age, surveillance material was not foreseen, is used up or not available for additional testing to a sufficient extent.
Whether or not surveillance samples are available, research aimed at assessing safe operation is accompanied by more basic, understanding-oriented research. The required irradiations are performed in material-test reactors at even higher fluxes
1.5 a i m s a n d s c o p e 7
than those allowed for the purpose of surveillance testing. This additionally raises the importance of an understanding of flux effects. How the flux effects manifest themselves in terms of differences in the nanostructure and the mechanical proper- ties of the RPV steels, and whether these two domains are interrelated, is discussed in this thesis.
For both, LBE and flux effects, the nano-scale characterization of the irradiation- induced features is crucial for the understanding of the underlying formation mecha- nisms. On this basis, it can provide qualitative and quantitative insight on long-term operation behavior of the RPV steel.
It is important to recognize that the both small size and the low concentration of irradiation-induced features in RPV steels make their characterization extremely challenging. Standard techniques, such as optical microscopy or scanning-electron microscopy (SEM), are not able to resolve the nanometer-sized irradiation-induced features. In fact, no single technique by itself is able to characterize the irradiation- induced features in all aspects. For this, a combination of several techniques is required.
1.5 a i m s a n d s c o p e
The present work is going to investigate two of the main issues [24] with regard to long-term irradiation of RPV steels: The so-called flux effects and the late-blooming effect. The investigations are motivated by the fact that the current knowledge of these effects is still limited. Knowledge gaps include:
– the functional form of the flux dependence of cluster size and volume fraction, – the consequences for the mechanical properties,
– the significance and origin of the change of slope in the fluence dependence of the nanofeature characteristics and the resulting mechanical properties.
First, the issue of flux effects is going to be investigated. For this, pairs of sam- ples of RPV steels which have been neutron irradiated to the same level of fluence, with fluxes as different as possible, are selected. The sample pairs are characterized by means of SANS and hardness tests. SANS enables the characterization of the irradiation-induced clusters in the materials. The evolution of the characteristics of the cluster population is going to be contrasted with two analytical models of cluster evolution, namely deterministic growth and coarsening. Subsequently, the nanos- tructure evolution is going to be linked to the changes in mechanical properties with a number of analytical hardening models. Finally, the significance of flux effects on the nanostructure and mechanical properties of the materials are elaborated.
Second, the appearance of the late-blooming effect is investigated. Typically, the irradiation damage in an RPV is expected to show a smooth, square-root like depen- dence on the neutron fluence. Under certain conditions, deviations from the typical smooth irradiation response may occur [24]. In the present work, two RPV steels, for
8 i n t r o d u c t i o n
which such a discontinuous irradiation response was reported [8] in both nanostruc- tural and mechanical properties, are investigated. This involves the characterization of additional irradiation conditions of the same materials and the compilation of supplementary information on the irradiation-induced clusters, such as the shape and the chemical composition of clusters, by means of APT. The APT and SANS data are then going to be used to evaluate several models of cluster evolution, which were reported to be the origin of a sudden increase of irradiation response.
The present thesis is organized as follows: Chapter2introduces the nanostructural characterization methods, namely small-angle neutron scattering and atom-probe to- mography, which are applied in this work to characterize the features arising from neutron irradiation. The assumptions and concepts used for data treatment are pre- sented.
Chapter3 covers the materials including composition, thermal treatment, irradia- tion conditions and basic mechanical properties. This is followed by a description of the experimental set-ups and the parameters used for the SANS and APT experi- ments.
The experimental results are presented in Chapter 4, separately for flux effects (SANS) and the late-blooming effect (SANS & APT).
The first part of the discussion, Chapter5, is dedicated to flux effects. The results on flux effects are compared with analytical models of cluster evolution and harden- ing. The second part addresses the late-blooming effect. The experimental findings are contrasted with data from the literature. A two-path model of cluster evolution is proposed. Furthermore, the conditions under which a late-blooming effect occurs are considered.
Chapter6summarizes the findings of this thesis. Conclusions are drawn.
2
N A N O S T R U C T U R A L C H A R A C T E R I Z AT I O N T E C H N I Q U E S
This chapter covers a general overview of nanostructural characterisation techniques typically used for the analysis of irradiation damage in RPV steels. As the irradiation- induced defects have sizes in the nanometer range and concentrations lower than 0.1 vol.%, standard methods, such as optical microscopy and scanning electron mi- croscopy, are not suitable. This is also the reason why usually a number of techniques are put to use, such that a more complete picture of the irradiation damage can be obtained.
In the present work, small-angle neutron scattering (SANS) and atom-probe to- mography (APT) are applied for the characterisation of irradiation damage. The general overview is followed by a more detailed description of both SANS and APT.
2.1 ov e r v i e w
Small-angle neutron scattering (SANS)
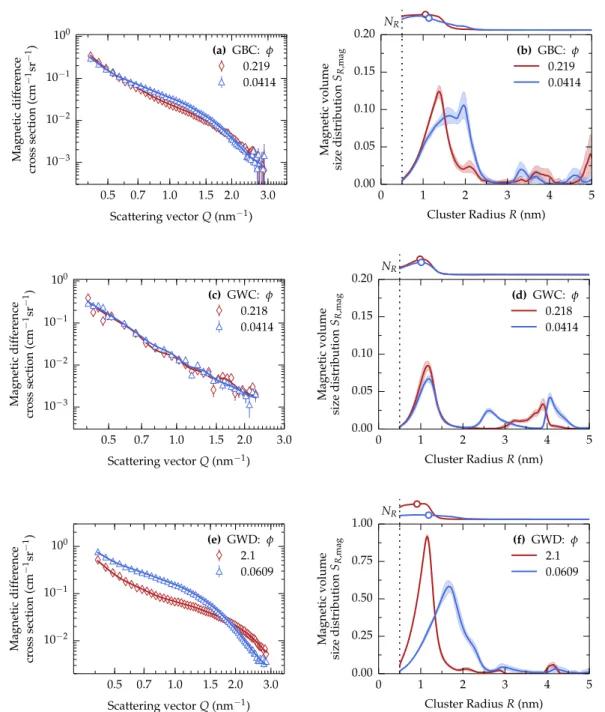
Small-angle neutron scattering [25, 26] is able to resolve nanometer-sized features in irradiated RPV steels. Solute clusters in a size range from 0.5 to up to 100 nm are identified through an increase in scattering intensity. Information on the size distribution of scatterers, their number density and volume fraction is obtained with an inverse transformation of the scattering pattern.
SANS is able to probe a sample volume of several tenths of mm3, while still resolv- ing changes on a sub-nanometer scale. Apart from the information about the size and density of clusters, additional information about the average chemical composi- tion of clusters is obtained.
Atom-probe tomography (APT)
Atom-probe tomography (APT) is based on field evaporation of atoms from a small sample volume of about 100×100×500 nm3 [27, 28]. APT can resolve a three- dimensional distribution of elements within the probed sample volume. One mea- surement consists of the position and type of element of several tens of millions of atoms. The acquired three-dimensional dataset is analyzed for heterogeneities, such as solute clusters, utilizing cluster-detection algorithms. These yield information on the size distribution of clusters, their number density, volume fraction and chemical composition. The lower detection limit in cluster size strongly depends on the effi- ciency of the used detector. The APT devices used in the present work are able to resolve clusters with radii of about>0.4 nm.
9
10 na n o s t r u c t u r a l c h a r a c t e r i z at i o n t e c h n i q u e s
Positron-annihilation spectroscopy (PAS)
In contrast to SANS and APT, positron annihilation spectroscopy (PAS) is sensitive to open-volume defects [29]. Positrons are the anti-particles of electrons and can be used to probe a material for positron affine heterogeneities, such as vacancies, dislocation loops or special types of solute clusters.
The technique is non-destructive and involves the injection of positrons into a specimen. After thermalization, diffusion and trapping, the positrons eventually annihilate with the electrons in the material [29]. An annihilation event produces two coincidentallyγ-rays at an angle of approximately 180◦ and an energy of about 511 keV.
The presence of lattice defects, i.e. positron traps, in the irradiated material matrix modifies the outcome of the annihilation events in relation to an undamaged refer- ence condition. By evaluating the spectrum of positron lifetimes and/or the energy spread (Doppler broadening) and angles between the emitted γ-rays, information about the type, size and concentration of the defects is obtained. PAS is an extremely sensitive technique and can resolve single-vacancy defects at very low concentra- tions (1 ppm). A detailed discourse on the theory and various applications of PAS are available elsewhere [29].
PAS has been used to investigate irradiation damage in model and RPV steels since the mid-1980s [30–33]. It is important to note that conventional PAS experiments on neutron-irradiated RPV steels are particularly difficult to perform and to analyze. In conventional PAS,22Na is used as positron source. Theβ+decay in the source emits a singleγquantum, which is used as a start signal for the lifetime measurement. Un- fortunately, the γ-start signal overlaps with the 60Co decay at 1.2 to 1.3 MeV, which occurs in neutron-irradiated RPV steels. One approach reducing the background sig- nal from the60Co decay is to use triple coincidence measurements, which enables the filtering of the data for real annihilation events. However, triple coincidence leads to a considerable prolongation of measuring time to several days or weeks per spec- imen. A more advanced approach is to use Gamma-induced Positron Spectroscopy (GiPS) [34,35]. With GiPS, the start signal for lifetime measurement is automatically known from a pulsed beam of bremsstrahlung and therefore not influenced by the
60Co decay in radioactive steels. In addition, GiPS measures over the whole sample thickness, i.e. surface effects are mitigated.
Transmission electron microscopy (TEM)
Transmission electron microscopy (TEM) is a method capable of characterizing ma- trix damage, such as dislocation loops in RPV steels [36,37]. The technique involves the transmission of electrons with energies of several 100 keV through a thin (30 to 100 nm) specimen. The scattered electrons give information about phase, lattice periodicity and electron densities in the sample.
2.2 s m a l l-a n g l e n e u t r o n s c at t e r i n g(s a n s) 11
2.2 s m a l l-a n g l e n e u t r o n s c at t e r i n g (s a n s) 2.2.1 Principles of SANS
The neutron is a subatomic particle with a mass of 1.674×10⁻²⁷kg. It is a spin-
1/2 particle with a magnetic moment of −1.041×10⁻³ µB. A free neutron has a mean lifetime of 885.7 s, after which it decays into a proton, an electron and an antineutrino. Thus, its lifetime is long enough to perform scattering experiments, if a readily available neutron source is present. Currently, there are two types of neutron sources available, which yield neutron fluxes sufficient for the conduction of SANS experiments, that is, nuclear reactors and spallation sources. The former generates a continuous stream of neutrons as a product of nuclear fission, while the latter produces neutrons (typically pulsed) via the collision of high-energy protons with a target.
The following section gives an overview on the scattering of neutrons at small angles (< 5◦) and introduces the assumptions that are made during the analyses of the SANS data in the present work.
Under the assumption of a monochromatic neutron beam with a wavelength, λ, the steady state incident neutron wave is expressed as a planar wave function
ψ(x)i =ψ0exp(ikix) , (2) at a distance x from the nucleus. The wave vector ki has a magnitude of ki = 2π/λ. The scattering of a neutron on a point-like nucleus at distancer gives rise to a spherical symmetrical wave function
ψ(r)s =−bnucr ψ0exp(−iksr) . (3) The nuclear scattering length,bnuc, does not depend in a systematic manner on the atomic number of the nucleus. Its value can be negative, as for Mn (−3.73 fm) and even varies between different isotopes of the same element, as for54Fe and56Fe with nuclear scattering lengths of 4.21 and 9.94 fm, respectively [38]. The non-periodicity of bnuc is a major advantage of SANS over small-angle X-ray scattering (SAXS), as elements adjacent in the periodic table show a distinct difference in bnuc.
Moving from the scattering on a single nucleus in Eq. (3) to the scattering on an array ofnnuclei, we get
Ψs= −
∑
n jbj
r Ψ0exp(ikr)·exp(iQr) . (4)
The wave vector,k, changes only in direction and not in magnitude due to the elastic neutron-nuclei interaction [25]. The difference between incident wave vector,ki, and scattered wave vector,ks, defines the scattering vector,Q, as illustrated in Fig.4.
12 na n o s t r u c t u r a l c h a r a c t e r i z at i o n t e c h n i q u e s
ks
ki
Q 2θ
Figure4:Geometrical relationship between the incident and scattered wave vector,ki andks, respec- tively, and the scattering vector,Q.
The magnitude of Qis expressed in inverse length units (nm−1) of the reciprocal space, given with
Q= 4π
λ sinθ
, (5) where 2θis the scattering angle. In SANS, the intention is to observe structures larger than the interatomic distances. Therefore, the scattering angle is chosen to be smaller than about 5◦ to avoid the observation of high-intensity Bragg peaks.
It is interesting to note that Eq. (5), when combined with Bragg’s law, gives an estimate of the necessaryQrange that needs to be measured to observe scatterers of radii, R:
Q= π
R or, vice-versa R= π
Q . (6)
As a rule of thumb, the highest scattering vector Qmaxneeds to be about 3.1 nm−1to resolve structures of radii of aboutR=1 nm.
The differential cross section over a solid angle, Ω, for an array of n nuclei is written as
dσ
dΩ(Q) = 1 n
∑
n jbj·exp(iQr)
2
. (7)
If the sum over natoms is replaced by the integral over the scattering-length den- sity,η(r) =∑bi/Vi,at, Eq. (7) becomes the macroscopic cross section
dΣ
dΩ(Q) = n Vtot
dσ
dΩ(Q) = 1 Vtot
Z
Vη(r)·exp(iQr)dr
2
, (8)
which is normalized by the total sample volume, Vtot. Only deviations,∆η(r), from the average scattering-length density, ¯η, contribute to the scattering intensity. With η(r) =∆η(r) +η, it follows that¯
dΣ
dΩ(Q) = 1 Vtot
Z
V1
∆η(r)exp(iQr)dr
2
. (9)
2.2 s m a l l-a n g l e n e u t r o n s c at t e r i n g(s a n s) 13
From Eq. (9), we can see that the intensity of the signal that is measured in SANS is ultimately a consequence of heterogeneities in the scattering-length density,∆η, in the sample volume. Moreover, the integral term is equivalent to the Fourier trans- form of the spatial arrangement of these heterogeneities. Unfortunately, by mea- suring dΣ/dΩ, the phase information gets lost in the scattering-cross section due to the square of the Fourier transform. Therefore, it is not possible to simply per- form an inverse Fourier transform of the measured cross section dΣ/dΩ to retrieve information about the spatial distribution ofη(r).
For a two-phase system, the scattering-length density becomes independent ofr, such that∆η2= (η1−η2)2 and
dΣ
dΩ(Q) = 1 Vtot∆η2
Z
V1
exp(iQr)dr
2
. (10)
For scatterers of identical shape, Eq. (10) is represented as dΣ
dΩ(Q) =∆η2 NV2(R)·F(Q,R)·S(Q,R), (11) where N = ν/Vtot is the number density of scatters and ν is the number of scatter- ers. The structure factor, S, is related to the pair-correlation function and contains information about interference between singular scatterers. For the case of a dilute system, which is adequate for the materials investigated in this work, S becomes equal to one.
The form factor, F, relates to the shape of the scatterers. Analytical expressions forFare available for many different shapes, such as spheres and ellipsoids. For the purpose of the present work, a spherical form factor for the scatterers is appropriate.
A single sphere of radiusRshows a scattering pattern
F(Q,R)sph =
3(sin(QR)−QRcos(QR)) (QR)3
2
. (12)
The interference pattern of a single sphere of radius R is shown in Fig. 5 as a function of dimensionless QR. The limits of the curve can be approximated for both large and small QR. The region for QR < 1 is described with the Guinier approximation F ∝ exp(Q2R2gyr/3), where Rgyr = √
5/3R is the radius of gyration for a sphere with radius R. This relation is utilized to get a first estimate of the radius of the scatterers by fitting a straight line to the representation log(F) vs. Q2 and considering the slope m = −Rgyr/3. However, this estimate is ambiguous if the scatterers are not monodisperse, but show a distribution of different sizes in the material [39].
For large QR values, in the so-called Porod regime, F shows a dependence ∝ (QR)−4. The exponent of −4 holds true not only for spherical scatterers, but for arbitrary form factors, as long as the interface between matrix and scatterers is flat.
The surface of scatterers is a factor of proportionality in this relation.
14 na n o s t r u c t u r a l c h a r a c t e r i z at i o n t e c h n i q u e s
10−1 100 101
QR 10−5
10−4 10−3 10−2 10−1 100
S(Q,R)ofsphericalscatterer
Guinier regime
∝exp −Q23R2G
Porod regime
∝(QR)−4
F
Figure5:Form factor of a spherical scatterer with radius R=1 nm as a function ofQR. The Guinier region and the Porod region are highlighted.
The preceding considerations on neutron scattering are related to nuclear scatter- ing. Similarly, incident neutrons also interact with the magnetic moment of atoms with unpaired electron spins. This magnetic interaction is independent of the nuclear one and it is characterized by its magnetic scattering length given with
bmag= µγre
2 =µ·2.7 fm , (13)
where µis the magnetic moment of the scatterer,γ= 1.913 the gyromagnetic factor of the neutron in units of the Bohr magneton, µB = 5.788·10−5 eV·T−1, and re = 2.818 fm is the classical electron radius.
According to Eq. (13), the magnetic scattering length of Fe is bmag = 6.0 fm [40].
Under the assumption that the scatterers (index s) are coherent with the Fe matrix (index m) and can be treated as non-magnetic [16] (bs= 0 fm), the magnetic scatter- ing contrast is written as
∆ηmag2 = 4
a6(bs−bm)2 =2.598·10−7nm−4, (14) where the lattice parameter of bcc Fe isa =0.2866 nm.
The existence of both nuclear and magnetic scattering enables to retrieve infor- mation about the chemical composition of scatterers. To separate the contributions of nuclear and magnetic scattering-cross section, the sample under investigation is placed in a saturating magnetic field.
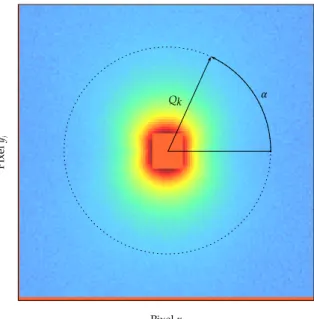
The A ratio is defined [16] as the ratio of scattering-cross section perpendicular (⊥) and parallel (k) to the magnetic field applied to the sample, such that
A = dΣ⊥ dΩ
, dΣq dΩ =
dΣnuc
dΩ +dΣmag dΩ
, dΣnuc
dΩ . (15)
2.2 s m a l l-a n g l e n e u t r o n s c at t e r i n g(s a n s) 15
A specific chemical composition of clusters results in a specific value of the A ratio. The A ratios of clusters embedded in a Fe matrix are, for example, for pure Cu clusters and MnNiSi of equal proportions 13.0 and 1.9, respectively. However, it is not possible to directly calculate the cluster composition from a measured Aratio, as many compositions can have the same A ratio. Rather, the measured A ratios are used to cross check with cluster compositions from model assumptions or other characterization techniques.
In real systems, the total differential scattering-cross section does not only show a Qdependent, coherent scattering contribution but also contains a Qindependent, incoherent contribution:
dΣ
dΩ(Q) = dΣcoh
dΩ (Q) + dΣinc
dΩ . (16)
The incoherent scattering does not carry any structural information on the dis- tribution of scatterers in the system. It stems from both the random distribution of isotopes in the material and from features with sizes below the resolution limit of SANS of about Rmin = 0.5 nm. For the present purpose, the contribution of dΣinc/dΩ is considered to be an offset in the signal, which is to be subtracted prior to further data treatment. The magnitude of the incoherent scattering is estimated by performing a linear fit in the Porod representation (dΣ/dΩ vs. Q4).
Unlike in many biological systems, where scattering structures are often equal in size, the features present in irradiated RPV steels are polydisperse. In our model, this is accounted for by the number-density size distribution, NR, defined as
N=
Z
NR(R)dR. (17)
Inserting Eq. (17) in the expression of the scattering-cross section of a monodis- perse system, Eq. (11) and assuming a dilute system of scatterers (S =1), results in the scattering function of polydisperse spheres
dΣ
dΩ(Q) = ∆η2 Z NR(R)·Vsph2 (R)·Fsph(Q,R)dR (18)
= 12π·∆η2
Z
NR(R)·R6·
sin(QR)−QRcos(QR) (QR)3
2
dR, (19) where Vsph(R)is the volume of a sphere with radius R. The transformation of Eq.
(19) to the size domain is the inverse problem to be solved in SANS data treatment.
Finding the inverse yields several characteristics of the cluster population that we are interested in:
16 na n o s t r u c t u r a l c h a r a c t e r i z at i o n t e c h n i q u e s
Number density: N =
Z NR(R)dR (20)
Volume fraction: fv =
Z fR(R)dR=
Z NR(R)·Vsph(R)dR (21)
Mean radius: ¯R =
R R·NR(R)dR
R NR(R)dR (22)
It is important to note that bothNand fvare calculated under the assumption that the scattering contrast,∆η2, is a known quantity.
2.2.2 Transformation to size domain
The solution to the inverse problem of retrieving the size distribution of clusters from the SANS scattering curve is underdetermined due to the loss of phase information in dΣ/dΩand the limitedQrange observed during a real experiment. There are sev- eral approaches available in the literature for transforming the measured scattering- cross sections to the size domain. However, different algorithms may yield different fits to the experimental values in the Qdomain and consequently in the calculated characteristics of the cluster population.
– The simplest approach is to fix the type of size distribution to an analytical expression. The parameters of an analytical function, such as the position of the center peak and the width are then fitted via a common least-squares algo- rithm. Suitable distributions that have been applied to the characterization of irradiation-induced clusters in RPV steels are e.g. the Gaussian, the log-normal or the gamma distribution [41]. Obviously, the downside of this approach is that the type of distribution has to be known prior to the data analysis to yield reasonable results.
– In the maximum entropy (ME) method, e.g. [42–44], the size distribution is discretized in size classes. This method has been successfully applied for the analysis of irradiated RPV steels. Classical ME algorithms, however, suffer from lack convergence in some cases [45].
– The Indirect Fourier Transformation (IFT) [46–49] involves the modeling of NR(R)with a linear combination of a fixed number,ε, of cubic B-splines. Each spline covers a specific range of R. To avoid oscillating results in the size do- main, the base of each spline is linked with a Lagrange parameter, λp, for dampening.
The IFT is a powerful technique for the determination of the characteristics of the cluster population and has been successfully applied in many cases [8,13, 50,51] for the analysis of irradiated RPV steels. One advantage of the IFT over direct techniques is that the shape of the size distribution is not bound by pre- defined functions. It is, however, important to note that IFT requires the user to set several parameters during the analysis, such asλpandε. Although there
2.2 s m a l l-a n g l e n e u t r o n s c at t e r i n g(s a n s) 17
are guidelines [25] on how to select a proper set of parameters, the choice of parameters ultimately depend on the user’s preferences [52]. This might lead to results which are difficult to reproduce. This is particularly relevant for the case of the integrated cluster properties ¯Rand N.
Furthermore, oscillating solutions in the size domain may lead to partly nega- tive, i.e. unphysical, size distributions.
– In the present work, the transformation of the scattering curves to the size domain was performed by means of a self-written Monte Carlo fitting (MCF) routine. The algorithm is based on a method introduced by Martelli et al.
[53]. Similarly to IFT and ME methods, the MCF algorithm involves no prior selection of the type or shape of the size distribution. Within the present work, the original algorithm was reproduced and extended for correct scaling of NR, a better convergence of the fitting process for small clusters (R < 1 nm) and estimations on the robustness of the parameters of the cluster population. The steps of the MCF algorithm are introduced below.
The aim is to retrieve the size distribution of scatterers NR(R)from the measured scattering-cross section based on the considerations in Eqs. (18) and (20). The MCF algorithm requires the values of the scattering intensity I(Qi)and the number den- sity distribution, NR(Rj) to be in discrete form. The measured scattering intensity Iexp(Qi)is already in the proper shape as it is discretized during the raw-data treat- ment. The size distribution in Eq. (17) is now discretized in a similar manner. We write the simulated scattering curve
Isim(Qi) =κ·∆η2·
Rmax
Rj=
∑
RminNR(Rj)·R6j ·Fsph(Qi,Rj)·∆R, (23) where the constants are grouped in the parameter κ. The cluster radius Rj ranges fromRmintoRmaxin steps of∆R. The boundaries ofRjcan either be set automatically with theQrange acquired experimentally (see Eq. (6)), or chosen manually.
At start, the number-density size distribution is empty, ∑NR = 0. For the first iteration, a value Rj is chosen from a uniformly random pool of radii ranging from Rmin to Rmax. The chosen Rj value is added to NR. An intermediate scattering intensity Itmp(Qi)is calculated according to Eq. (23). As we are in the first iteration, the resulting scattering intensity has a Q dependence equal to the form factor of a single sphere, Fsph, plotted in Fig. 5. The intermediate scattering intensity, Itmp, is then fitted to the experimental scattering curve, Iexp, by varying the scaling of N by means of a least-squares minimization:
χ2min =min
∑
i
Iexp(Qi)−Itmp(N,Qi) w(Qi)
2!
, (24)
where the weights, w(Qi), of each data point are calculated from the inverse of the experimental uncertainty, Ierr. The value forχ2min(1) of the first iteration is saved for later comparison.
18 na n o s t r u c t u r a l c h a r a c t e r i z at i o n t e c h n i q u e s
The next iteration adds another randomly chosenRjto the size distributionNRand a new scattering intensity Itmpis calculated and minimized according to Eq. (24). If the newItmpresults in a lowerχ2than the one from the oldIsim, i.e.χ2min(2)< χ2min(1), the added radiusRj is kept inNRand Itmpbecomes the new Isim. Otherwise,Itmpis rejected, and a new Rj trial is initiated.
At first, the initial procedure is performed for 100 randomly chosen Rj values.
It is then checked if the minimization routine is trapped in a local minimum, i.e.
no further Rjs are accepted. In this case, all variables are reset, and the algorithm is restarted with a new random seed. If the initial procedure is not trapped in a local minimum, more Rjs are added until convergence is reached. For the present cases, this involves about 2·106 trials of randomly chosen Rjs and corresponding minimizations.
The whole procedure is performed for at least ten times with a different pool of uniformly distributed random numbers Rj. For each run, the number-weighted and volume-weighted cluster size distributions are calculated and the integrated parameters, N, fv and ¯Rare determined in accordance with Eqs. (20) to (22).
Finally, the arithmetic mean and uncertainty of the parameters are calculated. The estimated uncertainties of the parameters correspond to the 3σ standard deviation of the results from each run.
Clearly, the calculated uncertainties are not the real experimental uncertainties.
These would also include systematic errors from calibration and material hetero- geneities. Due to the random starting conditions of each MCF run, the uncertainty rather corresponds to an estimate on how stable the used model, i.e. dilute, poly- disperse spherical scatterers with radii between Rmin and Rmax, is reproduced by the fit. This kind of error estimate is more conclusive than the standard uncertainty estimations based the covariance matrix of the least-squares fit.
The advantages of the established MCF procedure are summarized below:
– The calculated size distributions, NR and fR, are always ≥ 0, i.e. yield phys- ically meaningful results. This is given by how the algorithm operates [53].
In contrast, the IFT algorithm can lead to partly negative, non-physical size distributions.
– There are no fitting parameters to be set by the user. The parameters thatcanbe altered (Rmin,Rmax,∆R) may be left fixed for most cases. In fact, the scattering curves of the materials investigated in the present work were all transformed to the size domain with the same set of fitting parameters. This advantage was also put to use for the SANS analyses of different classes of materials, such as oxid-dispersion strengthened steels [54].
– The uncertainties of the integrated properties of the cluster distribution (N, fv
and ¯R) give a meaningful estimate of the stability and reproducibility of the fit.
For the present case of irradiated RPV steels, this is particularly important for the development of models of cluster evolution, as outliers are recognized and treated accordingly by the error-weighted fitting procedure.
2.2 s m a l l-a n g l e n e u t r o n s c at t e r i n g(s a n s) 19
– One particular challenge of the analyses of the RPV materials investigated in the present work is the extremely small size of the clusters, which, for some materials are on the edge of the observable radii. According to simulated size distributions [55] and the analyses performed in the present work, the results from the MCF algorithm are more stable for the smallest clusters in the vicin- ity of the SANS resolution limit (R ≈ 0.5 . . . 0.8 nm) than typically applied methods [48].
2.3 at o m-p r o b e t o m o g r a p h y (a p t) 21
2.3 at o m-p r o b e t o m o g r a p h y (a p t)
2.3.1 Principles of APT
Atom-probe tomography is a nanostructural analysis technique that delivers a three- dimensional distribution of chemical elements within sample volume with near- atomic resolution. A comprehensive introduction to the technique can be found in the books of Miller [27] and Gault [28].
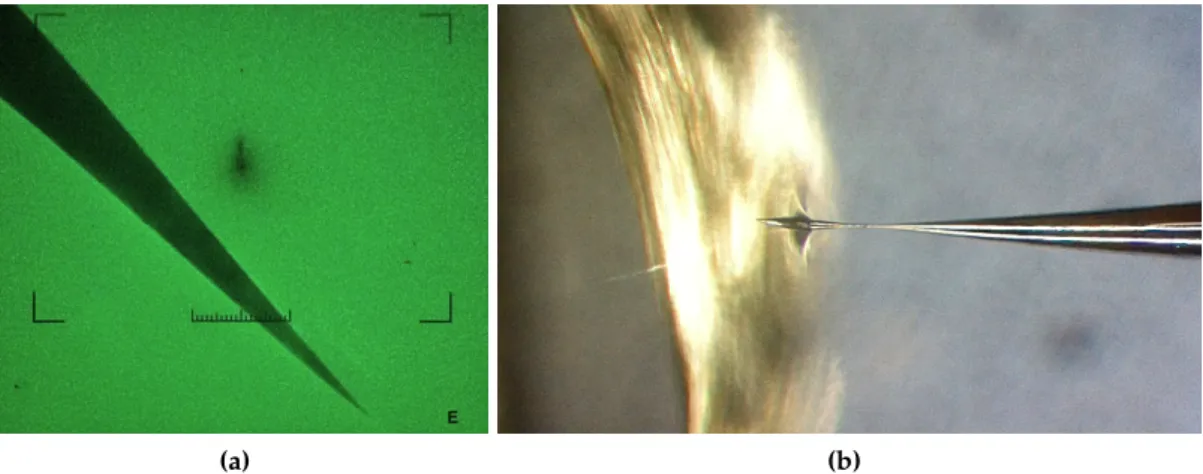
APT is a destructive technique that uses field evaporation to successively remove ions from the tip of a needle-shaped specimen. The experimental set-up of an APT device is schematically depicted in Fig. 6. The working principle is the following:
Ions released from the surface of the sample tip are accelerated in an electric field.
A time-of-flight (TOF) mass spectrometer is used to determine the mass-to-charge ratio of the ions. The impact positions of the ions are recorded on a two-dimensional detector. By timing each ion-evaporation event and combining the mass spectrometer with a position-sensitive ion detector, it is possible to reconstruct a three-dimensional map of the chemical composition of the sample at near-atomic scale.
Microchannel plates Stage
(x, y, z, θ, φ) Specimen
Laser pulses Local electrode
Time of flight t High voltage
pulses
Delayline detector (x1, x2)
(y1, y2) U~ 20 kV
T ~ 40 K
Figure6:Basic set-up of an APT device. Ions are field evaporated from the tip surface. The time-of- flight and the impact position of the ions are recorded on the two-dimensional detector.
The sample is kept in an ultrahigh vacuum chamber at a pressure of about 10−10mbar and a temperature of about 40 K. A positive standing voltage U0 ≈ 20 kV is applied to the specimen, which is just below the ionization threshold. To make
22 na n o s t r u c t u r a l c h a r a c t e r i z at i o n t e c h n i q u e s
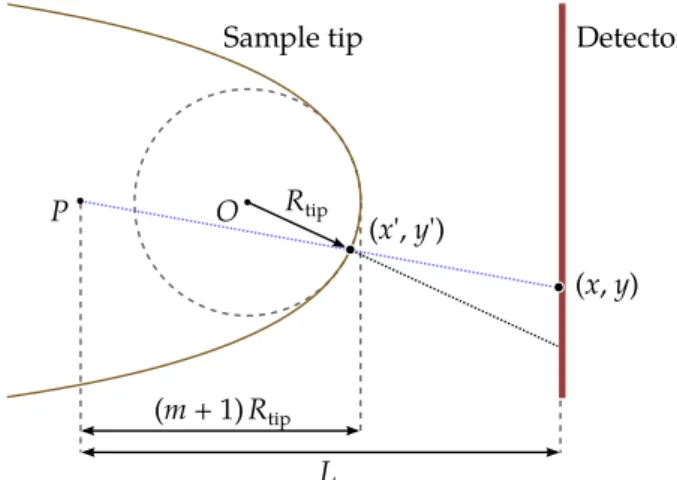
field evaporation possible at reasonable voltages, the radius of the sample tip, Rtip, needs to be<70 nm. The electric field at the apex of the sample tip is given with
E= U0
βRtip, (25)
where β is a geometry factor, which depends on the shape of the tip and its elec- trostatic environment. For a perfect sphere, β would be equal to 1, for a real tip shape, the value is between 2 and 8 [27]. An additional high-frequency pulsed volt- ageU∼ ≈0.2·U0is applied to the specimen, to trigger field evaporation at a known point in time, t0. This value is recorded and used as the start time for the TOF measurement of the ion hitting the detector at a distance L.
The electric field penetrates only fractions of atomic radii into the material. There- fore, only atoms at the surface of the tip are ionized and escape the material matrix.
As the atoms have to be evaporated in a controlled way, the actual evaporation rate, k(t), is time dependent and only increased for short timed pulses in the order of several ps. The Arrhenius-type equation of the evaporation rate is given by
k(t) =ν·exp
−Qact(E(t)) kbT(t)
, (26)
whereQactis the activation energy for field evaporation,Tandνare the temperature and the vibration frequency of the atoms at the tip surface, respectively. Consider- ing ν as constant, Eq. (26) states that a pulsed increase of the evaporation rate can either be achieved by an increase of the electric fieldE(t)or of the temperatureT(t). This means that there are in fact two ways to evaporate ions in a pulsed way: Either by electric mode, i.e. applying an additional pulsed voltage to the tip, or by laser mode, i.e. illuminating the tip surface with a pulsed laser and increasing the tem- perature. Both methods were applied in the present work for all conditions, i. e.the non-irradiated, the medium-fluence and the high-fluence samples. Fig.6shows both methods, voltage pulses and laser pulses, at the same time for illustration purposes.
The impacting ions are registered at the detector. The difference between start time,t0, which coincides with the pulse and stop time,thit, at detector hit is the time of flight,t, for each event. With this, the mass-over-charge ratio
m
n =2e U0+Up
· t
L 2
(27) is calculated for each detector event. The ion charge state n ∈ (1+, 2+, . . .) has to be selected manually later in data treatment, whereas the standing voltage,U0, and pulsed voltage, U∼, are known quantities, as is the flight length, L, after calibration.
In data treatment, the recorded data is then represented as a mass-over-charge his- togram. For steels, the mass resolution is typically given at the 10 % widthM/∆M10%
of the main56Fe++peak. The mass resolution of both electric and laser atom probe is