www.giga-hamburg.de/workingpapers
orking Papers serve to disseminate the research results of work in progress prior to publicaton to encourage the exchange of ideas and academic debate. orking Papers series does not constitute publication and should not limit publication in any other venue. Copyright remains with the authors.
GIGA Research Unit:
Institute of Asian Studies
___________________________
The Puzzling Decline in Rural Women’s Labor Force Participation in India: A Reexamination
Daniel Neff, Kunal Sen and Veronika Kling
No 196 May 2012
GIGA Working Papers
Edited by the
GIGA German Institute of Global and Area Studies Leibniz‐Institut für Globale und Regionale Studien
The GIGA Working Papers series serves to disseminate the research results of work in progress prior to publication in order to encourage the exchange of ideas and academic debate. An objective of the series is to get the findings out quickly, even if the presenta‐
tions are less than fully polished. Inclusion of a paper in the GIGA Working Papers series does not constitute publication and should not limit publication in any other venue. Copy‐
right remains with the authors. When working papers are eventually accepted by or pub‐
lished in a journal or book, the correct citation reference and, if possible, the corresponding link will then be included on the GIGA Working Papers website at
<www.giga‐hamburg.de/workingpapers>.
GIGA research unit responsible for this issue: Institute of Asian Studies Copyright for this issue: © Daniel Neff, Kunal Sen and Veronika Kling WP Coordination and English‐language Copy Editing: Melissa Nelson Editorial Assistance and Production: Silvia Bücke
All GIGA Working Papers are available online and free of charge on the website
<www.giga‐hamburg.de/workingpapers>.
For any requests please contact:
E‐mail: <workingpapers@giga‐hamburg.de>
The GIGA German Institute of Global and Area Studies cannot be held responsible for errors or any consequences arising from the use of information contained in this Working Paper; the views and opinions expressed are solely those of the author or authors and do not necessarily reflect those of the Institute.
GIGA German Institute of Global and Area Studies Leibniz‐Institut für Globale und Regionale Studien Neuer Jungfernstieg 21
20354 Hamburg Germany
E‐mail: <info@giga‐hamburg.de>
Website: <www.giga‐hamburg.de>
The Puzzling Decline in
Rural Women’s Labor Force Participation in India:
A Reexamination
Abstract
Between 2004/2005 and 2009/2010 there was a sharp fall in female labor force participation (LFP) in rural India. Why did this occur? We look at the four standard explanations: that more women in rural areas are now pursuing higher education and are therefore not available for work (education effect), that household incomes are rising quickly enough that there is a tendency for women to withdraw from the labor force to attend to domestic duties (income effect), that employment opportunities for women are decreasing, and that social and cultural factors may be interacting with these three factors and amplifying their effects. Our findings suggest that the decline in rural women’s LFP could potentially be due to an income effect and partly due to an education effect. We find no evidence of changes in employment opportunities or of social and cultural interaction effects that could explain the decline in rural female LFP.
Keywords: labor force, women, rural, India JEL classification: J00, J20, J21
Daniel Neff
is a research fellow at the GIGA German Institute of Global and Area Studies, Institute of Asian Studies, Hamburg, Germany.
Contact: <neff@giga‐hamburg.de>
Website: <http://staff.en.giga‐hamburg.de/neff>
Kunal Sen
is a professor of development economics and policy at the Institute for Development Poli‐
cy and Management at the University of Manchester, UK.
Contact: <kunal.sen@manchester.ac.uk>
Website: <http://staffprofiles.humanities.manchester.ac.uk/Profile.aspx?Id=Kunal.Sen>
Veronika Kling
is a master’s student in international economics at the University of Göttingen, Germany.
Contact: <klingveroni@gmail.com>
Rural Women’s Labor Force Participation in India:
A Reexamination
Daniel Neff, Kunal Sen and Veronika Kling
Article Outline 1 Introduction
2 The Education Effect: Rural Female Labor Force Participation and Education 3 The Income Effect: Rural Female Labor Force Participation and Income
4 Labor Demand: Rural Female Labor Force Participation and Employment Opportunities 5 The Cultural/Social Effect: Rural Female Labor Force Participation and Cultural/Social
Barriers
6 Summary and Conclusion Bibliography
1 Introduction
The recently released report containing the key results of the National Sample Survey (NSS) 66th Round Employment and Unemployment Survey (EUS) (NSSO 2011, see also Chowd‐
hury 2011) has triggered a debate about the labor force participation rate (LFPR) of rural women in India. The published figures suggest that the LFPR of women in rural areas fell steeply, by approximately 20 million,1 between 2004/2005 and 2009/2010 (Rangarajan et al.
1 Kannan and Raveendran (2012) adjusted the NSS to account for the underestimation of the population and estimate that the rural female labor force declined by 38.83 million. We have refrained from using population‐
adjusted estimates for this paper since we believe that our results still hold.
2011). Table 1 displays the trends in the LFPRs since 1993/1994 by usual principal and subsid‐
iary status (UPSS).2 As can be seen, the all‐India LFPR decreased between 1993 and 2000, then increased again in the period between 2000 and 2005, and finally dropped again be‐
tween 2005 and 2010. The current LFPR of 59.6 percent is the lowest since 1993/1994. The general drop in the LFPR is mainly due to the decline in the female LFPR, which has de‐
creased by 10.9 percentage points since 2004/2005. This decline in the female LFPR is, in turn, mainly explained by the steep fall of the rural LFPR by 12.6 percentage points since 2004/2005. In contrast, the LFPR of urban women has declined by a much smaller rate of 5.1 percentage points, that of rural men by 3.8, and that of urban men by 2.5 percentage points since 2004/2005. Interestingly, the female LFPR shows a greater fluctuation than that of men.
As Mazumdar and Neetha (2011: 118) argue, “the need to understand the gender dimensions of employment trends in India has acquired a new urgency.” The question we hence aim to address with this paper is as follows: What are the potential explanations for this decline in the women’s LFPR in rural areas? We try to answer this question by exploring the NSS 61st
and 66th round EUS data. It has to be borne in mind that in order to derive more conclusive
findings, a longer‐term multivariate analysis of the trends or fluctuations in female LFPR would be required, something which is beyond the scope of this paper. The aim of this paper is to highlight the findings of a simple descriptive bivariate analysis. These findings provide us with some insights regarding the present discussion of the trends in the female LFPR. The findings should not be regarded as conclusive, but rather as indicative.
Table 1: Labor Force Participation Rates, 1993–2010 (in percent, ages 15–59)*
1993/1994 1999/2000 2004/2005 2009/2010
All India 67.1 64.5 66.6 59.6
Females 45.2 41.6 45.4 34.5
Males 88 86.6 87.1 83.7
Rural India 71.2 68.7 70.6 62.6
Females 52 48.7 52.5 39.9
Males 89.8 88.3 88.6 84.8
Urban India 55.8 53.8 56.2 52.3
Females 25.2 22.2 26.1 21.0
Males 83.2 82.2 83.4 80.9
Sources: NSS Employment and Unemployment Reports for 1993/1994, 1999/2000 and 2004/2005; 2009/2010 figures are based on the authors’ own calculations.
* Labor force participation refers to the 15–59 age group according to the usual principal and subsidiary status (UPSS). Only the quinquennial rounds are taken into account. Quinquennial rounds before 1993/1994 are not considered because of comparability problems (see Srinivasan 2010).
2 A person can either be employed or working, unemployed or not working, or not working and not available for work. Only the latter person is then classified as not being part of the labor force. The reference period is a year, week, or day. For an in‐depth explanation of the classification procedure see Srinivasan (2010).
Four potential explanations for the decline in rural women’s LFPR can be found in the cur‐
rent Indian debate: Firstly, that women in rural areas are now pursuing higher education and are therefore simply not available for the labor force (Chowdhury 2011; Rangarajan et al.
2011). Secondly, that household incomes could have risen in rural areas due to higher wage levels, which would thus take the pressure off of women to seek employment in times of economic hardship (World Bank 2010; Himanshu 2011; Rangarajan et al. 2011). Thirdly, that the decline in women’s LFPR is due to an overall decline in or absence of short‐ and long‐
term employment opportunities in rural areas (World Bank 2010; Chowdhury 2011; Ma‐
zumdar and Neetha 2011). Finally, that the decline in the rural female LFPR could be due to cultural factors and social constraints which might be coming to the fore due to rising in‐
comes or limited employment opportunities (see Das 2006; Olsen and Mehta 2006; Chowd‐
hury 2011). The aim of this paper is to reexamine the explanations put forward in the litera‐
ture through a systematic descriptive analysis of the 61st and recent 66th round NSS EUS data.
Each of the four explanations is discussed in turn.
2 The Education Effect: Rural Female Labor Force Participation and Education
Education has been proposed as one of the explanations for the decline in the rural female LFPR. It is assumed that more women in rural areas are now pursuing higher education and are therefore not available for work (see Himanshu 2011, Rangarajan et al. 2011). Chowdhury (2011), however, questions this explanation and puts forward the arguments that the overall employment situation for women has not improved and that rural female LFP has declined for all women above the age of 15, not just for those in the 15–24 age group. In fact, the rural female LFPR declined across all age groups between 2004/2005 and 2009/2010 (see Table 2).
The highest percentage point change of ‐15.9 can be found among the women aged 30–34.
Table 2: Changes in Rural Female Labor Force Participation by Age Group, 2004–2010
Age Group LFPR
2004/2005 LFPR 2009/2010 Percentage Point Change
15–19 33.1 19.5 ‐13.6
20–24 43.5 31.4 ‐12.1
25–29 53.0 40.4 ‐12.6
30–34 59.3 43.4 ‐15.9
35–39 64.2 49.7 ‐14.5
40–44 62.7 49.8 ‐12.9
45–49 61.6 49.2 ‐12.4
50–54 56.2 48.5 ‐7.7
55–59 50.9 41.1 ‐9.8
Total 52.5 39.9 ‐12.6
Source: LFP rates for 2004/2005 from NSS Report No. 515, NSS EUS 66th round. Authors’ own calculations.
Looking at Table 3, we can make three observations: Firstly, the lowest LFPR among rural women is found among those below the age of 24. It can be observed that 12 percent of those rural women who are not part of the labor force are in the 15–19 age group and 9.9 percent are in the 20–24 age group. Hence, 21.9 percent of all rural women of working age who are not in the labor force are between 15 and 24 years of age. Secondly, labor force participation increases with age, to approximately 40 percent in the group of 25‐ to 29‐year‐olds, and to nearly 50 percent in the group of 40‐ to 44‐year‐olds. Thirdly, it can be observed that the group of 15‐ to 24‐year‐olds accounts for 29.3 percent of the total rural female working‐age population between 15 and 59. These figures suggest that an increase in the number of wom‐
en pursuing higher education has a stronger impact on the total LFPR because those women who are attending an educational institute are primarily within the largest age group (15–24) in terms of population.
Table 3: Female LFP by Age Group, 2009/2010
Age Group
In the LF (%) Not in the LF (%)
Share of Working‐Age Population (%)
Cumulative Share of Working‐Age Population (%)
15–19 2.9 12.0 14.9 14.9
20–24 4.5 9.9 14.4 29.3
25–29 5.6 8.3 13.9 43.2
30–34 5.6 7.3 13.0 56.2
35–39 6.3 6.4 12.7 68.9
40–44 5.0 5.0 10.0 78.9
45–49 4.3 4.4 8.7 87.6
50–54 3.2 3.4 6.6 94.2
55–59 2.4 3.4 5.8 100.0
Total 39.9 60.1 100.0
Source: NSS EUS 66th round. Authors’ own calculations.
The percentage of rural women in the 15–24 age group increased by nearly 10 percentage points between 2004 and 2010 (see Table 4). This seems to support the hypothesis that the de‐
cline in rural women’s LFPR is due to an increase in the number of women pursuing higher education. However, a similar increase of 9 percentage points can be observed among the urban women in the same age group, without an accompanying strong decline in female LFPRs in urban areas.
Table 4: Women Aged 15–24 Receiving Education, 2004–2010
Rural Females Urban Females 2004/2005 2009/2010 2004/2005 2009/2010
Education Attendance % % % %
Yes 36.57 45.89 18.74 28.46
No 63.43 54.11 81.26 71.54
Total 100 100 100 100
Source: NSS EUS 61st and 66th round. Authors’ own calculations.
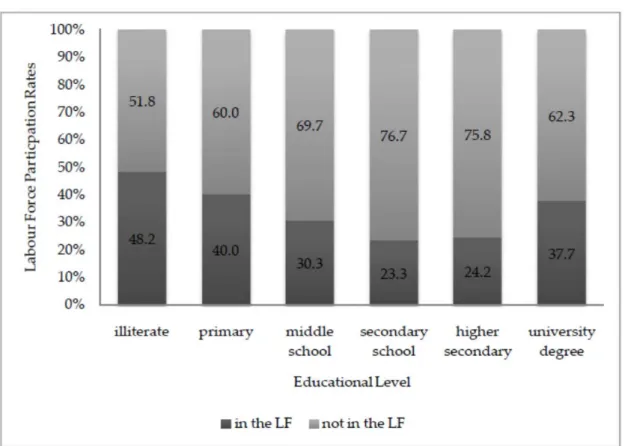
Moreover, even if the larger number of women pursuing higher education is responsible for the currently observed decline in the rural female LFPR, this does not mean that the LFPR of rural women will increase in the future because they are better educated. In India, there is a clear U‐shaped relationship between educational level and LFPR. As Figure 1 illustrates, women who are illiterate have a higher probability of being in the labor force. With rising education level, the labor force participation of rural women declines; it only rises signifi‐
cantly again with a university degree. Hence, the assumption would be that with rising edu‐
cational levels rural women are more likely not to be in the labor force and also have a higher likelihood of remaining outside the labor force. This trend might only be reversed for those with a university degree.
Figure 1: Labor Force Participation of Rural Women by Educational Level
Source: NSS EUS 66th round. Authors’ own calculations.
Taken together, these findings appear to only partly support the hypothesis that rural female labor force participation has declined because of the rising numbers of rural women pursu‐
ing higher education. Even though rural female LFP is declining across all age groups, as Chowdhury (2011) suggests, the relative size of the 15–19 and 20–24 age groups (29 percent of the total rural female labor force) and the increase in the number of rural women in the 15–24 age group attending education since 2004/2005 indicate the existence of an education effect. However, there has been a similar increase in the number of urban women receiving education without an accompanying decline in the LFPR. Moreover, it has been argued that the effect of education can be twofold. The increased number of rural females pursuing higher education might lead not only to a temporary decline in their LFP but could also lead to un‐
deremployment and perhaps also a permanent decline in their LFP rates in the long term.
There is evidence that education does not pay off for all social groups. Jeffrey at al. (2004), for example, show that in Uttar Pradesh young Dalit and Muslim men are not able to convert their education into secure employment; this leads parents to withdraw their support for their male children’s higher secondary and tertiary education. Breman (2007) found in his village studies in South Gujarat that those men of the lower castes who acquired a higher de‐
gree were disadvantaged within the labor market because of their caste and were often forced to return to their villages and work as casual laborers. We assume that women – espe‐
cially those from lower caste groups and religious minorities – face similar disadvantages. To conclude, therefore, the education effect alone does not seem to sufficiently explain the de‐
cline in the female LFPR. Other factors must be at work. Another prominent explanation is the “income effect” (see Abraham 2009; Srivastava and Srivastava 2010; Himanshu 2011).
3 The Income Effect: Rural Female Labor Force Participation and Income
A number of authors have pointed to the existence of an income effect that impacts women’s LFP. Olsen and Mehta (2006), for example, find that economic poverty makes female labor force participation more likely. Similarly, Srivastava and Srivastava (2010, see also Himanshu 2011: 47) argue that the female LFPR increases in times of distress – that is, when there is a
“perceived fall in the reservation income of the household.” The employment growth in the periods 1999/2000 and 2004/2005, for example, is believed to have been distress employment driven by a deep agrarian crisis (Abraham 2009). However, as Himanshu (2011) puts for‐
ward, 2009 was also a drought year, the worst in 30 years, yet the LFP of rural women did not increase but rather decreased. Rangarajan et al. (2011: 70) propose that this could be be‐
cause agriculture has become drought resilient, because the Mahatma Gandhi National Rural Employment Guarantee Scheme (MGNREGS)3 has managed to provide supplementary jobs,
3 The MGNREGS guarantees a hundred days of paid manual work for each rural household. The average daily wage paid through the scheme is in most cases higher than the average daily wages paid in the respective regions.
or because wages have gone up. The income effect can thus also work the other way: with higher incomes, which help households escape poverty, there could be a tendency for women to withdraw from the labor force to attend to domestic duties (Rangarajan et al. 2011). This could be a pure income effect, where women opt out of the labor force, but it could also be the result of social norms coming to the fore again with rising incomes, and women thus be‐
ing pushed out of the labor force (see Section 5). In the following discussion we first explore the potential relationship between income and rural female LFP and secondly try to analyze the extent to which an income effect could explain the decline in rural female LFPR.
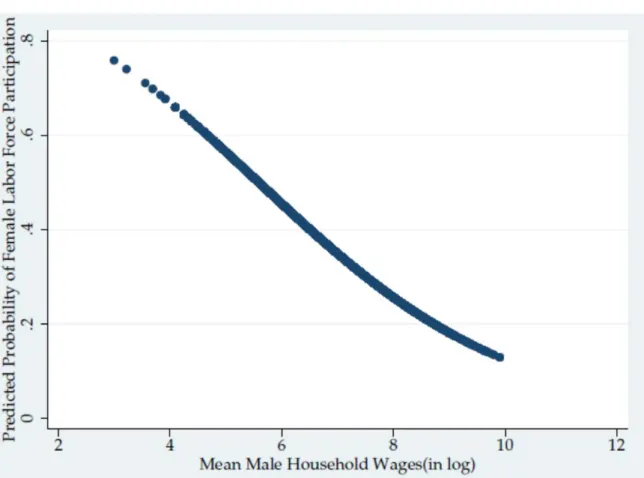
Figure 2 displays the probability of labor force participation among rural women by the mean household wages of male household members.4 It clearly shows that with higher mean male household wage levels, the probability that the female/s in the household will be part of the labor force diminishes.5
Figure 2: Probability of Rural Remale LFP by Mean Male Household Wages, 2009/2010
Source: NSS 66th round. Authors’ own calculations.
4 Note: Figure 3 contains information only about households where wage data for males were available. Fe‐
males who live in households without a male member or without wage data for a male member – for example, households which exclusively pursue self‐employed activities – are not part of this figure.
5 In the logit estimate the coefficient of log male wage is ‐0.441 and it is statistically significant at the 1 percent level.
A U‐shaped probability curve between rural women’s paid LFP and log household con‐
sumption expenditure can be seen in Figure 3.6 The probability that women will pursue paid work is higher for households with lower per capita household consumption expenditure, then declines at mid‐range per capita household consumption levels and rises again for households with high per capita household consumption levels. This supports the hypothesis of distress employment – that is, that women are forced to work in times of economic dis‐
tress in the household. Once the household has reached and can sustain a certain level of consumption, rural women are not forced to work. However, after a certain threshold the probability that rural women will pursue work increases again with rising per capita house‐
hold expenditure.
Figure 3: Predicted Participation in Paid Work for Rural Women Based on Household Monthly per Capita Expenditure, 2009/2010
Source: NSS 66th round. Authors’ own calculations.
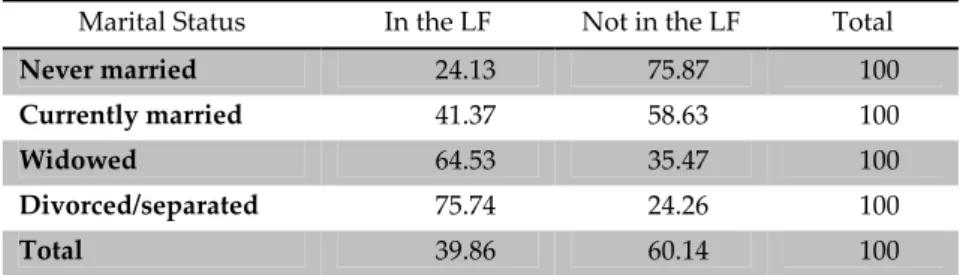
Another indicator of the existence of an income effect can be seen in Table 5. The majority of never married (75.87 percent) and currently married women (58.63 percent) of working age are not part of the labor force, whereas those who are widowed (64.53 percent) or divorced/
separated (75.74 percent) are likely to be part of the labor force.7 In India widows, divorcees
6 In the logit estimate both the coefficient of the logarithm of monthly per capita expenditure (‐1.77) and its square (.1157253) are significant at the 1 percent level.
7 The difference in labor force participation rates by marital status (chi2= 16700) is significant at the 1 percent level.
and women who have left their husbands are often not financially supported by either their own family or their husband’s family and are thus forced to secure their livelihood through work. Drèze and Srinivasan (1997), for example, show that single widows living with unmar‐
ried children and female household heads were more likely to live in poverty when com‐
pared to the society as a whole, in all of India. Widows or divorcees might, however, face fewer cultural or social barriers that prevent them from working outside the home and are sometimes more free to migrate seasonally since there is no husband or family to prevent them from doing so.
Table 5: Labor Force Participation among Rural Women (aged 15–59) by Marital Status, 2009/2010
Marital Status In the LF Not in the LF Total
Never married 24.13 75.87 100
Currently married 41.37 58.63 100
Widowed 64.53 35.47 100
Divorced/separated 75.74 24.26 100
Total 39.86 60.14 100
Source: NSS 66th round. Authors’ own calculations.
So far we have looked at potential indications of a relationship between income and the rural female LFPR. But to what extent can the decline in rural women’s LFPR be explained by an income effect – that is, have rising income levels led to a decline in the female LFPR? One way to potentially shed some light on this question is to analyze the wage‐level trends over time. In the following discussion we aim to first explore whether male wage levels have in‐
creased over time and whether this is related to the decline in the rural women’s LFPR be‐
tween 2004 and 2010. Furthermore, we explore whether the opportunity costs for women of entering the labor force have remained high by exploring the mean wage‐level changes for male and female casual workers since 2004/2005.
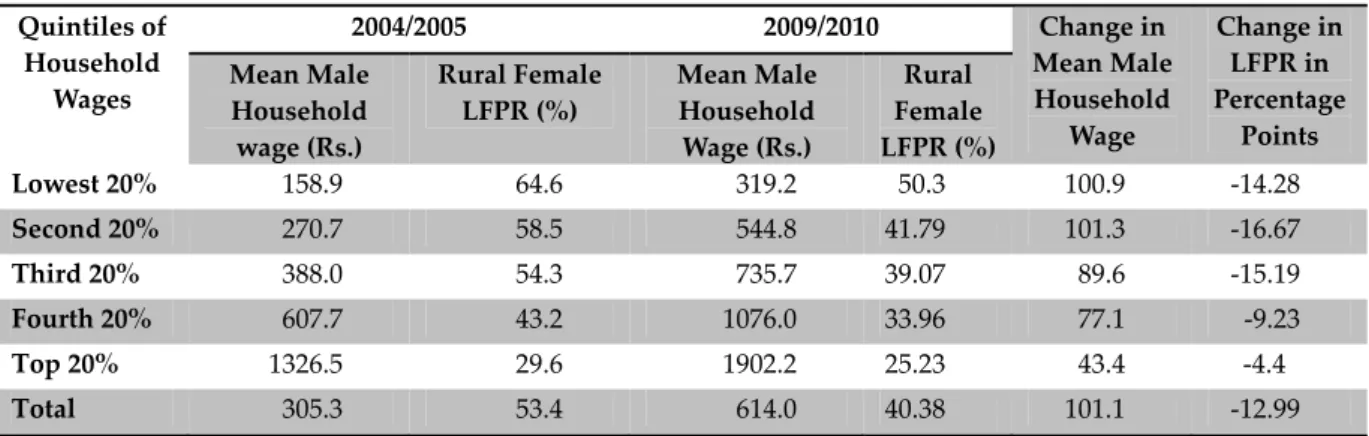
The mean wage levels of the male household members across all wage quintile groups did increase (see Table 6). The largest increase can be observed for the two lowest quintile groups, where mean male household wages increased over 100 percent between 2004/2005 and 2009/2010. In the third wage quintile the increase in mean wages was approximately 90 percent, and in the top quintile it was approximately 43 percent. Rural women’s LFPR changes between 2004 and 2010 seem to correspond quite well with the increases in mean male household wages. The greater the increase in male household wages in the quintile groups, the greater the decline in the female LFPR. This seems to support the hypothesis that in‐
creases in income led to a decline in the rural women’s LFPR between 2004 and 2010.
Table 6: Mean Male Household Wage and Rural Female LFPR Changes, 2004–2010
Quintiles of Household
Wages
2004/2005 2009/2010 Change in
Mean Male Household
Wage
Change in LFPR in Percentage
Points Mean Male
Household wage (Rs.)
Rural Female LFPR (%)
Mean Male Household Wage (Rs.)
Rural Female LFPR (%)
Lowest 20% 158.9 64.6 319.2 50.3 100.9 ‐14.28
Second 20% 270.7 58.5 544.8 41.79 101.3 ‐16.67
Third 20% 388.0 54.3 735.7 39.07 89.6 ‐15.19
Fourth 20% 607.7 43.2 1076.0 33.96 77.1 ‐9.23
Top 20% 1326.5 29.6 1902.2 25.23 43.4 ‐4.4
Total 305.3 53.4 614.0 40.38 101.1 ‐12.99
Source: NSS 61st and 66th round. Own calculations. Wages are measured in Indian Rupees (Rs.).
What is more, there is evidence that wage levels for women rose over this period. The wages of female casual workers increased by 117 percent whereas those of men increased by 101 percent (see Table 7). This unequal rise slightly narrowed the gender wage gap for casual workers. The mean wage of female casual workers was 64 percent of that of men in 2009/2010; in 2004/2005 it was just 59 percent. Hence the wage gap decreased by approximately 5 percentage points.
Table 7: Mean Casual Worker Wages by Gender, 2004–2010
Mean Wage
2004/2005 (Rs.)
Mean Wage 2009/2010
(Rs.)
Difference (%)
Female casual worker 179.34 389.76 117.3
Male casual worker 305.31 614.03 101.1
Wage ratio (female to male) 0.59 0.64 0.05
Source: Weekly wages of casual workers from NSS 61st and 66th round (current weekly status).
Authors’ own calculations.
How has the activity status of rural women changed since 2004/2005? In 2004/2005 approxi‐
mately 47.3 percent of rural working women (aged 15–59) were unpaid family workers (see Table 8). In 2009/2010 this rate had dropped by 8.2 percentage points to 39.1 percent. At the same time, the relative share of casual workers increased by 7.3 percentage points; hence, one could argue that the share of unpaid family workers had mainly moved towards casual work. In total, 61.8 percent of the working women were remunerated. Nevertheless, due to the total rural female LFP decline, in 2009/2010 only 24 percent of all working‐age rural women had a rem.
As highlighted in this section, the descriptive and bivariate analysis seems to support the hypothesis regarding the existence of an income effect that could explain the decline in the rural female LFPR. Firstly, we find that the probability of rural women’s LFP drops the higher the men’s wages are. Secondly, the probability that rural females will participate in the labor force initially declines with higher household expenditure and then rises again in a U‐shaped
way. Thirdly, widows, divorcees and women living alone are significantly more likely to be in the labor force.
Table 8: Type of Work Performed by Rural Women (aged 15–59) according to their Usual Activity Status, 2004–2010 (in percent)
Type of Work (UPSS) 2004/2005 2009/2010 Change
Paid self‐employed 15.7 15.8 0.1
Unpaid family worker 47.3 39.1 ‐8.2
Regular employee 3.9 4.7 0.8
Casual worker 33.2 40.5 7.3
Total 100 100
Source: NSS 61st and 66th round. Authors’ own calculations.
Moreover, we find that the mean male wage levels in the two lowest wage quintiles saw the largest increase between 2004 and 2010, and that the decline in the rural female LFPR was highest for these two wage quintile groups. The mean wages of male and female casual workers appear to have risen, whereas the gender wage gap has only slightly decreased, im‐
plying that the opportunity costs for rural women have not decreased much. To summarize, although they rely on a simple analysis, our findings can be seen to support the assumption that the income effect provides a plausible explanation for the decline in the rural women’s LFPR since 2004. This income effect could, however, be mediated by other factors, such as la‐
bor market opportunities.
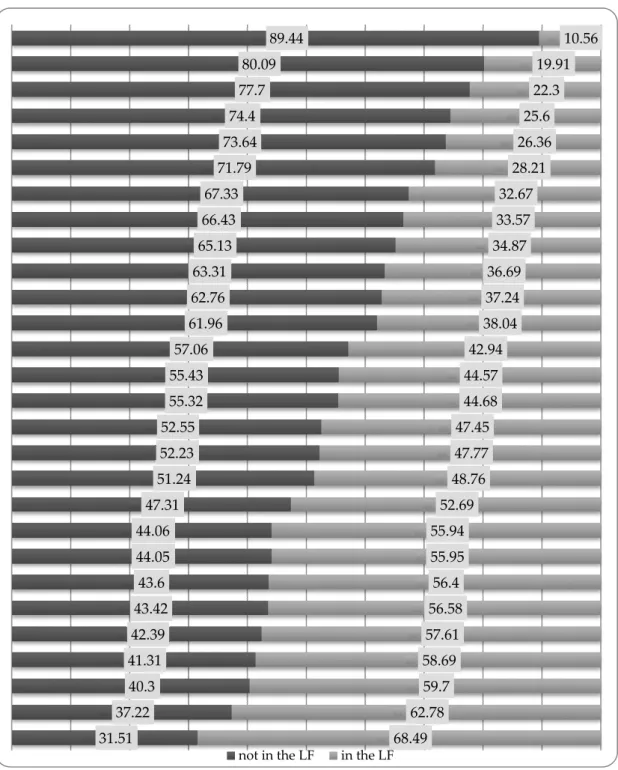
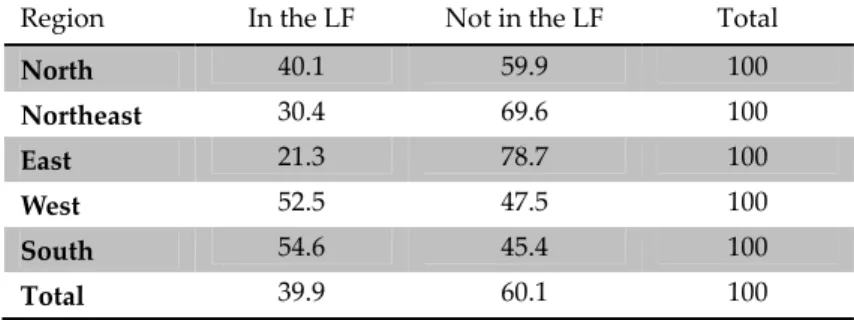
4 Labor Demand: Rural Female Labor Force Participation and Employment Opportunities Labor market outcomes for rural women differ significantly across India’s states. The lowest LFP among rural women can be found in Bihar (see Figure 4), where only about 11 percent of rural women participate in the labor force. This state is followed, surprisingly, by Goa (20 percent) and West Bengal (22 percent). In contrast, Andhra Pradesh and Himachal Pra‐
desh have the highest rural female LFP, with 63 percent and 68 percent, respectively. Accord‐
ing to the World Bank (2010), most of the differences in LFP among states are due to the dif‐
ferences in female employment rates. What explains these regional differences? One com‐
mon explanation is that there are varying employment opportunities for women across states (labor demand).
Figure 4: Rural Female LFP by State, 2009/20108
Source: NSS 66th round. Authors’ own calculations.
In the 1990s an average of 5.5 million jobs were created per annum (WB 2010), but in the period between 2004/2005 and 2009/2010 only about 1 million new jobs were created per year (Rangara‐
jan et al. 2011). This implies that there could be an acute shortage of employment opportunities given that the working‐age population is estimated to increase by 12 million people a year over the next decade, of whom between 8 to 9 million persons will be looking for jobs (WB 2010).
8 The difference in labor force participation by state is significant at the 1 percent level (chi2 = 49500).
31.51 37.22
40.3 41.31
42.39 43.42
43.6 44.05 44.06 47.31
51.24 52.23 52.55 55.32 55.43 57.06
61.96 62.76 63.31 65.13
66.43 67.33
71.79 73.64
74.4 77.7
80.09 89.44
68.49 62.78
59.7 58.69
57.61 56.58
56.4 55.95 55.94 52.69
48.76 47.77 47.45 44.68 44.57 42.94
38.04 37.24 36.69 34.87
33.57 32.67
28.21 26.36
25.6 22.3
19.91 10.56
not in the LF in the LF
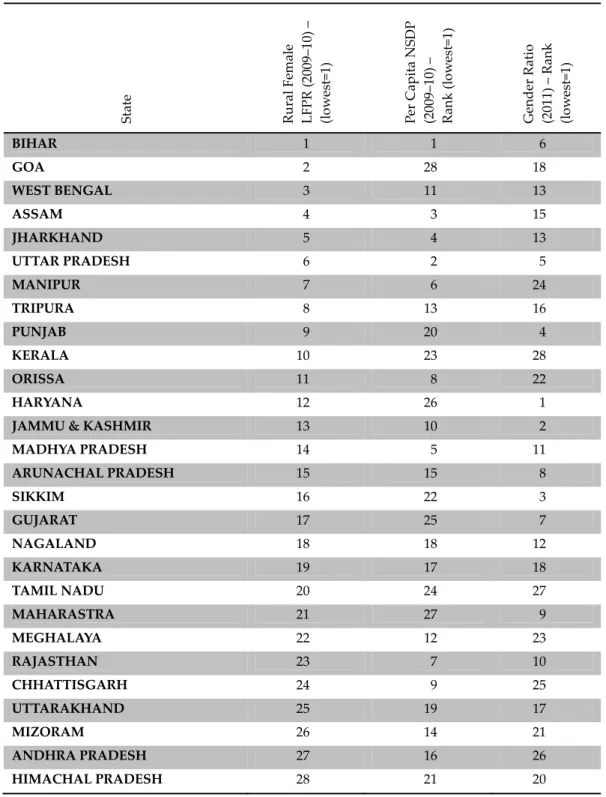
If we take the per capita state domestic product as an indicator of the availability of em‐
ployment opportunities in the respective state (the higher the per capita net state domestic product [NSDP], the greater the employment opportunities), we can derive the following picture (see Table 9). Bihar, which has the lowest level of rural female LFP (rank 1), also has the lowest per capita NSDP. The per capita NSDP rankings for most states seem to be largely consistent with the rural female LFP ranking.9 Noteworthy negative outliers are Goa, Punjab, Kerala, and Haryana, which have rather low rural female LFP despite high rates of per capita NSDP. This seems to imply a lack of employment opportunities for rural women in these states. Positive outliers appear to be states such as Rajasthan, Chhattisgarh, Mizoram, and perhaps Andhra Pradesh, which have relatively high rural female LFP rates despite low to middle per capita NSDP levels.
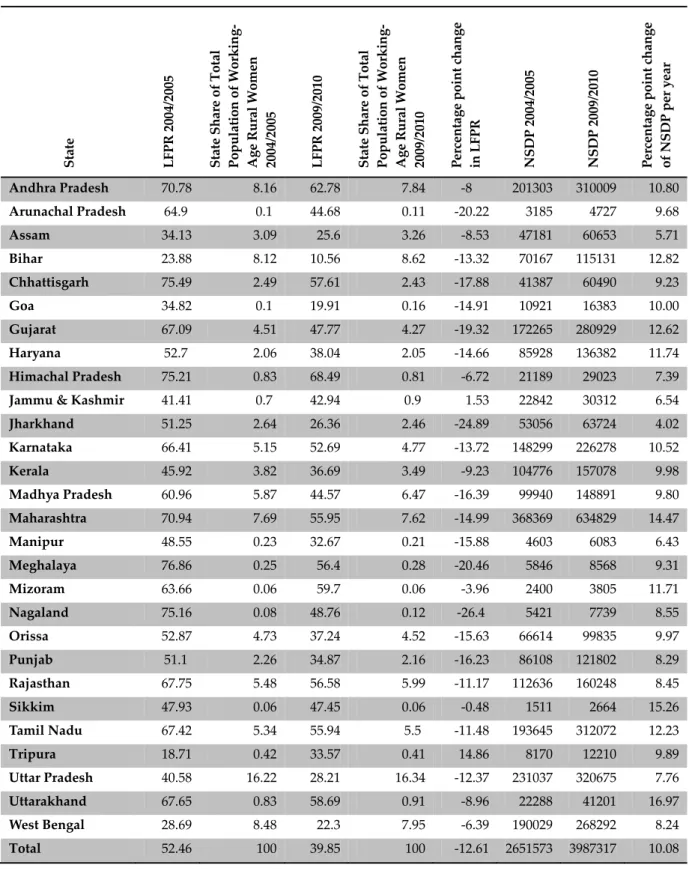
Is the decline in the rural female LFPR due to a decline in employment opportunities at the state level? Have certain states seen a larger decline in employment opportunities due to their share in the total rural female workforce? A preliminary analysis of the changes in rural female LFP and NSDP between 2004/2005 and 2009/2010 finds significantly different trends across states (see Table 10). Four findings stand out:
1) All states have experienced substantial annual growth rates of between 4 and 17 per‐
centage points; hence, one would assume that employment opportunities have in‐
creased.
2) The rural female LFPR has, however, declined in the majority of the states – with the ex‐
ception of Jammu and Kashmir and Tripura, where an increase in rural women’s LFP of 1.5 and 15 percentage points, respectively, can be observed.
3) The relatively small states of Arunachal Pradesh (‐20 percentage points), Jharkhand (‐25 percentage points), Meghalaya (‐21 percentage points), and Nagaland (‐26 percentage points) have experienced the largest relative decline (over 20 percentage points) in rural female LFP.
4) Overall, the change in the LFPR of rural women in these states does not have a big im‐
pact on the all‐India female LFPR since their share of the total working‐age (15–59) population is rather small. In contrast, the LFPR decline in states such as Uttar Pradesh is likely to have had the largest impact, since the female LFPR there has dropped by 12 percentage points and because the state is home to 16 percent of all rural women of working age. Other states with a large share of working‐age women that have experi‐
enced a significant decline in rural women’s LFP are Bihar, West Bengal, Maharashtra, and Madhya Pradesh.
9 The strength of the correlation between the rankings of the LFPR and the NSDP = 0.32 and is significant at the 10 percent level.
Table 9: State Female Labor Force Participation Rankings,
Per Capita Net State Domestic Product, and Gender Ratio
State Rural Female LFPR (2009–10) – (lowest=1) Per Capita NSDP (2009–10) – Rank (lowest=1) Gender Ratio (2011) – Rank (lowest=1)
BIHAR 1 1 6
GOA 2 28 18
WEST BENGAL 3 11 13
ASSAM 4 3 15
JHARKHAND 5 4 13
UTTAR PRADESH 6 2 5
MANIPUR 7 6 24
TRIPURA 8 13 16
PUNJAB 9 20 4
KERALA 10 23 28
ORISSA 11 8 22
HARYANA 12 26 1
JAMMU & KASHMIR 13 10 2
MADHYA PRADESH 14 5 11
ARUNACHAL PRADESH 15 15 8
SIKKIM 16 22 3
GUJARAT 17 25 7
NAGALAND 18 18 12
KARNATAKA 19 17 18
TAMIL NADU 20 24 27
MAHARASTRA 21 27 9
MEGHALAYA 22 12 23
RAJASTHAN 23 7 10
CHHATTISGARH 24 9 25
UTTARAKHAND 25 19 17
MIZORAM 26 14 21
ANDHRA PRADESH 27 16 26
HIMACHAL PRADESH 28 21 20
Source: NSDP: MOSPI, Central Statistics Office (CSO) website10 as on 7 May 2012. Gender ratio: Provisional Population Totals India Census 2011.11 LFPR: NSS EUS 66th round. Authors’ own calculations. *The states are ranked according to their rural female LFPR, whereby the higher ranking (e.g., 1) is assigned to those states with the lowest rural female LFPR (e.g., Bihar).
10 Online: <http://mospi.nic.in/Mospi_New/upload/State_wise_SDP_2004‐05_14mar12.pdf> (7 May 2012).
11 Online: <www.censusindia.gov.in/2011‐prov‐results/census2011_PPT_paper1.html> (7 May 2012).
Table 10: Changes in the Rural Female LFPR (age 15+) and NSDP between 2004 and 2010
State LFPR 2004/2005 State Share of Total Population of Working‐ Age Rural Women 2004/2005 LFPR 2009/2010 State Share of Total Population of Working‐ Age Rural Women 2009/2010 Percentage point change in LFPR NSDP 2004/2005 NSDP 2009/2010 Percentage point change of NSDP per year
Andhra Pradesh 70.78 8.16 62.78 7.84 ‐8 201303 310009 10.80 Arunachal Pradesh 64.9 0.1 44.68 0.11 ‐20.22 3185 4727 9.68
Assam 34.13 3.09 25.6 3.26 ‐8.53 47181 60653 5.71
Bihar 23.88 8.12 10.56 8.62 ‐13.32 70167 115131 12.82 Chhattisgarh 75.49 2.49 57.61 2.43 ‐17.88 41387 60490 9.23
Goa 34.82 0.1 19.91 0.16 ‐14.91 10921 16383 10.00
Gujarat 67.09 4.51 47.77 4.27 ‐19.32 172265 280929 12.62 Haryana 52.7 2.06 38.04 2.05 ‐14.66 85928 136382 11.74 Himachal Pradesh 75.21 0.83 68.49 0.81 ‐6.72 21189 29023 7.39 Jammu & Kashmir 41.41 0.7 42.94 0.9 1.53 22842 30312 6.54 Jharkhand 51.25 2.64 26.36 2.46 ‐24.89 53056 63724 4.02 Karnataka 66.41 5.15 52.69 4.77 ‐13.72 148299 226278 10.52 Kerala 45.92 3.82 36.69 3.49 ‐9.23 104776 157078 9.98 Madhya Pradesh 60.96 5.87 44.57 6.47 ‐16.39 99940 148891 9.80 Maharashtra 70.94 7.69 55.95 7.62 ‐14.99 368369 634829 14.47 Manipur 48.55 0.23 32.67 0.21 ‐15.88 4603 6083 6.43 Meghalaya 76.86 0.25 56.4 0.28 ‐20.46 5846 8568 9.31
Mizoram 63.66 0.06 59.7 0.06 ‐3.96 2400 3805 11.71
Nagaland 75.16 0.08 48.76 0.12 ‐26.4 5421 7739 8.55 Orissa 52.87 4.73 37.24 4.52 ‐15.63 66614 99835 9.97 Punjab 51.1 2.26 34.87 2.16 ‐16.23 86108 121802 8.29 Rajasthan 67.75 5.48 56.58 5.99 ‐11.17 112636 160248 8.45
Sikkim 47.93 0.06 47.45 0.06 ‐0.48 1511 2664 15.26
Tamil Nadu 67.42 5.34 55.94 5.5 ‐11.48 193645 312072 12.23 Tripura 18.71 0.42 33.57 0.41 14.86 8170 12210 9.89 Uttar Pradesh 40.58 16.22 28.21 16.34 ‐12.37 231037 320675 7.76 Uttarakhand 67.65 0.83 58.69 0.91 ‐8.96 22288 41201 16.97 West Bengal 28.69 8.48 22.3 7.95 ‐6.39 190029 268292 8.24 Total 52.46 100 39.85 100 ‐12.61 2651573 3987317 10.08
Source: NSS 61st and 66th round; Authors’ own calculations. NSDP: Central Statistics Office (India) website12 as on 7 May 2012.
12 Online: <http://mospi.nic.in/Mospi_New/upload/State_wise_SDP_2004‐05_14mar12.pdf> (7 May 2012).
The structure of the rural economy is thus characterized by an oversupply of labor (Harriss‐
White 2003). As a result of stronger competition with men due to the increasing population, women might have even fewer employment opportunities and might be forced out of or drop out of the labor force altogether. Moreover, supply‐side factors such as social customs that disadvantage certain social groups (for instance, women or lower‐caste groups) in the labor market might also be at work. For example, tasks are traditionally assigned along gen‐
der lines. This is referred to as the sexual division of labor. In agriculture women undertake most tasks except for plowing, which has traditionally remained a male domain. If a task is performed by women, then it is perceived as less valuable (Banerjee 1995), which in turn negatively affects the wage. Women are paid much lower wages than men and are often forced to work as unpaid family workers. Mazumdar and Neetha (2011) argue that the period of deindustrialization between 1999 and 2005 led to a decline in nonagricultural employment opportunities for women.
In 2009/2010 the rural economy was still dominated by low‐productivity agriculture. The vast majority of both rural working men (61 percent) and rural working women (80 percent) work in the agricultural sector, which accounts for 67 percent of the total rural workforce (see Table 11). Other industries with a significant share of women include manufacturing (6.1 percent), construction (5.6 percent), and other services (4.9 percent). Apart from agriculture, rural men work in construction (12 percent), retail, hotels and restaurants (8.3 percent), man‐
ufacturing (7.3 percent), and other services (5.9 percent). The gender difference in workforce presence by industry is significant at the 1 percent level.13
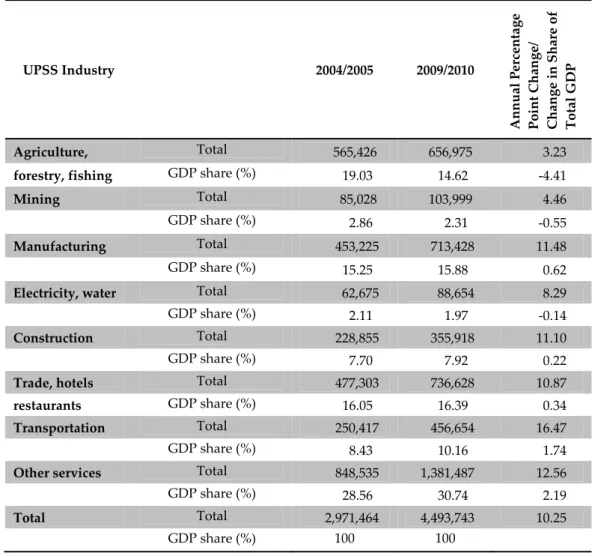
Could changes in the output of a specific industrial sector with a substantial number of women workers be responsible for the decline in rural women’s LFPR? All industrial sectors experienced GDP growth between 2004 and 2010; some, however, suffered a relative loss in terms of their share in total GDP (see Table 12). Although the agricultural sector has experi‐
enced annual growth of 3.2 percentage points, its share of the total GDP has declined by 4.4 percentage points. Apart from the agricultural sector, only the mining (‐0.6 percentage points) and electricity/water (0.1 percentage points) sectors suffered relative (but very small) losses in their share of total GDP. The category “other services” profited the most from this relative loss, gaining 2.19 percentage points in the share of total GDP, followed by transpor‐
tation (1.75 percentage points), and manufacturing (0.62 percentage points). The fact that the output of the agricultural sector (the agricultural sector also has the highest proportion of female employment) increased during the period 2004/2005–2009/2010 along with the rela‐
tively small decline in the share of this sector for the same period suggest that there is little to support the hypothesis that a decrease in the output of a specific sector with a substantial share of women workers is accountable for the decline in the rural female LFPR.
13 The distribution of industries is significantly different (1 percent level) between male and female workers.
Pearson‐test: Design‐based F (6.29, 78980,19) = 198,24, chi 2 (7) = 17900.
Table 11: Distribution of Rural Workers by Industry and Gender, 2009/2010
UPSS* Industry Male Female Total
Agriculture, forestry, fishing
Column % 61.0 80.3
Share of total workforce (%) 42.0 25.0 66.9
Mining Column % 0.88 0.3
Share of total workforce (%) 0.6 0.1 0.7
Manufacturing Column % 7.3 6.1
Share of total workforce (%) 5.0 1.9 6.9
Electricity, water Column % 0.2 0.04
Share of total workforce (%) 0.2 0.01 0.2
Construction Column % 12.0 5.6
Share of total workforce (%) 8.3 1.7 10.0 Trade, hotels, restau‐
rants
Column % 8.3 2.7
Share of total workforce (%) 5.7 0.9 6.6
Transportation Column % 4.5 0.2
Share of total workforce (%) 3.1 0.1 3.2
Other services Column % 5.9 4.9
Share of total workforce (%) 4.1 1.5 5.6
Total Column % 100 100
Share of total workforce (%) 68.89 31.11 100 Source: NSS 61st and 66th round. *UPSS: Usual principal and subsidiary status. Authors’ own calculations.
Table 12: GDP by Industry in Crore Indian Rupees at Constant 2004/2005 Factor Costs
UPSS Industry 2004/2005 2009/2010
Annual Percentage Point Change/ Change in Share of Total GDP
Agriculture, Total 565,426 656,975 3.23
forestry, fishing GDP share (%) 19.03 14.62 ‐4.41
Mining Total 85,028 103,999 4.46
GDP share (%) 2.86 2.31 ‐0.55
Manufacturing Total 453,225 713,428 11.48
GDP share (%) 15.25 15.88 0.62
Electricity, water Total 62,675 88,654 8.29
GDP share (%) 2.11 1.97 ‐0.14
Construction Total 228,855 355,918 11.10
GDP share (%) 7.70 7.92 0.22
Trade, hotels Total 477,303 736,628 10.87
restaurants GDP share (%) 16.05 16.39 0.34
Transportation Total 250,417 456,654 16.47
GDP share (%) 8.43 10.16 1.74
Other services Total 848,535 1,381,487 12.56
GDP share (%) 28.56 30.74 2.19
Total Total 2,971,464 4,493,743 10.25
GDP share (%) 100 100
Source: NSS 61st and 66th round. GDP: Central Statistics Office (India). Authors’ own calculations.