Policy Research Working Paper 7222
What Explains the Stagnation of Female Labor Force Participation in Urban India?
Stephan Klasen Janneke Pieters
Development Economics Vice Presidency Development Policy Department
March 2015
WPS7222
Public Disclosure AuthorizedPublic Disclosure AuthorizedPublic Disclosure AuthorizedPublic Disclosure Authorized
Produced by the Research Support Team
Abstract
The Policy Research Working Paper Series disseminates the findings of work in progress to encourage the exchange of ideas about development issues. An objective of the series is to get the findings out quickly, even if the presentations are less than fully polished. The papers carry the names of the authors and should be cited accordingly. The findings, interpretations, and conclusions expressed in this paper are entirely those of the authors. They do not necessarily represent the views of the International Bank for Reconstruction and Development/World Bank and its affiliated organizations, or those of the Executive Directors of the World Bank or the governments they represent.
Policy Research Working Paper 7222
This paper is a product of the Development Policy Department, Development Economics Vice Presidency. It is part of a larger effort by the World Bank to provide open access to its research and make a contribution to development policy discussions around the world. Policy Research Working Papers are also posted on the Web at http://econ.worldbank.org.
The authors may be contacted at sklasen@uni-goettingen.de and janneke.pieters@wur.nl.
Female labor force participation rates in urban India between 1987 and 2011 are surprisingly low and have stagnated since the late 1980s. Despite rising growth, fertility decline, and rising wages and education levels, married women’s labor force participation hovered around 18 percent. Analysis of five large cross-sectional micro surveys shows that a combination of supply and
demand effects have contributed to this stagnation. The main supply side factors are rising household incomes and husband’s education as well as the falling selectivity of highly educated women. On the demand side, the sec- tors that draw in female workers have expanded least, so that changes in the sectoral structure of employment alone would have actually led to declining participation rates.
What Explains the Stagnation of Female Labor Force Participation in Urban India?
Stephan Klasen and Janneke Pieters1
JEL codes: J20, J16, I25, O15
Keywords: female labor force participation, education, India Sector board: Gender and Development
1Stephan Klasen is Professor at the University of Göttingen and Research Fellow at IZA; his email address is sklasen@uni-goettingen.de. Janneke Pieters (corresponding author) is Assistant Professor at Wageningen University and Research Fellow at IZA; her email address is janneke.pieters@wur.nl. This paper has benefitted from the comments of Sonia Bhalotra, Francine Blau, Tanika Chakraborty, Lawrence Kahn, Stefan Klonner, David Lam, Ghazala Mansuri, Vijayendra Rao, Sher Verick, two anonymous referees, and the editor of this journal. We also had helpful comments from seminar participants at the Delhi School of Economics, the Harvard Center for Population and Development Studies, The New School, IZA, Passau, the World Bank, the IZA/World Bank Conference on Employment and
Development, and the annual conference of the European Society for Population Economics. Please cite this paper as Klasen & Pieters (2015), “What Explains the Stagnation of Female Labor Force Participation in Urban India?”, World Bank Economic Review, forthcoming.
2
India’s economy has grown rapidly over the past two decades, with the services sector accounting for a large share of growth (Bosworth and Collins 2008). India has also experienced a sizable fertility decline, a rapid education expansion, and a decline in the education gender gap, while the labor market returns to education increased (Kijima 2006; Pieters 2010). Against this background, it is puzzling to see that the reported female labor force participation rate in urban India has stagnated at around 18 percent since the 1980s. Considering these circumstances, one would expect a rising share of women to enter the labor force, especially in urban India where women have gotten much more educated and where white-collar jobs are concentrated.
The aim of this paper is to investigate why female labor force participation (FLFP) in urban India stagnated despite rising education levels and rapid economic growth. Standard labor supply models and previous research on FLFP and economic development (Goldin 1994; Mammen and Paxson 2000; Blau and Kahn 2007) suggest that rising education and growth of white-collar services employment should draw more women into the labor force by increasing their earnings capacity and reducing social stigma against women’s work. On the other hand, rising household incomes could lead to a withdrawal of women from the labor market due to well-known income effect. India is not the only country where female labor force participation has stagnated despite overall growth, fertility decline, and rising female education. In the Middle East and North Africa, one can observe vast and persistent gender gaps in employment despite rising female education levels in many countries. This has been partly ascribed to conservative social attitudes towards women’s work in the region (see Gaddis and Klasen 2014), and similar factors might be at play in India as well.
Understanding the causes of stagnation in FLFP matters for several reasons. India currently has an advantageous age structure of the population with a large and growing share of working age people and relatively few dependents. Optimistic predictions for India’s future growth often refer
3
to this demographic dividend, which is alleged to have accounted for about a third of East Asia’s high per capita growth rates in the period between 1965 and 1990 (Bloom and Williamson 1998;
Bloom 2011). However, the benefits of a country’s demographic dividend hinge on the productive employment of the male and female working-age population,. In fact, high and rising female employment levels contribute to greater productivity growth (World Bank 2011) and have in fact been critical in sustaining East Asia’s high economic growth rates (Klasen and Lamanna 2009;
Young 1995).
Beyond women’s contribution to growth, stagnation in FLFP has implications for the degree to which women benefit from growth. Employment and earnings are robust determinants of bargaining power, with impacts on female and children’s well-being (Qian 2008; Anderson and Eswaran 2009; Afridi et al. 2012). If there are structural economic or cultural barriers preventing women’s labor force participation, women are unable to capitalize on these opportunities.
In this paper, we estimate a simple model of female labor force participation using individual level cross-section data spanning the period 1987 to 2011. The model is estimated separately for each survey year and for women with low and high educational attainment. Our estimation results provide a detailed account of the impact of various factors on women’s labor force participation and their changes over time. We find a strong conditional relationship between education and labor force participation that is U-shaped, which points at the importance of social stigma for women to work in low-skilled jobs. Accordingly, we show that women with low education appear to be boxed in by the necessity to work if household incomes are very low or insecure, and stigmas attached to working in low-skilled jobs if they are somewhat more educated and in more secure economic environments. Highly educated women appear generally less constrained by family circumstances in their labor force participation decision.
4
The estimates are further used to decompose the stagnation of FLFP between 1987 and 2011 into contributions by different covariates and changes in behavior and unobservables (Fairlie 2006). On the supply side, we find that rising male incomes and education contributed to a withdrawal of women from the labor force, showing that the classic income effect is at work in urban India. On the demand side, changes in the sectoral structure of employment account for a further reduction in FLFP, in particular related to the declining shares of agriculture and manufacturing which tend to employ more women (particularly in recent years).
The effect of rising female education on female labor force participation is more complicated.
Besides a U-shaped relationship between education and labor force participation, our estimates show a large decline in the positive participation effect associated with secondary and graduate education. As a result, the substantial increase in educational attainment of women contributed only moderately to FLFP growth. We provide suggestive evidence that the declining positive effect of higher education is partly accounted for by an erosion of positive selection into higher education, that is, a declining correlation between determinants of higher educational attainment and unobserved determinants of labor force participation. Reasons for this could be the rapid expansion of education supply, but also rising marriage market returns to education, leading women to pursue higher education regardless of their expected labor market attachment.
The paper is organized as follows. Section I discusses the literature on female labor force participation determinants, focusing in particular on economic development and rising education levels. Section II describes patterns of FLFP, wages, education, and employment in urban India.
Section III presents our empirical FLFP model and estimation results, followed by the decomposition analysis in Section IV. Section V further investigates the relationship between women’s education and labor force participation. Section VI concludes.
5
I. Development, Education, and Female Labor Force Participation
Labor force participation decisions can be the outcome of individual preferences of the woman, her family circumstances, as well as labor demand conditions for jobs that women are particularly suited for, or where employment in these jobs is seen as socially acceptable. Education can play a key role in shaping these supply and demand conditions. We will discuss these issues in turn.
A common starting point for the analysis of female labor force participation is the basic static labor supply model (see Blundell and MaCurdy 1999), in which an increase in the wage rate reduces demand for leisure as its opportunity cost rises, increasing labor supply. If leisure is a normal good, an increase in a person’s income will increase the demand for leisure and thus reduce labor supply. These are the well-known substitution and income effects. For a person currently not working, an increase in the wage rate only has a substitution effect, increasing her incentive to work (i.e., one would always expect a positive own wage effect at the extensive margin). An increase in unearned income (nonlabor income or labor income earned by other household members, particularly the husband) constitutes a pure income effect and therefore reduces labor force participation.
In initial stages of economic development, education levels typically increase much more for men than for women. Women’s wages and opportunities for work change relatively slowly while their husband’s income rises fast, so the negative income effect is likely to dominate any positive substitution effect of rising female wages. This is what drives reductions in FLFP according to the so-called Feminization-U hypothesis (Boserup 1970; Goldin 1994; Mammen and Paxson 2000;
Gaddis and Klasen 2014).2 Participation is further reduced because of social stigma against women working outside of the home, especially in factory work, and the difficulty of combining household
2 Though the feminization-U is sometimes considered a stylized fact, the empirical evidence in support of it is mostly based on cross-country analysis, while panel analyses have produced mixed results (Tam 2011; Gaddis and Klasen 2014).
6
production with market work in nonagricultural occupations; these effects are held to be particularly strong for married women.
In later stages of development, women’s education starts to catch up to men’s, their earnings capacity increases and they gain access to socially acceptable types of work, especially if demand for white-collar workers increases with the expansion of the services sector. This will result in higher FLFP,3 but country-specific labor demand conditions clearly play a role in this process. The increase in FLFP could depend on growth in employment opportunities of the kind deemed appropriate for educated women, relative to growth in the educated working age population.
Boserup (1970) describes how the feminization of clerical jobs proceeds very slowly when the number of educated men is in excess of demand for clerical workers. In those cases, there is likely to be considerable resistance against women’s employment in white-collar jobs, as this would reduce the opportunities for men (Boserup 1970: chapter 7). How the education-labor force participation link evolves over time will thus depend on the structure of labor demand growth in the economy and the status associated with different types of work.4 If female labor mobility is limited, as is the case in India, the growth in desirable jobs relative to the educated population can generate local mismatches with impacts on female labor force participation rates.
One might further hypothesize that similar factors produce a U-shaped relationship between economic or educational status and women’s labor force participation at a given point in time within a country—as is indeed observed in India. Among the poorest with no or very little education, women are forced to work to survive, while among the very highly educated, high wages
3 Over the course of development, changes in circumstances may also be accompanied by changes in women’s behavior, i.e., the degree to which wages, income, and social restrictions affect FLFP. As Goldin (1990) describes the history of women’s work in the United States, economic development is reflected in an increasing own wage effect while women’s responsiveness to other family income declines. Blau and Kahn (2007) and Heim (2007) find similar evidence for women in the United States.
4 A gender assessment for Pakistan (World Bank 2005) shows that the increase in urban female labor force participation in the 1990s was driven by an increased demand for teachers. But overall, still a much higher proportion of urban men than women are engaged in white-collar jobs.
7
induce women to work and stigmas militating against female employment in white-collar jobs that are open to highly educated women are low. Between these two groups, women face barriers to labor force participation related to both the absence of an urgent need to work (the income effect), and the presence of social stigmas associated with female employment in menial jobs.
A correlation between education levels and labor force participation can also appear when both are outcomes of unobserved preferences for work (e.g., related to family background), such that women with a greater taste for work are more likely to attain higher education. Recent research has shown that primary and secondary school enrollment in India respond to the perceived returns to schooling, in particular, the availability and awareness of job opportunities in business and IT- services (Jensen 2012; Shastry 2012; Oster and Millett Steinberg 2013). These studies also show, however, that responses are limited to very local opportunities and that girls’ schooling is affected by active recruitment rather than the mere availability of jobs (Jensen 2012). It apparently takes more than growth and rising wages to raise awareness of labor market opportunities, and despite its fast growth, the business services sector still accounts for only a small share of total employment in India. Nonetheless, when analyzing the effect of education on labor force participation it is important to keep in mind the potential endogeneity of education through nonrandom selection into education.
Education could be endogenous to labor force participation in the exact opposite direction as well. In India, social restrictions on the lifestyles of women tend to become more rigid as households move up in the caste hierarchy (Chen and Drèze 1992). If education of women and restrictions on women’s mobility and work both increase with families’ social status, one would observe a negative correlation between education and labor force participation, at least for some levels of education. Eswaran et al. (2013) find supporting evidence for this negative endogeneity
8
channel in rural India (based on data for 1998–99), but Das and Desai (2003) find no support in a sample of rural and urban women in India in 1993–94.
In all, major determinants of women’s labor force participation over the course of economic development are income, wages, and access to jobs deemed appropriate for women. Education levels shape female labor force participation partly through these channels. But women’s education is likely to reflect other, unobserved determinants as well. We analyze the role of education and other determinants in detail in our econometric analysis in Section III. First, Section II gives a descriptive analysis of the most important trends in the data.
II. Female Labor Force Participation in Urban India
The descriptions and empirical analysis in this paper are based on the so-called thick waves of the NSS Employment and Unemployment Survey, in 1987–88, 1993–94, 1999–2000, 2004–-05, 2009–10, and 2011–12 (henceforth 1987, 1993, 1999, 2004, 2009, and 2011). This cross-sectional survey is the official source of nationally representative employment and earnings data used by the Government of India.
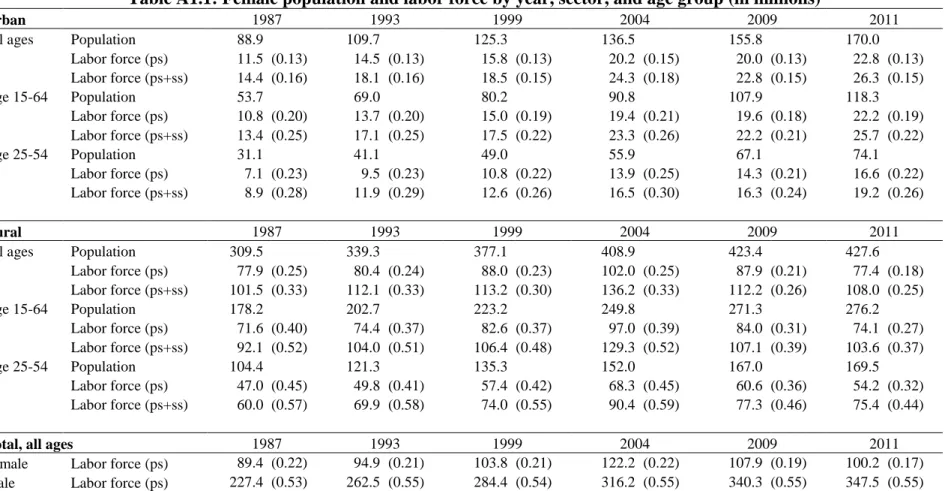
Before discussing labor market developments in urban India in detail, Table A1.1 in appendix 1 summarizes the trends in the female population and labor force for urban and rural India, for different age groups. Female population growth in the age group 15–64, and especially 25–54, exceeds total female population growth. Due to this demographic change, the female labor force has almost doubled in urban India and stayed constant in rural India, despite stagnating female labor force participation rates in urban India, and declining rates in rural India. In that sense, India is already benefitting from its demographic dividend related to a favorable age structure (although to a much lower extent than it would if more women were working). As still more than two-thirds of the Indian population lives in rural areas, the rural trend of declining participation rates dwarfs
9
the urban trend, so that overall female labor force participation declined from 22 percent in 1987 to 17 percent in 2011. Note, however, that rural numbers are more likely to suffer from underreporting of women’s work in agricultural activities.
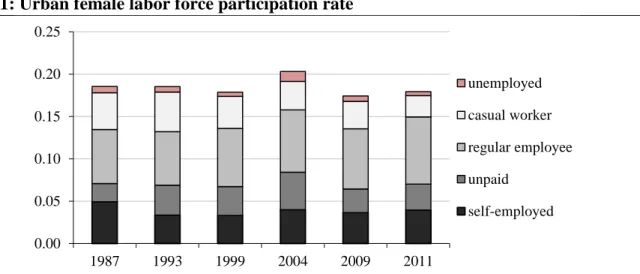
In our analysis we focus on married women in urban India in the age group 25–54. Their labor force participation rate fell slightly from 18.5 percent in 1987 to 17.9 percent in 2011. Breaking down the labor force into different components, one can see in Figure 1 there has been little change in the different types of work and unemployment rates of married women, except for a peak in self- employment and unpaid family work in 2004.5 Throughout the period, the labor force participation rate of urban married men in the same age group was stable at around 97 percent and hardly differs by education levels.
Figure 1: Urban female labor force participation rate
Note: Married women age 25-54. Self-employment includes employers and own account workers. Unpaid refers to unpaid family workers. Regular employees receive salary or wages on a regular basis. Casual workers receive a wage according to the terms of the daily or periodic work contract. Source: NSS Employment and Unemployment Survey
5 We always use the sampling weights provided. There is some question whether differences in sampling strategy between rounds might have a (slight) impact on the comparability of levels in the female labor force participation shown here, particularly also the peak reported in 2004–05. As discussed above, however, they will not affect the observation of low levels, and the stability over time. For a discussion of these issues, see Klonner and Oldiges (2014).
0.00 0.05 0.10 0.15 0.20 0.25
1987 1993 1999 2004 2009 2011
unemployed casual worker regular employee unpaid
self-employed
10
Marriage is almost universal in India, with average age at marriage around 19 in urban India in 2004–05 (Desai et al. 2010). According to the NSS survey data, the share of ever-married women among urban women age 25–54 was 95.3 percent in 2011 and 96.5 percent in 1987. Because in the age group 20–24 the marriage rate declined over time as more women pursue higher education and postpone marriage, we focus our analysis on women age 25 and older. We also exclude the 2 percent of all married women in this age group who report being head of their household.6
Female participation rates are calculated using women’s reported usual status, which refers to a reference period of 1 year in which the principal activity is the activity in which the respondent spent the majority of time. Subsidiary activity status is recorded as well but is not taken into account in our analysis, as it affects less than 5 percent of the adult urban female population and its definition is not consistent over time.7 Nonetheless, the pattern of female labor force participation is similar across different age groups, when including unmarried women, and when including labor force participation in both principal and subsidiary activities (see Table A1.1 in the appendix).
One might worry that even though unpaid family workers and own account workers are considered part of the labor force, women’s work is underreported. Survey respondents may be reluctant to report women’s contributions to family businesses or may not consider a woman’s work to be different from her general domestic duties. This type of underreporting will mainly affect participation rates in rural areas, where women spent much more time on farm activities that are less likely to be considered as work, and will affect subsidiary status activities more than principal status activities because the former includes work done for only a few hours per day or during peak season only, etc. Principal status participation rates in urban India are arguably least
6 We exclude them because we are interested in the role of women’s own versus household head education, among others. Participation rates of female household heads are higher, and declined from 39 percent in 1987 to 30 percent in 2011.
7 Before the 2004 wave, there was no lower bound on the number of hours spent on a particular activity to be considered as subsidiary activity, but in 2004 the minimum was set at 30 days of the reference year.
11
affected by underreporting of women’s work but have the disadvantage that women working part time are not considered as active in the labor force if they spend the majority of their time in domestic duties. This is important to keep in mind, but as noted above this affects at most 5 percent of the sample and does not affect time trends.
To provide some verification of participation rates from the NSS Employment and Unemployment Survey using other data, we compare the 2004-05 numbers to the 2004-05 wave of the India Human Development Survey (Desai et al. 2009). There is no major time criterion to be considered as a worker in the IHDS survey, and there is considerably more probing as respondents are asked to specify each household member’s contribution to each family business as well as any other activities earning an income or a wage.8 For married women in urban India in the age group 25–54, the IHDS data show an employment rate (unemployment is not recorded) of 19.8 percent, which is very close to 19.6 percent based on the NSS data. The participation rate for married women in urban Delhi is also very similar between the NSS 2004–05 wave (19.4 percent) and a survey done for a study on women’s work in 2006 (19 percent; see Sudarshan and Bhattacharya 2009).
Figure 2 shows that the urban FLFP rate has a U-shaped relationship with education and that the stagnation in FLFP hides a combination of rising participation among women with low education and a decline in participation rates of highly educated women. As income, wages, and access to different types of jobs are important candidates for explaining these patterns, we now turn to a brief discussion of those.
Figure 2: Urban female labor force participation rate by education level
8 See http://ihds.umd.edu/questionnaires.html for the IHDS household questionnaires.
12
Note: Married women age 25-54. Education is the highest level completed, see appendix Table A1.2 for definitions.
Source: NSS Employment and Unemployment Survey.
In line with India’s high growth rates, earnings data form the NSS surveys show that real wages roughly doubled between 1987 and 2011 (see Fig. A1.1 in the appendix). In absolute terms, real wages increased almost equally for men and women, but the ratio of male to female average weekly earnings declined from 1.6 in 1987 to 1.3 in 2011. Given the very high participation rates of married men in this age group and their higher average wages, one can safely assume that most women in urban India are secondary earners. Rising earnings of men most likely had a strong negative impact on female labor force participation. But with women’s wages increasing more than men’s, positive substitution effects could at least partly offset the negative impact of men’s income.
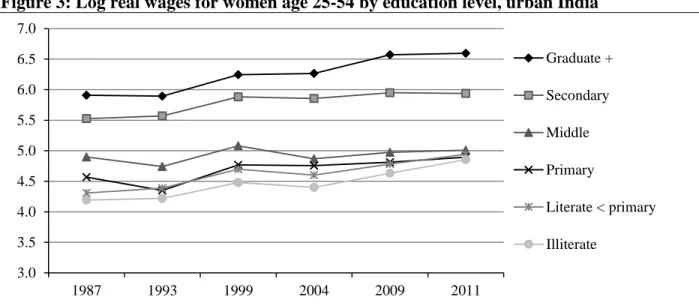
However, patterns in the data suggest there is no close link between women’s wages and their labor force participation. Figure 3 shows women’s real wages by education level. Returns to secondary and graduate education are high and rising, especially returns to graduate education.
Real wages at lower levels of schooling, on the other hand, show a strong convergence due to relatively fast wage growth of illiterate women. If anything, own wage effects would thus have led to increases in labor force participation rates at both the ends of the educational distribution—for illiterate women on the one side and highly educated women on the other side. Going back to
0%
5%
10%
15%
20%
25%
30%
35%
Illiterate Lit < prim Primary Middle Secondary Graduate
1987 1993 1999 2004 2009 2011
13
Figure 2, however, we see that these are exactly the groups of women for whom participation rates declined.
Figure 3: Log real wages for women age 25-54 by education level, urban India
Note: Wages are average total weekly earnings for casual and regular employees. Earnings are spatially deflated and in 1987-88 Rupees, based on the Labour Bureau Consumer Price Index for Industrial Workers and Deaton (2003).
Source: NSS Employment and Unemployment Survey
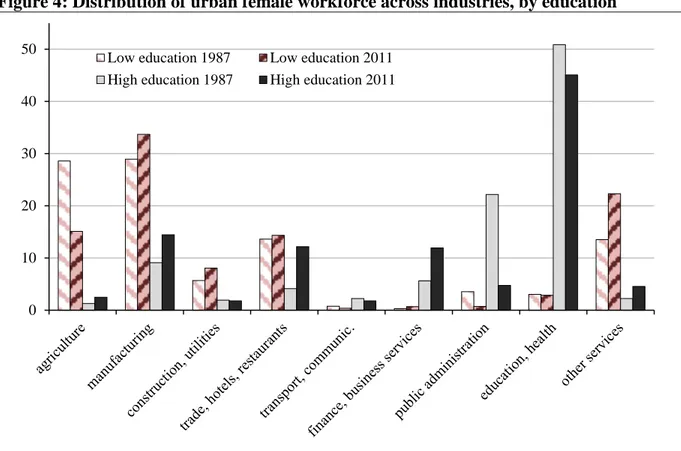
Wages may have little impact on FLFP, despite rising returns to higher education, if employment growth in the activities appropriate for educated women is limited. As shown in Figure 4, the distribution of female workers across industries changes substantially with education. The distribution is shown separately for women below secondary education and those with secondary or higher education. Women with lower education work mainly in agriculture, manufacturing, and domestic services (included in “other services”). Access to white-collar services sector jobs is mostly confined to women with at least secondary education, but declined steeply over time. By and large, this pattern is consistent with the U-shape in education suggesting that only with at least secondary education, women gain access to jobs that are not subject to social stigma. It could also account for the declining participation rates of highly educated women whose supply increased
3.0 3.5 4.0 4.5 5.0 5.5 6.0 6.5 7.0
1987 1993 1999 2004 2009 2011
Graduate + Secondary Middle Primary
Literate < primary Illiterate
14
much faster than available jobs, thereby reducing employment opportunities for them in these sectors.
Figure 4: Distribution of urban female workforce across industries, by education
Note: Distribution of female workers across industries, including employees, self-employed and unpaid family workers. Shares are in percentage of all female workers in the respective education group. Low education is below secondary schooling; high education is secondary or higher. Source: NSS Employment and Unemployment Survey.
In 1987 the vast majority of highly educated women worked in public administration, education, and health. This share declined to 50 percent in 2011, mainly driven by a declining share of public administration. Although financial and business services have become more important, they still account for only a small fraction of female employment. Consequently, highly educated women are increasingly working in industries such as manufacturing (mostly in textiles), wholesale and retail trade, and domestic services; within these sectors, many highly educated women work in
0 10 20 30 40
50 Low education 1987 Low education 2011 High education 1987 High education 2011
15
professional and administrative occupations so that there are still white-collar occupations.9 For low-educated women, employment has shifted from agriculture into food and tobacco, textiles, construction, and domestic services.10
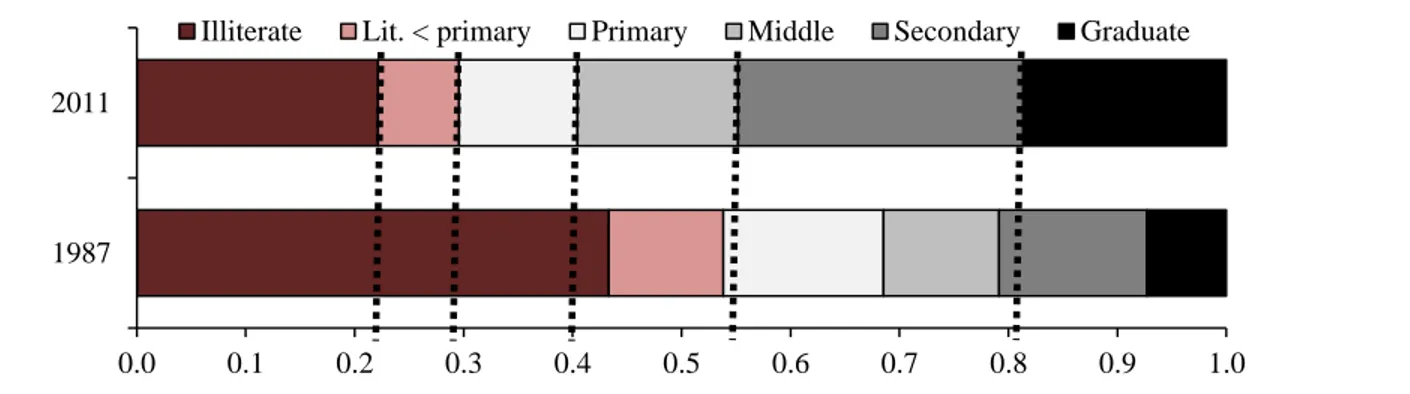
The changing industrial distribution of workers is consistent with Boserup’s (1970) description of white-collar jobs becoming increasingly scarce when education levels grow rapidly. The distribution of male workers (not shown) confirms that the share of white-collar services employment has declined not just for women but for the entire labor force, while employment growth has been concentrated largely in construction and retail and wholesale trade. At the same time, educational attainment has indeed grown rapidly. The share of women with at least secondary education grew from 21 percent in 1987 to 45 percent in 2011. Among men, this share increased from 38 to 56 percent over the same period (for more detail, see Fig. A1.2 in appendix 1). Besides rising incomes, this growing supply of highly educated workers combined with employment shifting toward less skill-intensive sectors could be an important reason why participation rates among highly educated women have declined.
III. Estimating the Determinants of Women’s Labor Force Participation
Using the NSS survey data, we test how the different factors discussed above have contributed to the stagnation of FLFP in urban India. We first estimate the effect of education, income, and other variables on women’s labor force participation in a reduced form labor supply model. In the next section, a decomposition analysis is used to show how changes in the explanatory variables
9 Due to changes in the occupational classification used in the NSS data, we cannot construct a consistent definition of white-collar occupations over time. We do find that in all sectors, highly educated women are more likely to work in professional and administrative occupations than women with less than secondary education.
10 Domestic services could be considered appropriate for women, but they are typically not covered by existing legislation and are relatively easy victims of exploitation due to their invisibility, lack of education and, often, migration background (NCEUS 2007).
16
and changes in coefficients and unobservables contributed to the stagnation of FLFP between 1987 and 2011.
The probability of woman i in year t (1987, 1999, 2004, 2009, and 2011)11 being in the labor force (including self-employment, unpaid family work, regular and casual wage employment, and unemployment) is modeled as
𝑃𝑖𝑡 = 𝐹(𝛼𝑠𝑡+ ∑ 𝛽𝐸 𝑡𝐸 𝐷𝑖𝑡𝐸 + 𝛽𝑋𝑡 𝑋𝑖𝑡+ 𝛽𝑍𝑡 𝑍𝑖𝑡) , (1) where F is the standard normal cumulative distribution function. The model is estimated separately for each year to allow for changes in behavior over time.
The first right-hand side term is a state fixed effect. Education is measured through dummies for the highest education level completed, DE (E=2, …, 6), with illiterate (E=1) as the reference level. 𝑋𝑖𝑡 is a vector of explanatory variables at the individual and household level, including household income excluding her own earnings, and education of the household head. Income is measured as total household earnings in the reference week excluding the woman’s own earnings.12 We use income per capita to control for differences in the number of people depending on that income.13 Instead of an asset index or similar measure of wealth, the education level of the household head is included to capture household wealth or permanent income beyond total earnings. If higher socioeconomic status leads to more restrictions on women and if greater wealth reduces the need for women to work, the education level of the household head should have a
11 Data for 1993 are not used in the econometric analysis because the 1993 data do not contain district identifiers, which are needed to construct district-level explanatory variables. Districts are administrative units at the substate level in India. Our sample covers 362 districts across India’s 18 main states.
12 For total household earnings, the earnings of self-employed household members are imputed based on the earnings of employees. Although this is a fairly rough approximation, it appears this imputation serves the purpose of measuring household income well: results are very similar when households with at least one self-employed adult are excluded from the sample.
13 Data on other income sources are not collected in the survey, nor are household assets.
17
strong negative effect on participation. We also control for the security of household income through an indicator for having at least one male household member with salaried employment.14
Further individual controls are age, age squared, number of children, and social group (indicators for scheduled caste and tribe – SCTS –, non-SCST Hindu, Muslim, and other). These caste and religion dummies are included to capture direct impacts of culturally or religiously determined restrictions on women, which are expected to be strongest among Muslim and high- caste Hindu households (Chen and Drèze 1992; Das and Desai 2003).
𝑍𝑖𝑡 is a vector of local labor demand and supply variables, included to capture the effect of the availability of suitable or attractive jobs. We include the district share of male workers in agriculture15, industry, construction, white-collar services (financial and business services, public administration, education, health, and social work), and other services; and the share of the district working age population with a graduate degree, to control for the local supply of high-skilled labor.
We expect that female participation is higher in districts that are relatively specialized in white- collar services. The relative supply of graduates in the district is expected to depress participation rates through a crowding-out effect. These factors are expected to be particularly important for highly educated women.
Standard labor supply models would also include the woman’s own wage, but identification of own-wage effects is challenging. To estimate the effect of wages on labor force participation it is necessary to use predicted wages for workers and non-workers, corrected for selection into employment and predicted based on at least one exogenous variable (for a discussion see Heim
14 Households, especially in developing countries, can use women’s labor supply to deal with negative income shocks or uncertainty (Attanasio et al. 2005; Bhalotra and Umaña-Aponte 2010). Implicit in the empirical model is the assumption that women’s participation decision is made conditional on men’s: we do not consider joint utility maximization or bargaining within the household. Given the very high and unresponsive labor force participation rates of men, we believe that this assumption is warranted.
15 Employment shares are measured within urban areas of districts, but even in urban areas, households engage in agricultural and livestock production.
18
2007). Following leading studies in the literature (Blau and Kahn 2007; Heim 2007), we estimate two different specifications to identify the own-wage effect. One exploits wage variation across districts, the other exploits wage variation across state-age-education groups. The two sources of variation give very different estimates, which do not allow us to draw firm conclusions about the impact of wages on women’s labor force participation. However, the estimated effects of other explanatory variables, including education, are robust to the different specifications and to excluding the own wage from the model.16 Given the difficulties in identifying the own wage effect and the inability to include the self-employed in models that include own wages, we focus here on the results without including own-wage effects. Results for own-wage estimates and more details of the estimation method are discussed in appendix 2.
Table 1 contains sample means for all variables. The largest changes over time are increasing education (women’s own education levels and those of their male partners and household heads, as well as the district population share with graduate level education) , fertility decline, and increasing household income. Further note that employment has shifted over time from agriculture, manufacturing, and white-collar services to construction and other services. To explore in more detail to what extent the determinants of labor force participation differ between low- and highly educated women, equation (1) is also estimated separately for women with less than secondary education and women with secondary or higher education.
Estimation Results
16 The level of the own education effects does change but in all specifications we find a strong U-shape and a large decline in the effect of secondary and graduate education over time.
19
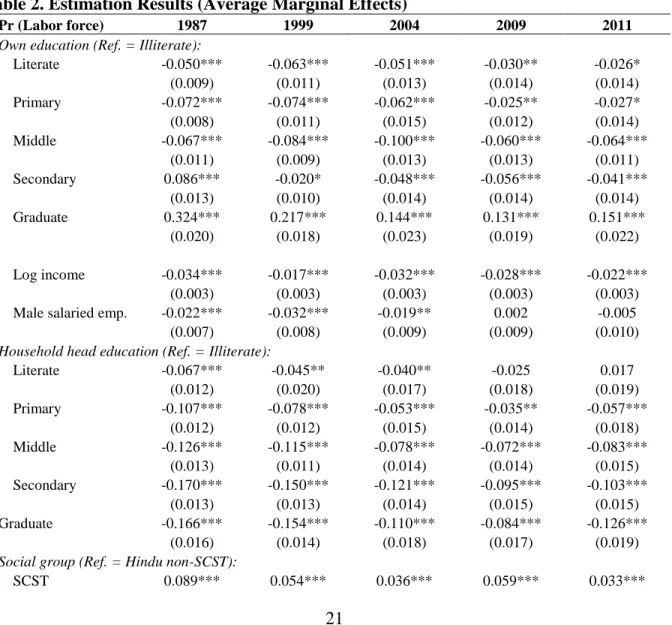
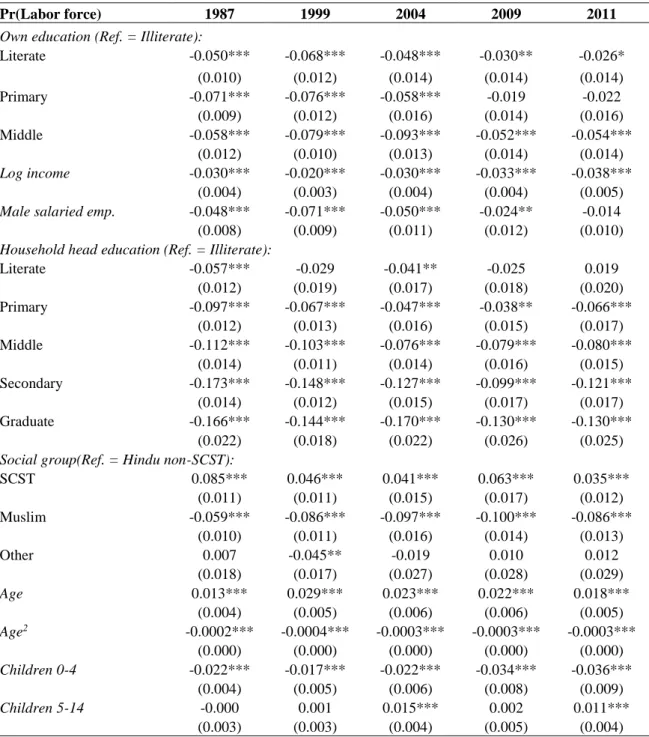
Estimation results are reported in Table 2 as average marginal effects, showing the change in the probability of being in the labor force associated with a unit change in the explanatory variable (for categorical variables this is the difference with the reference category). First of all, the U-shape in education appears even stronger in the marginal effects than in the average unconditional participation rates in Figure 2. Even conditional on variables that could have explained the unconditional U, such as partner’s income and education, caste, or religion, participation declines as education increases up to intermediate levels.
Table 1. Sample Means
1987 1999 2004 2009 2011
Labor force 0.18 0.18 0.20 0.17 0.18
Illiterate 0.42 0.32 0.28 0.23 0.22
Literate 0.11 0.08 0.07 0.07 0.07
Primary 0.15 0.12 0.13 0.12 0.11
Middle 0.11 0.14 0.16 0.15 0.15
Secondary 0.14 0.20 0.22 0.26 0.27
Graduate 0.07 0.13 0.14 0.17 0.18
Log income 3.63 3.99 4.08 4.36 4.47
Salaried employment 0.52 0.48 0.46 0.46 0.46
Hh head Illiterate 0.21 0.18 0.16 0.15 0.14
Hh head Literate < prim. 0.14 0.10 0.10 0.08 0.08
Hh head Primary 0.17 0.12 0.13 0.11 0.11
Hh head Middle 0.14 0.15 0.16 0.15 0.16
Hh head Secondary 0.22 0.26 0.28 0.30 0.29
Hh head Graduate 0.13 0.18 0.18 0.21 0.22
Hindu non-SCST 0.66 0.65 0.65 0.66 0.65
SCST 0.14 0.17 0.17 0.16 0.16
Muslim 0.14 0.14 0.14 0.14 0.15
Other social group 0.05 0.05 0.05 0.04 0.04
Age 35.6 36.1 36.6 36.7 36.8
Children 0–4 0.69 0.53 0.50 0.42 0.39
Children 5–14 1.59 1.37 1.20 1.05 1.05
Agriculture 0.07 0.06 0.05 0.05 0.05
Construction 0.07 0.10 0.10 0.12 0.12
Manufacturing 0.27 0.23 0.24 0.22 0.23
White-collar services 0.20 0.18 0.18 0.19 0.19
Other services 0.38 0.43 0.43 0.41 0.41
20
Graduate share 0.11 0.16 0.17 0.21 0.22
N 29031 32541 29513 27198 27306
Note: Averages for married women age 25–54, calculated using sampling weights.
Source: NSS Employment and Unemployment Survey
A remaining channel—one not captured in control variables—is through social stigma. It is possible that the stigma associated with low-skilled jobs (including in agriculture, menial jobs in manufacturing and construction, or in domestic services) increases as women attain low and intermediate levels of education. This means education is associated with an increased (fixed) utility cost of engaging in low-skilled work. This channel can also explain the upward sloping part of the education U-curve: once women attain secondary or post-secondary education, the utility cost disappears as they gain access to white-collar jobs that are not subject to social stigma. In all, the education U-curve conditional on income, social status, and the sectoral structure of employment (which we further discuss below) can be explained by social stigma associated with different types of jobs.
In addition, the positive effects of higher education could reflect higher wages or positive selection effects. As we find very similar estimates when controlling for the own wage, we think the own wage channel does not play an important role, despite high returns to education in the labor market. On the other hand, it is quite plausible that the positive higher education effect partly reflects an upward bias due to endogenous selection into higher education of girls with stronger labor market orientation. This would not only bias upwards the effects of higher education, but is also consistent with the large decline in the positive effects of secondary and graduate education over time. If increasing educational attainment has been driven by the growing supply of education, for example, highly educated women in 1987 were more positively selected than those in 2011.
We cannot test this directly without modeling educational attainment itself, which is beyond the
21
scope of this paper, but we provide suggestive evidence for a decline in positive selection in Section V.
Moving down in Table 2, we find a negative income effect as expected. Security of income (male salaried employment) also reduces women’s labor force participation, and we find a particularly strong negative effect of education of the household head. The size of the effects declines over time, suggesting that women have become less responsive to income insecurity and to overall socioeconomic status of the household. Household head education effects remain, however, quantitatively large.
Table 2. Estimation Results (Average Marginal Effects)
Pr (Labor force) 1987 1999 2004 2009 2011
Own education (Ref. = Illiterate):
Literate -0.050*** -0.063*** -0.051*** -0.030** -0.026*
(0.009) (0.011) (0.013) (0.014) (0.014)
Primary -0.072*** -0.074*** -0.062*** -0.025** -0.027*
(0.008) (0.011) (0.015) (0.012) (0.014)
Middle -0.067*** -0.084*** -0.100*** -0.060*** -0.064***
(0.011) (0.009) (0.013) (0.013) (0.011)
Secondary 0.086*** -0.020* -0.048*** -0.056*** -0.041***
(0.013) (0.010) (0.014) (0.014) (0.014)
Graduate 0.324*** 0.217*** 0.144*** 0.131*** 0.151***
(0.020) (0.018) (0.023) (0.019) (0.022)
Log income -0.034*** -0.017*** -0.032*** -0.028*** -0.022***
(0.003) (0.003) (0.003) (0.003) (0.003)
Male salaried emp. -0.022*** -0.032*** -0.019** 0.002 -0.005
(0.007) (0.008) (0.009) (0.009) (0.010)
Household head education (Ref. = Illiterate):
Literate -0.067*** -0.045** -0.040** -0.025 0.017
(0.012) (0.020) (0.017) (0.018) (0.019)
Primary -0.107*** -0.078*** -0.053*** -0.035** -0.057***
(0.012) (0.012) (0.015) (0.014) (0.018)
Middle -0.126*** -0.115*** -0.078*** -0.072*** -0.083***
(0.013) (0.011) (0.014) (0.014) (0.015)
Secondary -0.170*** -0.150*** -0.121*** -0.095*** -0.103***
(0.013) (0.013) (0.014) (0.015) (0.015)
Graduate -0.166*** -0.154*** -0.110*** -0.084*** -0.126***
(0.016) (0.014) (0.018) (0.017) (0.019)
Social group (Ref. = Hindu non-SCST):
SCST 0.089*** 0.054*** 0.036*** 0.059*** 0.033***
22
(0.010) (0.011) (0.013) (0.014) (0.009)
Muslim -0.058*** -0.069*** -0.086*** -0.087*** -0.082***
(0.010) (0.010) (0.014) (0.012) (0.011)
Other 0.021 0.013 0.004 0.022 0.039**
(0.015) (0.017) (0.013) (0.015) (0.018)
Age 0.020*** 0.026*** 0.027*** 0.016*** 0.014***
(0.004) (0.004) (0.005) (0.005) (0.004)
Age2 -0.0003*** -0.0003*** -0.0004*** -0.0002*** -0.0002***
(0.000) (0.000) (0.000) (0.000) (0.000)
Continues on next page.
Table 2 continued
Pr (Labor force) 1987 1999 2004 2009 2011
Children 0–4 -0.022*** -0.018*** -0.024*** -0.036*** -0.039***
(0.004) (0.004) (0.005) (0.007) (0.008)
Children 5–14 -0.005** -0.001 0.008** -0.003 0.007*
(0.003) (0.002) (0.004) (0.004) (0.004)
District male employment shares (Ref. = construction):
Agriculture 0.255* 0.171* 0.165 -0.008 0.220**
(0.132) (0.097) (0.116) (0.108) (0.096)
Manufacturing 0.073 -0.097 -0.039 0.155* 0.268***
(0.118) (0.087) (0.099) (0.091) (0.077)
Services -0.048 -0.090 -0.015 0.120 0.014
(0.121) (0.084) (0.093) (0.088) (0.073)
White-collar serv. -0.036 -0.022 -0.086 0.170 0.052
(0.124) (0.099) (0.120) (0.106) (0.100)
District grad. share 0.004 -0.087 0.017 -0.402*** -0.051
(0.111) (0.083) (0.105) (0.091) (0.082)
N 29031 32541 29513 27198 27306
Pseudo R2 0.145 0.126 0.125 0.114 0.097
FLFP rate 0.185 0.179 0.203 0.174 0.179
Note: Married women age 25–54. All estimations include state fixed effects. District-clustered standard errors in parentheses, *** p < .01, ** p < .05, * p < .10.
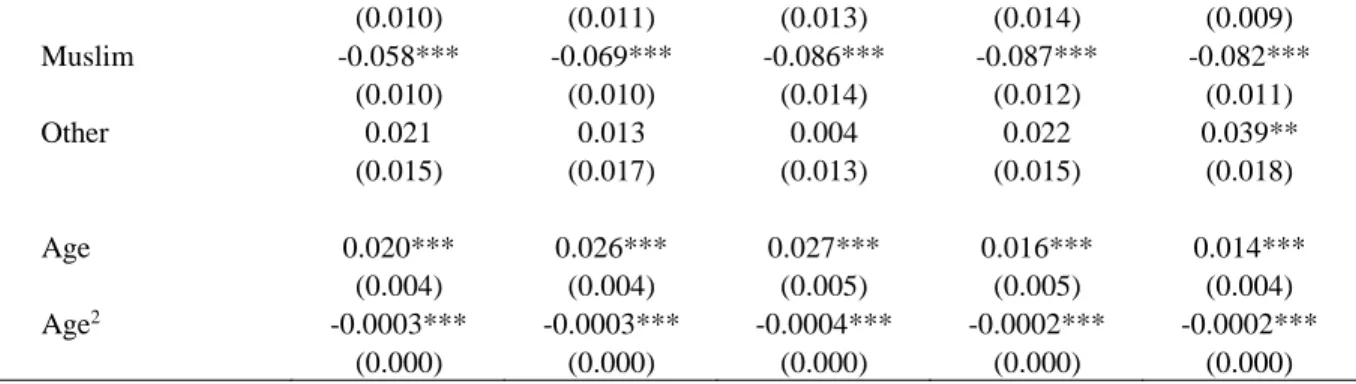
Looking at the social group variables, we find that women in SCST households are most likely to work, but the gap between SCST and non-SCST Hindus declined.17 The impact of religion
17 From 1999 onwards, the NSS data also distinguish Other Backward Class (OBC) households. Including a separate category for OBC—rather than including them in the reference non-SCST group—we find that OBC women have higher FLFP than high caste Hindus in 1999 and 2004, but there is no difference in 2009 and 2011. The estimated gap between SCST and high caste Hindus is somewhat larger but still declines over time.
23
appears stronger, with Muslim women 6 to almost 9 percentage points less likely to work than non- SCST Hindus; a difference close to half the female labor force participation rate.
Women’s age and the presence of children in the household have the expected effects.
Participation first increases and then declines with age. We see that the age profile shifted somewhat after 2004, reducing the peak age from around 40 in 1987–2004 to around 35 years in 2011. At the same time, the negative effect of young children almost doubled in magnitude. Though the estimates cannot be interpreted as causal due to joint fertility and participation decisions, we clearly see an increasing negative association between women working and the presence of young children in the household.
The bottom of the table shows the estimated effects of district demand and supply variables.18 We do not find that local supply of high-skilled workers affects FLFP much, except for a strong negative effect in 2009. This could reflect the impact of the global financial crisis, which led to substantial declines in employment (see for example Kucera et al., 2012). Regarding the sectoral structure of employment, in 1987 and 1999 FLFP was highest in districts where agriculture makes up a higher share of urban employment suggesting that agricultural activities in and at the fringes of cities generate higher employment opportunities for women. Manufacturing has started drawing in more women since 2009. Surprisingly, the employment shares of white-collar services and other services are not significantly positively related to FLFP.
Subsample estimates (reported in Tables A1.3 and A1.4 in the appendix) shed more light on this. In the low-education sample, we see the strong association of FLFP with agricultural employment in the early years and again in 2011. This same pattern is not present for highly educated women. The negative effect of high-skilled labor supply is much stronger in the high-
18 If we replace the district-level variables and state fixed effects by district fixed effects, results are virtually unchanged. These results are available on request.
24
education sample, where it remains significantly negative (though smaller in magnitude) in 2011.
We also find a positive effect of white-collar services in the high-education sample, but it is significant only in 2009. It appears that 2009 was characterized by fiercer competition for skilled jobs, and only districts with a large share of employment in white-collar services could keep highly educated women in the labor force. By 2011, the crowding out effect is weaker and at the same time, highly educated women are shifting more toward the manufacturing sector, similar to the low-education sample.
There are other important differences between the two education groups. First of all, the negative income effect in the high-education sample halves between 1987 and 2009 and disappears in 2011, as opposed to a slight increase in the low-education sample. Second, education of the household head has a strong negative effect in the low-education sample, but no effect on highly educated women in any of the years. Third, male salaried employment—our proxy for income security—is associated with lower labor force participation of women with low education, while the opposite is found for highly educated women (though for both subsamples, the effect declines in magnitude and is no longer statistically significant in 2011). These results suggest that highly educated women are less constrained by family circumstances in their labor force participation decision, while women with less than secondary education appear to be boxed in by necessity to work if household incomes are very low or insecure, and stigmas attached to working if they have some education and are in more secure economic environments. The finding that manufacturing employment is nowadays associated with higher FLFP is an indication that manufacturing jobs are becoming less stigmatized.
Regarding changes in participation rates over time, it follows from the probit estimates that the increase in women’s educational attainment and fertility decline should have translated into higher labor force participation. Working in the opposite direction, however, is the increase in educational