Nitrogen dynamic in Eurasian coastal Arctic ecosystem: Insight from nitrogen isotope
Benoit Thibodeau1,2,3 , Dorothea Bauch2, and Maren Voss4
1Academy of Science, Humanities and Literature, Mainz, Germany,2GEOMAR, Helmholtz Centre for Ocean Research, Kiel, Germany,3Now at Department of Earth Sciences and Swire Institute of Marine Science, University of Hong Kong, Hong Kong,4Leibniz Institute for Baltic Sea Research, Rostock, Germany
Abstract
Primary productivity is limited by the availability of nitrogen (N) in most of the coastal Arctic, as a large portion of N is released by the spring freshet and completely consumed during the following summer.Thus, understanding the fate of riverine nitrogen is critical to identify the link between dissolved nitrogen dynamic and coastal primary productivity to foresee upcoming changes in the Arctic seas, such as increase riverine discharge and permafrost thaw. Here we provide afield-based study of nitrogen dynamic over the Laptev Sea shelf based on isotope geochemistry. We demonstrate that while most of the nitrate found under the surface freshwater layer is of remineralized origin, some of the nitrate originates from atmospheric input and was probably transported at depth by the mixing of brine-enriched denser water during sea ice formation. Moreover, our results suggest that riverine dissolved organic nitrogen (DON) represents up to 6 times the total riverine release of nitrate and that about 62 to 76% of the DON is removed within the shelf waters. This is a crucial information regarding the near-future impact of climate change on primary productivity in the Eurasian coastal Arctic.
Plain Language Summary
Climate change will enhance the release of organic nitrogen to the Arctic via increased river runoff and permafrost thawing. Here we show that more than half of this nitrogen can be used directly, or after recycling, by marine organisms and thus should be taken into consideration when investigating the global primary productivity of the Arctic coastal ecosystem.1. Introduction
The Arctic and the high latitudes underwent dramatic change over the past decades. In fact, the 20th century has been the warmest in the Arctic for at least the past 44,000 years [Miller et al., 2013]. Observed changes notably include increased discharge from the Eurasian rivers, permafrost thaw, and decline of snow cover and sea ice extent [Peterson et al., 2002; Macdonald et al., 2005]. Permafrost thaw and enhanced river discharge represent a direct increase in the input of nutrients [Treat et al., 2016]. The effect of increased delivery of nitrogen (N), phosphorous, and other nutrients by river runoff and permafrost thaw in the Arctic marine system is still unresolved because there are still major gaps in our knowledge regarding the fate of those nutrients on Arctic shelves [Tank et al., 2012;Le Fouest et al., 2013;Torres-Valdes et al., 2016]. It has been recently suggested fromflux estimations that riverine nitrate would contribute only to a small amount of the total Arctic Ocean productivity (<10%) and that a similar number could be attributed to dissolved organic nitrogen (DON) regeneration and assimilation in nearshore regions, notably in the Laptev Sea [Tank et al., 2012;Le Fouest et al., 2013, 2015]. However, our knowledge of the actual transformation processes controlling the nitrogen dynamic is limited [Torres-Valdes et al., 2013], and thus, is it hard to accurately predict the fate of Arctic riverine nitrogen in a warming world.
The Siberian part of the Arctic Ocean (0–180°E) is characterized by an inflow of marine water from the Atlantic via the Norwegian Sea. Over the Siberian shelves the circulation is generally cyclonic, from the east over the Barents Sea shelf, passing into the Kara Sea [Macdonald et al., 2004;Aksenov et al., 2011], eventually reaching the Laptev and East Siberian Seas where it meets inflowing waters from the Pacific Ocean [Jones et al., 1998].
The Laptev Sea thus receives surface waters from the West (Figure 1) that are quite depleted with respect to nitrate [Letscher et al., 2013]. Surface waters are indeed nitrate-depleted during summer but Atlantic-derived subsurface water (referred to as modified-Atlantic water) is advected over the Laptev Sea shelf and contains a relatively high concentration of nitrate [Bauch et al., 2014]. Beside the import of modified-Atlantic water, the hydrography of the Laptev Sea is impacted by the 530 to 581 km3of freshwater runoff from the Lena River
Global Biogeochemical Cycles
RESEARCH ARTICLE
10.1002/2016GB005593
Key Points:
•Sixty two to 76% of the riverine dissolved organic nitrogen is removed over the Laptev Sea shelf
•The variation in DON isotopic signature suggests the presence of removal processes inducing isotopic fractionation (e.g., assimilation)
•We highlighted the presence of atmospheric nitrate at depth, probably transported during winter mixing and/or brine formation
Supporting Information:
•Supporting Information S1
•Data Set S1
Correspondence to:
B. Thibodeau, bthib@hku.hk
Citation:
Thibodeau, B., D. Bauch, and M. Voss (2017), Nitrogen dynamic in Eurasian coastal Arctic ecosystem: Insight from nitrogen isotope,Global Biogeochem.
Cycles,31, 836–849, doi:10.1002/
2016GB005593.
Received 29 NOV 2016 Accepted 20 APR 2017
Accepted article online 24 APR 2017 Published online 13 MAY 2017
©2017. American Geophysical Union.
All Rights Reserved.
each year, mostly during spring [Le Fouest et al., 2013]. The fate of the Lena freshwater plume during the following summer is controlled by atmospheric forcing: the freshwater is directly pushed northward during offshore years, while the plume is constrained on the shelf and pushed toward the East Siberian Sea during onshore years [Dmitrenko et al., 2005; Bauch et al., 2011a; Thibodeau et al., 2014]. This freshwater discharge carries 15 to 24 × 109g N in the form of nitrate but also between 80 and 245 × 109g N of DON [Dittmar and Kattner, 2003;Le Fouest et al., 2013]. While the mean riverine nitrate contribution to ocean primary production is generally low in the Arctic with about 5% in the Laptev Sea [Le Fouest et al., 2013], Figure 1.Major currents driving the surface circulation of the Laptev Sea. The red color represents the Atlantic-derived waterflowing along the continental slope and branching onto the shelf (referred here as modified-Atlantic water), the light blue color represents the freshwater discharge (from Lena and Khatanga River), and the green color represents the water originating from the Kara Sea. (bottom) The structure of the water column based on water mass fraction (% of river water) calculated from salinity andδ18O of the water in a 60 m deep cross section sampled at 131°E (dashed black line on the main panel).
rapid uptake of dissolved inorganic nitrogen (DIN) coupled with relatively high rates of DON regeneration in N-limited nearshore regions could potentially lead to high rates of localized riverine-supported photo- synthesis [Tank et al., 2012]. Consequently, there are still multiple questions related to the importance and the mechanisms controlling DON-based primary productivity. Interestingly, recent pan-Arctic modeling efforts suggest that removal of riverine DON by bacterioplankton and summertime primary productivity fueled by recycled ammonium increased by 26 and 18%, respectively, over the last two decades [Le Fouest et al., 2015]. We therefore used, for thefirst time,field measurement of multiple stable isotopes to investigate the sources (Atlantic-derived versus Lena River) of DIN and DON and their respective cycling (denitrification, assimilation, nitrification) within the Laptev Sea shelf.
Nitrate N isotopes (δ15NN) and O isotopes (δ18ON) can serve as tracers to distinguish nitrate sources or inves- tigate the importance of N-cycling processes such as denitrification, assimilation, or nitrification. The dual isotope approach is based on the fact that nitrate from different origins has distinct isotopic signature ranges [Kendall et al., 2008]. The isotopic composition of Laptev Sea nitrate, for example, may reflect terrestrial and marine sources. Moreover, it may also depend on isotopic fractionation during local biological processes.
Thus, dual isotopic analysis of nitrate coupled with other environmental data as the δ18O of the water (δ18Ow) is used to identify simultaneous processes such as (1) N removal by denitrification, (2) N assimilation by phytoplankton, (3) recycling via nitrification, and (4) input from multiple external sources. Moreover, recent developments allow the measurement ofδ15N values in DON (δ15NDON) in seawater [Knapp et al., 2005;Thibodeau et al., 2013a]. This technique is very useful in water depleted with respect to nitrate and elevated in DON as it is the case for the surface water of the Laptev Sea in summer and may allow for the identification of DON sources.
In this study, we used dual isotope data of nitrate to identify the different sources of nitrogen and, in conjunc- tion with water isotopes, look for the presence of denitrification, assimilation, and nitrification over the Laptev Sea shelf. We then used thefirst Arcticδ15NDONdata to trace the origin of the DON found within the Laptev Sea shelf and identify which active processes control the DON dynamic over the Laptev Sea shelf.
2. Methods
2.1. Sampling
Samples were taken in September 2014 with a Seabird conductivity-temperature-depth rosette with water bottles. Bottle salinity was determined from the same water samples taken for δ18O analysis using an AutoSal 8400A salinometer(Fa. Guildline) with a precision of ±0.003 and an accuracy of at least ±0.005.
Water samples for isotope measurements in nitrate and DON were taken from GF/F filtered (0.45 μm, precombusted at 450°C for 2 h) seawater in separate acid-cleaned vials. Nitrite was removed according to Granger and Sigman[2009] to ensure no interference with the isotope signature of trace amounts of nitrite.
Samples were immediately frozen on board at20°C.
2.2. Nitrate and Dissolved Organic Nitrogen Measurement
Samples were unfrozen in the laboratory, and 10 mL was used to measure nitrate using a QuAAtrop from SEAL analytical. Then, 40 mL of sample was transferred to clean 60 mL Teflon tubes (3 h at 200°C). Then we added 10 mL of persufate oxidizing reagent (POR) prepared the same day (25 g K2S2O3(Merck 1.05092 N-poor), 7.5 g NaOH, and 15 g H3BO3dissolved in 500 mL MilliQ). Samples and POR are then gently mixed and put in the microwave digestion system (Mars Express, CEM coorp.) which can take up to 40 samples at a time. Along with the samples, four blanks and 12 standards were digested for at least 2 h at 180°C. After the samples, blanks, and standards were cooled down to room temperature, total nitrate concentration in the solution was determined with the spongy cadmium method [Jones, 1984]. Only samples were taken where recovery rates of the standards of the same run were between 95 and 105%. The DON concentra- tion was estimated after subtracting the NO3 concentrations. It is noteworthy that our DON actually includes DON + NH4+; however, NH4+levels were found to be constantly much lower than nitrate, thus negligible, even in the river-influenced part of the Laptev Sea [Nitishinsky et al., 2007]. Moreover, all our DON measurements were performed from surface samples where nitrate was depleted by biological assimilation, suggesting that NH4+was most probably also depleted as it is extremely bioavailable and short-lived in nutrient-depleted environment [McCarthy and Goldman, 1979;Dortch, 1990].
2.3. Stable Isotope Measurements Theδ15N-NO3andδ18O-NO3were measured for all samples with nitrate concentration>1μmol L1accord- ing to the denitrifier method [Sigman et al., 2001;Casciotti et al., 2002a]. Briefly, nitrate is microbially converted to nitrous oxide (N2O) and the resulting N2O gas measured using a gas bench connected to a CF-IRMS system (Delta V advantage, Thermo). The method makes use of the N2O-reductase-deficient bacterial strainPseudomonas aureofaciens (ATTC 13985) orchlororaphis(ATTC#43928), which quantitatively convert NO3and NO2to N2O. For the analysis ofδ15N from the total nitrogen samples (where nitrate concentration<1μmol L1) the strainP.
chlororaphiswas used since only N isotopes are measured. The sample volume was always adjusted to obtain afinal N2O concentration of 10 nmol in the sample. Two standards were used: U.S. Geological Survey (USGS) 34 (δ15N = 1.8‰ versus atmospheric N2 and δ18O = 27.9‰ versus Vienna SMOW (VSMOW)) and International Atomic Energy Agency (IAEA)-N3 (δ15N = 4.7‰versus atmospheric N2andδ18O = 25.9‰versus VSMOW) [Böhlke et al., 2003;McIlvin and Casciotti, 2011]. Isotope values were corrected followingSigman et al.
[2009]. The analytical precision was ±0.2‰for both theδ15NNandδ18ONvalues based on>30 measure- ments of international standard (USGS-34 and IAEA-N3) done on multiple different days. The δ15NDON analytical precision based on standard error of 15 different samples analyzed in duplicate or triplicate was better than ±0.35‰14 times out of 15 with an average of ±0.2‰. Oxygen isotope of the water (δ18O) was analyzed using the classical CO2-water equilibration method [Epstein and Mayeda, 1953]. The overall measurement precision for allδ18O analysis was ±0.04‰or better. The18O/16O ratio is given in respect to VSMOW in theδnotation [Craig, 1961].
2.4. Mass-Balance Equation to Estimate the Fraction of River Water
The freshwater contribution to each sample can be quantified by using a mass balance calculation based on three end-members [Bauch et al., 1995]. We assumed that each sample is a mixture between marine water (fmar), river runoff (friv), and sea ice meltwater (fsim). From this we can adopt the following equations
fmarþfrivþfsim¼1
fmarSmarþfrivSrivþfsimSsim¼Smeasured fmarOmarþfrivOrivþfsimOsim¼Omeasured
wherefmar,friv,andfsimare the fraction of each end-member in a water parcel andSmar,Sriv,Ssim,Omar,Oriv, andOsimare the corresponding salinities andδ18O values of the end-members;SmeasuredandOmeasuredare the salinities andδ18O values of the water samples [Bauch et al., 2005]. Respective end-membersSandO values (Table 1) were chosen accordingly to study conducted in the Laptev Sea [Bauch et al., 1995, 2010, 2011b, 2014;Thibodeau and Bauch, 2016]. The analytical errors estimated fromδ18O and salinity measure- ments add up to ±0.3% of each fraction (fmar,friv, andfsim) to which should be added an additional systematic error related to the exact choice of end-member within the uncertainties (Table 1). The systematic error is estimated to be up to 1% in all fraction, but relative results are always conserved even considering extreme variations in end-member values [Bauch et al., 2012].
2.5. Rayleigh Equations-Based Model
We build a relatively simple “boxes-and-fluxes”model using Stella® Architect software (V1.2) based on Rayleigh equations (Figure S1 and Text S1 in the supporting information). This model was used to test different hypothesis regarding potential routes of DON uptake. Briefly, the model calculates the isotopic fractionation linked to DON uptake via photoammonification, bacterial degradation (ammonification), and direct uptake by phytoplankton (via peptide hydrolysis). For each reaction, the model computes the following:
1. the evolution of the accumulated product
Table 1. End-Member Values for Mass Balance Calculationsa
End-Member Salinity δ18O
Marine 34.92(5) 0.3(1)
River 0 20(1)
Sea Ice 4(1) surface + 2.6(1) or7 + 2.6(1)
aNumbers in parentheses are the estimated uncertainties within the last digit of each end-member value.
δpacc¼δsiniþε lnð Þƒƒ=ð1ƒÞ
2. the evolution of the substrate pool
δst¼δsiniε lnð Þƒ
whereδpacc,δsini, andδstare respectively the isotope composition of the accumulated product, the initial substrate, and the substrate at time t. Parameterƒrepresent the fraction of the substrate pool remaining, andεis the enrichment factor (in per mil).
3. Results
3.1. Water Mass Distribution
The main hydrographic feature of the Laptev Sea is the large freshwater input from the Lena River, which is clearly defined by the increasing trend for salinity andδ18Owand decreasing percentages calculated for the river water seaward from the mouth of the Lena (Figures 1 and 2). The fresh and relatively warm surface layer sits on top of a strong pycnocline that separates it from the cold salty water that is advected on the shelf (Figures 1 and 2). The two water masses are also very different regarding their geochemical composition.
3.2. Nutrient Concentration
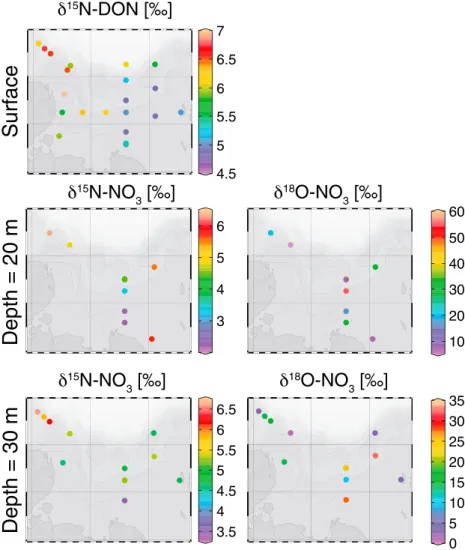
Nitrate was depleted (<1μmol L1) in the Lena-influenced water mass in the top 20 m of the water column (Figure 3). No clear pattern could be discerned apart the slightly higher nitrate concentration near the Lena River ~1μmol L1compared to<0.5μmol L1in the western and northern parts of the shelf. Subsurface (20 to 30 m) nitrate concentration was between 2 and 6μmol L1(Figure 3), again without any strong spatial pattern. Nitrate concentration increased with depth, with the highest value found at 30 m. Phosphate was not depleted, even at the surface, and was characterized by higher value near the Lena River at all depth.
(Figure 3). The N:P ratio was low (<10) at all depth. The surface concentration of dissolved organic nitrogen was found relatively high (up to 10μmol L1) near the river mouth and lower in more marine-dominated water (Figure 3).
3.3. Isotopic Signature of Nitrate and Dissolved Organic Nitrogen
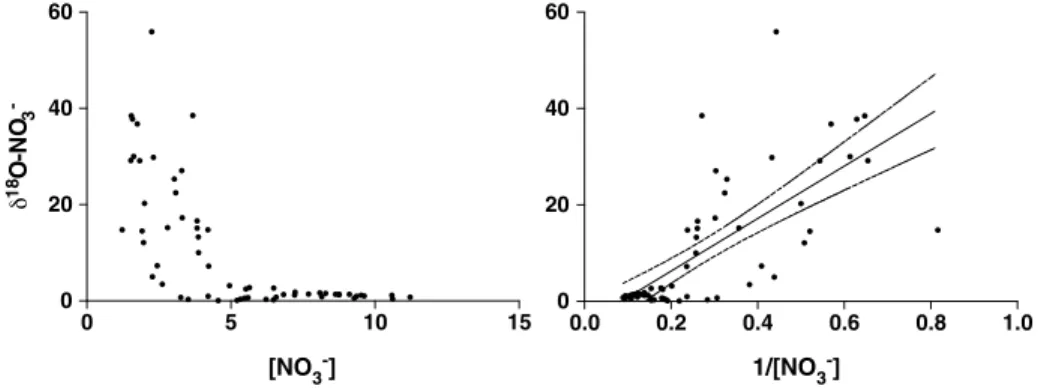
Nitrate isotope measurement was only performed on subsurface samples as nitrate was below 1μmol L1in the surface water. The subsurface (~30 m) distribution ofδ15NNandδ18ONvalues was surprisingly different with strong heterogeneity in theδ18ON(mean value of 10.4‰with a standard deviation of 13.3) and little variability in theδ15NN(mean value of 4.7‰with a standard deviation of 1.0) (Figure 4). On the other hand, δ15NDONshared a similar pattern than [DON], which follow the distribution in fraction of river water. We found a significant relationship between both the [DON],δ15NDON, and the fraction of river water (Table 2 and Figure 5). Assuming a linear relationship between these variables, we calculated the theoretical values of both marine and freshwater end-members (Table 3). We found no relationship betweenδ15NNand nitrate concentration (Table 2). We found a significant relationship betweenδ18ONandδ18Ow, suggesting the presence of nitrification [Buchwald and Casciotti, 2010], but also betweenδ18ONand [NO3] (Table 2). The shape of the monotonic relationship betweenδ18ONand [NO3] being logarithmic, we comparedδ18ON against 1/[NO3] to decipher if simple mixing of fractionation process was responsible for the relationship (Figure 6). This test suggested that mixing, rather than isotopic fractionation, was responsible for the relation- ship as fractionation would create an inverse exponential relationship rather than a linear one [Kendall et al., 2008]. Moreover, the absence of relationship betweenδ18ONandδ15NNalso argues against fractionation processes affecting both isotopes such was assimilation or denitrification as they would fractionation both isotopes (Table 2).
3.4. Dissolved Organic Nitrogen Model of Isotopic Fractionation
Our simple Rayleigh fractionation-based model computed the evolution of the substrateδ15NDONunder multiple scenarios (model available from http://web.hku.hk/~bthib/gbc_thibodeau_2017.html). Here the
model was used to test the effect of the three major DON removal process active in this region [Le Fouest et al., 2013, 2015]: photo-ammonification, bacterial degradation (ammonifica- tion), and direct uptake by phyto- plankton (via peptide hydrolysis).
Since all three reactions break N bond (reviewed bySipler and Bronk[2015]), we expect them to induce isotopic fractionation and thus isotopically enrich the substrate as its concentra- tion decreases [Knapp et al., 2012].
Our initial scenarios considered the DON riverine pool to be around 40%
labile [Dittmar et al., 2001] which was increased to up to 52% to account for the observed decrease in [DON] in our data set. This labile DON was available for microbial degradation [Jørgensen et al., 1999]
and phytoplankton assimilation [Bronk et al., 2007]. Of the remaining refractory fraction, we considered 16% to be photoammonified (0.60 × 0.16 = 0.096), roughly one quarter of the total labile fraction [Xie et al., 2012]. We report here two scenarios: (1) with the three removal modes active with equal isotopic fractionation and (2) without direct assimilation by phytoplankton (Figure 6a). We refer to these scenarios as the three and two process scenarios, respectively. Both scenarios were run with two different set of initial conditions for the riverine end-member: (1) with the value estimated from the extrapolation of our data set [DON] = 13.9μmol L1andδ15NDON= 2.1‰and (2) with concentration values earlier in the summer (July) [DON] = 21.8μmol L1andδ15NDON= 2.1‰to test the potential aging of the DON (Figure 6b). When run with the extrapolated initial value, the model yields an isotope fractionation factor of 6.5‰when considering three processes and 5.6‰when considering only two processes. When run with the July value the model yields an isotope fractionation factor of 5.2‰when considering three processes and 4.2‰when considering only two processes.
4. Discussion
4.1. Nitrogen Sources in Laptev Sea Shelf Bottom Water
The Laptev Sea summer hydrography is dominated by the massive Lena River plumeflowing seaward at the surface, while the advected modified-Atlantic water is transported over the shelf at depth (Figure 1). The circulation is thus somehow estuarine with a strong pycnocline at around 18 m depth that prevents mixing of the plume waters with the ones below (Figure 1). On the other hand, this feature leads to nitrate depletion within the surface layer, as all nitrate is presumably assimilated by primary producers (Figure 2). Almost all our nitrate-isotope data are from below 20 m depth because nitrate is depleted in surface water; thus, they mostly come from the modified Atlantic water advected on the shelf. Our average isotope value ofδ15NN (4.7 ± 1‰) is within the typical ocean interior range of values (5.0 ± 0.5‰) [Sigman et al., 2000]. This suggest that no detectable isotopic enrichment signal due to the presence of denitrification or N assimilation is recorded in our isotope data from below the surface waters, which is also supported by the lack of a relation- ship between δ15NN and δ18ON values (Table 2). The absence of denitrification in a presumably well-oxygenated water column (>2 mg O2 L1) is not surprising but does not completely rule out the presence of benthic denitrification, which can happen without strong isotopic fractionation as long as the Figure 2.Surface distribution of salinity,δ18O of the water, and the calcu-
lated fraction of river water over the Laptev Sea shelf.
process goes to complete nitrate removal [Lehmann et al., 2007]. Moreover, the absence of assimilation signal is predictable as all surface nitrate is consumed at the end of the summer, but subsurface nitrate concentration is relatively high, suggesting that the subsurface pool of N is not used in situ for assimilation during spring and summer (Figure 2).
The advected water is relatively old and should contain mostly remineralized nitrate and should be charac- terized by fractionation taking place during nitrification. Theδ18ONof nitrified nitrate should be slightly enriched (+2 to +3‰) compared to theδ18Owin which it was nitrified [Casciotti et al., 2002a;Thibodeau et al., 2013b]. Here the averaged δ18Ow is around 2 ± 2.2‰, which would yield a δ18ON of around 1 ± 2.2‰for nitrified nitrate. Indeed, most of the sample carried a relatively lowδ18ON(median = 2.6) that is coherent with a nitrified source of nitrate [Buchwald and Casciotti, 2010]. However, we observed only a rela- tively weak relationship betweenδ18Owandδ18ON(Table 2). The absence of strong relationship implies that while the average is within the expected range of values for nitrified nitrate, the large variability ofδ18ON suggests that the nitrate pool was formed by nitrification at different locations, where theδ18Owwas different as well. This is plausible for a shelf dominated by significant river discharge with aδ18Owvalue of20‰and marine water withδ18Owclose to zero.
4.2. Atmospheric Nitrate at Depth: The Potential Role of Winter Mixing and Brine Formation We observed extremely high values ofδ18ON, reaching almost 60‰(Figure 4), which is usually an indicator of atmospheric nitrate contribution [Kendall et al., 2008]. This is surprising because the surface layer is ~20 m thick and separated by a pronounced thermocline from deeper layers, therefore, the advection of atmospheric nitrate to 70 m depth is difficult to explain. One explanation could be that nitrate was transported from the surface to depth during winter mixing or any other deep mixing event before stratification took place or trans- ported by injection of dense water during sea ice formation in early winter. This would be coherent with the weak but significant relationship (Table 2) between the fraction of brine in a sample and theδ18ON, which sug- gest that brine could have transported nitrate with elevatedδ18ONoriginating from atmospheric deposition.
Thus, this would suggest that climatic teleconnection as the Arctic Oscillation can influence the distribution of atmospheric nitrate, as it controls the fate of brine over the Laptev Sea shelf [Thibodeau and Bauch, 2016]. In conclusion, the isotopic signature of nitrate over the Laptev Sea shelf can be generated by mixing between nitrate regenerated locally, nitrate advected from the Arctic Ocean (regenerated within the Atlantic water), and atmospheric nitrate that is transported into the subsurface layer by sea ice-driven Figure 3.Distribution of nitrate, phosphate, nitrate to phosphate ratio, and dissolved organic nitrogen at the surface, 20 m and 30 m depth over the Laptev Sea shelf.
convection or winter mixing of surface water containing atmospheric nitrate. Thefinding of an atmospheric signature in the nitrate isotope is interesting as it suggests that atmospheric deposition of nitrate should not be ruled out of coastal Arctic N budget, as it may leave its isotopic imprint until the next summer. In order to quantify its relative importance as a source and its potential influence on primary productivity, a sea ice survey to investigate N cycling and regeneration within the sea ice should be carried-out [Fripiat et al., 2014].
4.3. Potential Sources of Riverine DON in the Laptev Sea Shelf
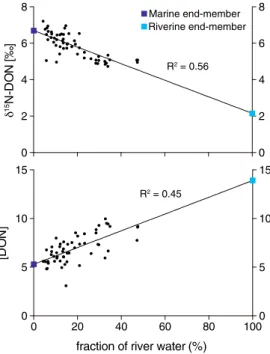
Despite being based on the extrapolation of the relationship between [DON] and the fraction of river water in a sample (Figure 5), our estimation of the end-members [DON] is coherent with previously published values for the waters from the Lena River and below the halocline (Table 3). Previous concentration measurements of Lena River waters were 12.1 ± 2.2μmol L1and for the surface water of the Laptev Sea and the halocline Figure 4.Distribution ofδ15N of dissolved organic nitrogen in the surface water andδ15N andδ18O of nitrate at 20 m and 30 m depth over the Laptev Sea shelf.
Table 2. Spearman’s Correlation Coefficient (Estimated Using Prism 6©) Between the Different Parameters Measureda
ƒr ƒSIM δ18Ow [NO3] δ18ON δ15NN
[DON] 0.66* 0.67* 0.66* 0.28* X X
δ15NDON 0.70* 0.58* 0.70* 0.37* X X
δ18ON 0.52* 0.58* 0.52* 0.71* X 0.14
δ15NN 0.02 0.04 0.02 0.07 0.14 X
aSignificant correlation (<0.05) is marked by an asterisk.
6.2 ± 0.4 and 4.5 ± 0.3μmol L1, respectively [Kattner et al., 1999;Dittmar et al., 2001]. Thus, we are confident that our calculated end-member’s concentrations are robust and can be further used to study sources and sinks of DON within the Laptev Sea shelf. An interesting observation from the relationship between the estimated end-member values is the lowδ15NDONcalculated for the riverine DON end-member. Such a low isotope value suggests a high proportion of nitrogen originating from atmospheric deposition and/or N2fixation. While the presence of aquatic N2fixation in the Russian Arctic is not impossible as suggested by reports of N2fixation by diastrophism in Canadian Arctic [Blais et al., 2012] and subarctic rivers [DeLuca et al., 2013], the most plausible origin for this organic nitrogen is terrestrial N2fixation (~0.5‰) and atmo- spheric deposition (~6.5‰) [Bobbink et al., 2010;Stewart et al., 2011a, 2011b;Lett and Michelsen, 2014;
Skrzypek et al., 2015;Rousk and Michelsen, 2016]. Another potential source of organic nitrogen within Arctic tundra is bird feces, which carries an enriched value of around 8‰[Skrzypek et al., 2015]. Unfortunately, with three potential sources of nitrogen and only one isotope measured it is not possible to precisely quantify the importance of each. Using the Isosource software [Phillips and Gregg, 2003] and the Arctic tundra end-member isotopic value estimated previously [Skrzypek et al., 2015], we calculated that bird feces could represent 44 ± 19% of the organic nitrogen found in the Lena River, with potential contribution from 22 ± 22% for atmospheric deposition and 38 ± 38% for N2fixation. Interestingly, despite the obvious large uncertainties, the proportion are similar to what was observed in Svalbard where 38% of the N was found to be originating from bird feces [Skrzypek et al., 2015]. The potentially higher proportion of N from bird feces in the coastal Laptev Sea might be linked to the unusually high density or birds (245 to 641 birds km2) found in the Lena Delta [Gilg et al., 2000]. Irrespective of the large uncertainties our result highlights the importance of bird-derived N for the Arctic coastal ecosystem.
Figure 5.Dissolved organic nitrogen isotopic composition and concentration (inμmol L1) against the fraction of river water. Both linear regressions (p<0.0001) are used to extrapolate the relationship to estimate the end-members value.
Table 3. Estimated Values of Dissolved Organic Nitrogen Concentration ([DON] inμmol L1) and of Its Isotopic Signature (δ15N in‰) for Each End-Member Based on the Relationship Between the Calculated Fraction of River Water and [DON]
andδ15N, Respectively
Freshwater Marine
δ15N 2.1 6.7
[DON] 13.9 5.3
[DON]a 12.1 ± 2.2 6.2 ± 0.4 and 4.5 ± 0.3
aData fromKattner et al.[1999] andDittmar et al.[2001].
4.4.15N Isotopic Enrichment and Nonconservative Behavior of DON Over the Laptev Sea Shelf While there is a positive significant relationship between the fraction of river water and both the DON concentration and isotopic signature (Figure 5) it does not necessarily imply that the DON distribution is due to a simple mixing between the fresh and seawater end-members. We plotted theδ15NDONagainst the inverse of the DON concentration to highlight the fact that mixing can only explain very few of the δ15NDON data point (Figure 7a). These plots suggest that isotope fractionation is active and affect the Figure 6.Theδ18O of the nitrate against (left) the nitrate concentration and against (right) the inverse nitrate concentra- tion with the linear regression (black line) and its 95% confidence interval (dashed lines).
Figure 7.Dissolved organic nitrogen isotopic composition against the inverse DON concentration (inμmol L1). The mixing between two end-member results in a straight line while fractionation processes yield curved lines in both panel.
(top) Single Rayleigh fractionation process of 3 and 10‰, respectively, is represented by the light and dark green lines.
The red and orange dotted lines represent the results of our model using two or three processes, respectively. (bottom) The same data and mixing line are shown but the riverine end-member [DON] was increased to 21.8μmol L1. The light and dark blue lines represent the results of our model using two or three processes, respectively. The blue boxes denote the end-member values.
δ15NDON. While production of DON through cell lysis or solubilization of organic matter should not be accom- panied by an isotopic effect [Knapp et al., 2011], the release of bioavail- able nitrogen from DON by photoam- monification, peptide hydrolysis, and deamination would induce isotopic fractionation between 3 and 10‰ [O’Leary and Kluetz, 1972; Macko et al., 1986; Bada et al., 1989; Silfer et al., 1992;Knapp et al., 2012]. While all our data are contained by the 3 and 10‰Rayleigh fractionation iso- lines, the model cannot reproduce the exact observed pattern, espe- cially for a group of data points that are more enriched than our model prediction (Figure 7a). This discre- pancy might be explained by the aging of the water mass. In fact, dur- ing spring and early summer (i.e., May to July) the concentration of DON is higher than our end-member reconstruction and is around 22 μmol L1 and can reach up to 30μmol L1 [Le Fouest et al., 2013].
Using the July value, we obtained a pretty good modeled evolution of the isotopic signature of the DON pool (Figure 7b), which suggest that samples thatfit the modeled results from July initial condition (dark and light blue in Figure 7b) would be slightly older (at least 2 months).
If we consider that indeed N removal via photoammonification, microbial degradation, and/or phytoplankton uptake drives the [DON] decrease over the Laptev shelf, it would imply a consumption of about 8.6μmol L1 (from our estimated riverine end-member of 13.9 μmol L1) or 16.5μmol L1(from the July riverine end-member of 21.8μmol L1) of DON to reach the end-member value of 5.3μmol L1. This would indicate that about 62 to 76% of the DON released by the Lena river during spring is removed over the Laptev Sea shelf within couples of months. Thesefindings are coherent with earlier esti- mation based on outer shelf samples where 70% of the terrestrial DON originating from the Arctic rivers was removed before reaching the marine end-member [Letscher et al., 2013].
4.5. Implications for the Coastal Eurasian Arctic N-Budget
All three removal processes considered here (uptake, remineralization, and denitrification) are to ultimately support directly (phytoplankton uptake) or indirectly (food web remineralization) the total pelagic primary production (reviewed bySipler and Bronk[2015]). The importance of the cycling of riverine input of DON for primary productivity over Eurasian Arctic shelves was already suggested by a modeling study that noticed a threefold increase in primary productivity (from 30 to 90 g C m2yr2) when they added DON removal by bacterioplankton and its remineralization within the model [Le Fouest et al., 2015]. It is important to note that the primary productivity data generated after DON removal are in better agreement with satellite-derived
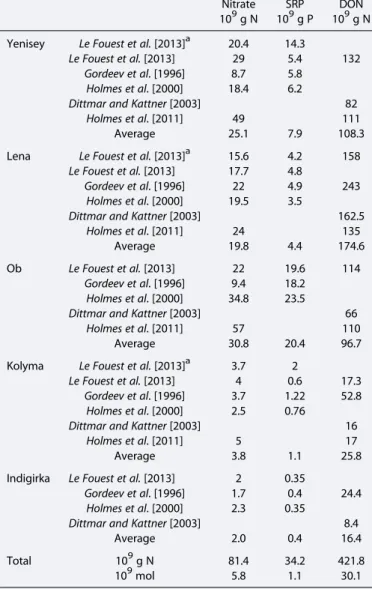
Table 4. Total Input of Nitrate, Soluble Reactive Phosphorus (SRP), and Dissolved Organic Nitrogen (DON) in Major Eurasian Rivers Compiled by Le Fouest et al.[2013]
Nitrate SRP DON
109g N 109g P 109g N Yenisey Le Fouest et al.[2013]a 20.4 14.3
Le Fouest et al.[2013] 29 5.4 132
Gordeev et al. [1996] 8.7 5.8
Holmes et al. [2000] 18.4 6.2
Dittmar and Kattner[2003] 82
Holmes et al. [2011] 49 111
Average 25.1 7.9 108.3
Lena Le Fouest et al.[2013]a 15.6 4.2 158
Le Fouest et al.[2013] 17.7 4.8
Gordeev et al. [1996] 22 4.9 243
Holmes et al. [2000] 19.5 3.5
Dittmar and Kattner[2003] 162.5
Holmes et al. [2011] 24 135
Average 19.8 4.4 174.6
Ob Le Fouest et al.[2013] 22 19.6 114
Gordeev et al. [1996] 9.4 18.2 Holmes et al. [2000] 34.8 23.5
Dittmar and Kattner[2003] 66
Holmes et al. [2011] 57 110
Average 30.8 20.4 96.7
Kolyma Le Fouest et al.[2013]a 3.7 2
Le Fouest et al.[2013] 4 0.6 17.3
Gordeev et al. [1996] 3.7 1.22 52.8
Holmes et al. [2000] 2.5 0.76
Dittmar and Kattner[2003] 16
Holmes et al. [2011] 5 17
Average 3.8 1.1 25.8
Indigirka Le Fouest et al.[2013] 2 0.35
Gordeev et al. [1996] 1.7 0.4 24.4
Holmes et al. [2000] 2.3 0.35
Dittmar and Kattner[2003] 8.4
Average 2.0 0.4 16.4
Total 109g N 81.4 34.2 421.8
109mol 5.8 1.1 30.1
aSee original paper for calculation details.
estimated>100 g C m2yr2[Sakshaug, 2004]. This is caused by the fact that bacterioplankton recycle DON nitrate or ammonium, which can both be used by phytoplankton and bacterioplankton [Le Fouest et al., 2015, and reference theirin]. Moreover, bacterioplankton and phytoplankton can be grazed by mesozooplankton, and thus, DON removal can have a significant effect on coastal primary productivity. However, this model does not seem to allow the direct uptake of DON by phytoplankton, which explain the absence of significant increase in the new primary productivity (<17 to<20 g C m2yr2). Unfortunately, we also cannot clearly distinguish the relative importance of the different potential removal processes with our data set because of the overlap of the potential isotopic effect. Our data set can be explained with the presence of direct DON uptake by phytoplankton or without (Figure 6). Despite this uncertainty, ourfield data and our model suggest the presence of processes that removed 62 to 76% of the total riverine DON input and created an isotopic enrichment in the residual DON pool (Figure 7). Our estimation of riverine DON removed is>50%
higher than the sum of the 8 to 19% available to bacterioplankton estimated previously for the Eurasian Rivers [Wickland et al., 2012;Le Fouest et al., 2015] and the 16% removed by photo-ammonification [Xie et al., 2012]. This is important to better understand the biogeochemistry of Eurasian Arctic shelves as the Lena discharge about 175 × 109g N of DON (Table 4), compared to 20 × 109g N in the form of nitrate each year (Table 4). This almost ninefold difference is the largest when considering all Eurasian major rivers as the total release of DON add to ~420 × 109g N, while nitrate add up to ~80 × 109g N, afivefold difference.
Considering previous estimation of removable DON (24 to 35%) we calculated that about 5 to 7.4 × 10⁹mol N of DON released in summer (70% of total DON) is either transformed by photoammonification or assimilated by bacterioplankton or phytoplankton over all Eurasian shelves. However, from our result (62 to 76%) this estimation now ranges from 13 to 16 × 109mol N of DON, which is up to 3 times the value of river nitrate (5.8 × 10⁹mol N of DON). However, it is important to note that even when considering our suggested high proportion of bioavailable DON for all Eurasian major rivers, the Arctic coastal ecosystem would still be N limited as it would consume an extra 0.4 to 0.8 × 10⁹mol P (assuming a 14:1 ratio), which would leave the Arctic Ocean with a positive P balance of over 8.5 × 10⁹mol P [Le Fouest et al., 2013]. Even when considering a potential increase in 50% river input of DON, the Eurasian shelves will remain N limited. Thus, our results highlight the need to better understand the exact dynamic of DON recycling over the Arctic shelves if we are to improve our capacity to foresee potential change in Arctic coastal primary productivity and what will be the direct impact of increased nutrient load via river discharge and permafrost thaw. As nutrient dynamic can differ between Arctic shelves [e.g.,Carmack and Wassman, 2006] we recommend this method to be tested at other locations in the Arctic.
References
Aksenov, Y., V. V. Ivanov, A. J. G. Nurser, S. Bacon, I. V. Polyakov, A. C. Coward, A. C. Naveira-Garabato, and A. Beszczynska-Moeller (2011), The Arctic Circumpolar Boundary Current,J. Geophys. Res.,116, C09017, doi:10.1029/2010JC006637.
Bada, J. L., M. J. Schoeninger, and A. Schimmelmann (1989), Isotopic fractionation during peptide bond hydrolysis,Geochim. Cosmochim.
Acta,53(12), 3337–3341, doi:10.1016/0016-7037(89)90114-2.
Bauch, D., P. Schlosser, and R. D. Fairbanks (1995), Freshwater balance and the sources of deep and bottom waters in the Arctic Ocean inferred from the distribution of H2
18O,Prog. Oceanogr.,35, 53–80.
Bauch, D., H. Erlenkeuser, and N. Andersen (2005), Water mass processes on Arctic shelves as revealed from18O of H2O,Global Planet.
Change,48(1–3), 165–174, doi:10.1016/j.gloplacha.2004.12.011.
Bauch, D., J. Hölemann, S. Willmes, M. Gröger, A. Novikhin, A. Nikulina, H. Kassens, and L. Timokhov (2010), Changes in distribution of brine waters on the Laptev Sea shelf in 2007,J. Geophys. Res.,115, C11008, doi:10.1029/2010JC006249.
Bauch, D., M. Gröger, I. Dmitrenko, J. Hölemann, S. Kirillov, A. Mackensen, E. Taldenkova, and N. Andersen (2011a), Atmospheric controlled freshwater release at the Laptev Sea continental margin,Polar Res.,30, 1–14, doi:10.3402/polar.v30i0.5858.
Bauch, D., M. R. van der Loeff, N. Andersen, S. Torres-Valdes, K. Bakker, and E. P. Abrahamsen (2011b), Origin of freshwater and polynya water in the Arctic Ocean halocline in summer 2007,Prog. Oceanogr.,91(4), 482–495, doi:10.1016/j.pocean.2011.07.017.
Bauch, D., J. A. Hölemann, I. A. Dmitrenko, M. A. Janout, A. Nikulina, S. A. Kirillov, T. Krumpen, H. Kassens, and L. Timokhov (2012), Impact of Siberian coastal polynyas on shelf-derived Arctic Ocean halocline waters,J. Geophys. Res.,117, C00G12, doi:10.1029/2011JC007282.
Bauch, D., S. Torres-Valdes, I. Polyakov, A. Novikhin, I. Dmitrenko, J. McKay, and A. Mix (2014), Halocline water modification and along-slope advection at the Laptev Sea continental margin,Ocean Sci.,10(1), 141–154, doi:10.5194/os-10-141-2014.
Blais, M., J. É. Tremblay, A. D. Jungblut, J. Gagnon, J. Martin, M. Thaler, and C. Lovejoy (2012), Nitrogenfixation and identification of potential diazotrophs in the Canadian Arctic,Global Biogeochem. Cycles,26, GB3022, doi:10.1029/2011GB004096.
Bobbink, R., et al. (2010), Global assessment of nitrogen deposition effects on terrestrial plant diversity: A synthesis,Ecol. Appl.,20(1), 30–59, doi:10.1890/08-1140.1.
Böhlke, J. K., S. J. Mroczkowski, and T. B. Coplen (2003), Oxygen isotopes in nitrate: New reference materials for 18O:17O:16O measurements and observations on nitrate-water equilibration,Rapid Commun. Mass Spectrom.,17(16), 1835–1846, doi:10.1002/rcm.1123.
Bronk, D. A., J. H. See, P. Bradley, and L. Killberg (2007), DON as a source of bioavailable nitrogen for phytoplankton,Biogeosciences,4(3), 283–296.
Acknowledgments
This work was part of the German- Russian CooperationSystem Laptev Sea funded by BMBF (03G0639D) as well as by Roshydromet and the Russian Ministry of Education and Science. Part of this project was funded by DFG through individual research grant awarded to B.T. (TH1933/1-1). We are grateful to H. Kassens and L. Timokhov for the coordination of this project and the samples transportation. D.B.
acknowledges support from DFG (BA1689/2-1). We thank the captains and crews of R/VViktor Buynitskiy. We are grateful to M. Lohmann (GEOMAR) for the nutrient concentration mea- surements, I. Liskow (IOW) for the dis- solved organic nitrogen and nitrate isotopes measurements, and J. McKay (Oregon State University) for theδ18Ow
measurements. Figures 1–4 were made using ODV [Schlitzer, 2002]. We also acknowledge the very constructive comments of two anonymous reviewers that improved the manuscript. B.T.
designed the research with support from M.V. and D.B. D.B. performed sam- pling. B.T. performed subsampling. B.T.
wrote the manuscript and created the figures with support from M.V. and D.B.
Buchwald, C., and K. L. Casciotti (2010), Oxygen isotopic fractionation and exchange during bacterial nitrite oxidation,Limnol. Oceanogr., 55(3), 1064–1074, doi:10.4319/lo.2010.55.3.1064.
Carmack, E. C., and P. Wassmann (2006), Food-webs and physical biological coupling on pan-arctic shelves: Perspectives, unifying concepts and future research,Prog. Oceanogr.,71, 446–477.
Casciotti, K. L., D. M. Sigman, M. G. Hastings, J. K. Böhlke, and A. Hilkert (2002a), Measurement of the oxygen isotopic composition of nitrate in seawater and freshwater using the denitrifier method,Anal. Chem.,74(19), 4905–4912, doi:10.1021/ac020113w.
Craig, H. (1961), Standard for reporting concentrations of deuterium and oxygen-18 in natural waters,Science,133(3467), 1833–1834, doi:10.1126/science.133.3467.1833.
DeLuca, T. H., O. Zackrisson, I. Bergman, B. Díez, and B. Bergman (2013), Diazotrophy in alluvial meadows of subarctic river systems,PLoS One, 8(11), doi:10.1371/journal.pone.0077342.
Dittmar, T., and G. Kattner (2003), The biogeochemistry of the river and shelf ecosystem of the Arctic Ocean: A review,Mar. Chem.,83(3–4), 103–120, doi:10.1016/S0304-4203(03)00105-1.
Dittmar, T., H. P. Fitznar, and G. Kattner (2001), Origin and biogeochemical cycling of organic nitrogen in the eastern Arctic Ocean as evident from D- and L-amino acids,Geochim. Cosmochim. Acta,65(22), 4103–4114, doi:10.1016/S0016-7037(01)00688-3.
Dmitrenko, I., S. Kirillov, H. Eicken, and N. Markova (2005), Wind-driven summer surface hydrography of the eastern Siberian shelf,Geophys.
Res. Lett.,32, L14613, doi:10.1029/2005GL023022.
Dortch, Q. (1990), The interaction between ammonium and nitrate uptake in phytoplankton,Mar. Ecol. Prog. Ser.,61, 183–201.
Epstein, S., and T. Mayeda (1953), Variation of O18content of waters from natural sources,Geochim. Cosmochim. Acta,4(5), 213–224, doi:10.1016/0016-7037(53)90051-9.
Fripiat, F., D. M. Sigman, S. E. Fawcett, P. A. Rafter, M. A. Weigand, and J. L. Tison (2014), New insights into sea ice nitrogen biogeochemical dynamics from the nitrogen isotopes,Global Biogeochem. Cycles,28, 115–130, doi:10.1002/2013GB004729.
Gilg, O., R. Sané, D. V. Solovieva, V. I. Pozdnyakov, B. Sabard, D. Tsanos, C. Zöckler, E. G. Lappo, E. E. Syroechkovski Jr., and G. Eichhorn (2000), Birds and mammals of the Lena Delta Nature Reserve, Siberia,Arctic,53(2), 118–133.
Gordeev, V. V., J. M. Martin, I. S. Sidorov, and M. V. Sidorova (1996), A reassessment of the Eurasian river input of water, sediment, major elements, and nutrients to the Arctic Ocean,Am. J. Sci.,296, 664–691.
Granger, J., and D. M. Sigman (2009), Removal of nitrite with sulfamic acid for nitrate N and O isotope analysis with the denitrifier method, Rapid Commun. Mass Spectrom.,23(23), 3753–3762, doi:10.1002/rcm.4307.
Holmes, R. M., B. J. Peterson, V. V. Gordeev, A. V. Zhulidov, M. Meybeck, R. B. Lammers, and C. J. Vorosmarty (2000), Flux of nutrients from Russian rivers to the Arctic Ocean: Can we establish a baseline against which to judge future changes?,Water Resour. Res.,36, 2309–2320.
Holmes, R. M., et al. (2011), Seasonal and annualfluxes of nutrients and organic matter from large rivers to the Arctic Ocean and surrounding seas,Estuar. Coast,35, 369–382, doi:10.1007/s12237-011-9386-6.
Jones, E. P., L. G. Anderson, and J. H. Swift (1998), Distribution of Atlantic and Pacific waters in the upper Arctic Ocean: Implications for cir- culation,Geophys. Res. Lett.,25(6), 765–768, doi:10.1029/98GL00464.
Jones, M. (1984), Nitrate reduction by shaking with cadmiumAlternative to cadmium columns,Water Res.,18(5), 643–646, doi:10.1016/0043- 1354(84)90215-X.
Jørgensen, N. O. G., L. J. Tranvik, and G. M. Berg (1999), Occurrence and bacterial cycling of dissolved nitrogen in the Gulf of Riga, the Baltic Sea,Mar. Ecol. Prog. Ser.,191, 1–18, doi:10.3354/meps191001.
Kattner, G., J. Lobbes, H. Fitznar, R. Engbrodt, E.-M. Nöthig, and R. Lara (1999), Tracing dissolved organic substances and nutrients from the Lena River through Laptev Sea (Arctic),Mar. Chem.,65(1), 25–39, doi:10.1016/S0304-4203(99)00008-0.
Kendall, C., E. M. Elliott, and S. D. Wankel (2008), Tracing anthropogenic inputs of nitrogen to ecosystems, inStable Isotopes in Ecology and Environmental Science, 2nd ed., pp. 375–449, Blackwell, London, U. K.
Knapp, A. N., D. M. Sigman, and F. Lipschultz (2005), N isotopic composition of dissolved organic nitrogen and nitrate at the Bermuda Atlantic Time-series Study site,Global Biogeochem. Cycles,19, GB1018, doi:10.1029/2004GB002320.
Knapp, A. N., D. M. Sigman, F. Lipschultz, A. B. Kustka, and D. G. Capone (2011), Interbasin isotopic correspondence between upper-ocean bulk DON and subsurface nitrate and its implications for marine nitrogen cycling,Global Biogeochem. Cycles,25, GB4004, doi:10.1029/
2010GB003878.
Knapp, A. N., D. M. Sigman, A. B. Kustka, S. A. Sañudo-Wilhelmy, and D. G. Capone (2012), The distinct nitrogen isotopic compositions of low and high molecular weight marine DON,Mar. Chem.,136–137, 24–33, doi:10.1016/j.marchem.2012.05.001.
Le Fouest, V., M. Babin, and J. E. Tremblay (2013), The fate of riverine nutrients on Arctic shelves,Biogeosciences,10(6), 3661–3677, doi:10.5194/bg-10-3661-2013.
Le Fouest, V., M. Manizza, B. Tremblay, and M. Babin (2015), Modelling the impact of riverine DON removal by marine bacterioplankton on primary production in the Arctic Ocean,Biogeosciences,12(11), 3385–3402, doi:10.5194/bg-12-3385-2015.
Lehmann, M. F., D. M. Sigman, D. C. McCorkle, J. Granger, S. Hoffmann, G. Cane, and B. G. Brunelle (2007), The distribution of nitrate15N/14N in marine sediments and the impact of benthic nitrogen loss on the isotopic composition of oceanic nitrate,Geochim. Cosmochim. Acta, 71(22), 5384–5404, doi:10.1016/j.gca.2007.07.025.
Letscher, R. T., D. A. Hansell, D. Kadko, and N. R. Bates (2013), Dissolved organic nitrogen dynamics in the Arctic Ocean,Mar. Chem.,148, 1–9, doi:10.1016/j.marchem.2012.10.002.
Lett, S., and A. Michelsen (2014), Seasonal variation in nitrogenfixation and effects of climate change in a subarctic heath,Plant Soil,379(1–2), 193–204, doi:10.1007/s11104-014-2031-y.
Macdonald, R. W., E. Sakshaug, and R. Stein (2004), The Arctic Ocean: Modern status and recent climate change, inThe Organic Carbon Cycle in the Arctic Ocean, edited by R. Stein and R. W. Macdonald, pp. 6–21, Springer, Berlin.
Macdonald, R. W., T. Harner, and J. Fyfe (2005), Recent climate change in the Arctic and its impact on contaminant pathways and interpre- tation of temporal trend data,Sci. Total Environ.,342(1–3), 5–86, doi:10.1016/j.scitotenv.2004.12.059.
Macko, S. A., M. L. F. Estep, M. H. Engel, and P. E. Hare (1986), Kinetic fractionation of stable nitrogen isotopes during amino acid transami- nation,Geochim. Cosmochim. Acta,50(10), 2143–2146, doi:10.1016/0016-7037(86)90068-2.
McCarthy, J. J., and J. C. Goldman (1979), Nitrogenous nutrition of marine phytoplankton in nutrient-depleted waters,Science,203(4381), 670–672.
McIlvin, M. R., and K. L. Casciotti (2011), Technical updates to the bacterial method for nitrate isotopic analyses,Anal. Chem.,83(5), 1850–1856, doi:10.1021/ac1028984.
Miller, G. H., S. J. Lehman, K. A. Refsnider, J. R. Southon, and Y. Zhong (2013), Unprecedented recent summer warmth in Arctic Canada, Geophys. Res. Lett.,40, 5745–5751, doi:10.1002/2013GL057188.