The Calcium-dependent Potassium Current in Olfactory Interneurons of
the Cockroach Periplaneta americana
Inaugural-Dissertation
zur Erlangung des Doktorgrades
der Mathematisch-Naturwissenschaftlichen Fakultät der Universität zu Köln
vorgelegt von Sabine Schleicher
aus Schweinfurt
Zoologisches Institut Universität zu Köln
2014
Tag der mündlichen Prüfung:
23.06.2014
Contents
Abbreviations 5
Zusammenfassung 8
Abstract 10
1 Introduction 11
1.1 The insect olfactory system . . . . 11
1.2 Olfactory processing within the AL . . . . 12
1.3 Calcium-dependent potassium channels . . . . 14
1.4 Objective of this thesis . . . . 18
2 Materials and Methods 19
2.1 Animals & Materials . . . . 19
2.2 Preparation . . . . 19
2.3 Electrophysiological recordings . . . . 20
2.3.1 Whole-cell recordings . . . . 20
2.3.2 Current isolation . . . . 21
2.3.3 Data analysis . . . . 21
2.4 Single cell labeling . . . . 23
3 Results 25
3.1 Identification of AL interneurons . . . . 26
3.2 Steady-state activation of I
K(Ca). . . . 29
3.2.1 Steady-state activation at defined calcium concentrations . . 29
3.2.2 Steady-state activation with calcium influx . . . . 32
3.4 Pharmacological properties of I
K(Ca). . . . 51
3.5 I
K(Ca)and underlying currents . . . . 55
4 Discussion 58
4.1 Biophysical properties of I
K(Ca). . . . 59
4.1.1 Calcium sensitivity and voltage dependent activation . . . . 60
4.1.2 Parameters of steady-state activation . . . . 61
4.1.3 Calcium dependent activation . . . . 63
4.2 Pharmacology of I
K(Ca)from AL interneurons . . . . 65
4.2.1 I
K(Ca)from AL interneurons is apamin-insensitive . . . . 65
4.2.2 Sensitivity of I
K(Ca)to ChTX and IbTX . . . . 66
4.3 Summary . . . . 68
5 Appendix 72
List of Figures 78
List of Tables 79
References 79
Erklärung 99
Teilpublikationen 100
Abbreviations
4-AP . . . 4-aminopyridine
[Ca
2+]
i. . . intracellular Ca
2+concentration [Ca
2+]
O. . . extracellular Ca
2+concentration I/V relation . . . current-voltage relation
I
A. . . voltage activated potassium current I
Ca. . . voltage activated calcium current I
K(Ca). . . Ca
2+-dependent potassium current I
K(V). . . delayed rectifying potassium current I
Na. . . voltage activated sodium current AHP . . . afterhyperpolarization
AL(s) . . . antennal lobe(s)
AMPA-receptor . . . .
α-amino-3-hyrdoxy-5-methyl-4-isoxazolepropionic acidreceptor
AP(s) . . . action potential(s)
BK channel(s) . . . large conductance Ca
2+-activated potassium channel(s) Ca
Vchannel(s) . . . voltage-gated Ca
2+channel(s)
ChTX . . . charybdotoxin
CNQX . . . 6-cyano-7-nitroquinoxaline-2.3-dione DL-AP5 . . . DL-2amino-5-phosphonopentanoic acid
EGTA . . . ethylene glycol bis(2-aminoethylether)-N,N,N’,N’-te- traacetic acid
GABA . . . .
γ-aminobutyric acidHEPES . . . 4-(2-hydroxyethyl)-1-piperazineethanesulfonic acid
iACT . . . inner antenno-cerebral tract
channel(s)
IUPHAR . . . International Union of Basic and Clinical Pharmaco- logy
K
Cachannel(s) . . . Ca
2+-activated potassium channel(s) LLP . . . lateral lobe of the protocerebrum LN(s) . . . local interneuron(s)
MB . . . mushroom body
NMDA-receptor . . . N-methyl-D-aspartate receptor OSN(s) . . . olfactory sensory neuron(s) PBS . . . phosphate buffered saline PTX . . . picrotoxin
RT . . . room temperature SD . . . standard deviation
SFA . . . spike frequency adaptation
SK channel(s) . . . small conductance Ca
2+-activated potassium chan- nel(s)
TTX . . . tetrodotoxin
uPN(s) . . . uniglomerular projection neuron(s)
V
0.5(act). . . voltage for half-maximal activation
VSG . . . ventrolateral somata group
Zusammenfassung
Das olfaktorische System von Insekten hat sich seit langem bewährt um allge- meine Mechanismen der olfaktorischen Informationsverarbeitung zu untersuch- en. Gerüche werden von olfaktorischen Rezeptorzellen detektiert, welche in spez- ifische Glomeruli des Antennallobus (AL) projizieren. Hier wird die olfaktorische Information von lokalen Interneuronen (LNs) prozessiert und von Projektion- sneuronen (PNs) zu höheren Hirnregionen weitergeleitet. Die beteiligten Neu- rone lassen sich anhand von Transmittern und Ionenkanälen sowie ihrer elek- trophysiologischen Eigenschaften unterscheiden, dennoch ist unbekannt wie die verschiedenen elektrophysiologischen Eigenschaften durch zelleigene Ionenka- näle generiert und moduliert werden. In dieser Studie wurden deshalb bio- physikalische und pharmakologische Eigenschaften des kalziumabhängigen Ka- liumstroms (I
K(Ca)) mit Hilfe der ’whole-cell patch-clamp’ Technik untersucht und spezifischen Interneuronen des Antennallobus aus intakten Hirnpräparaten von adulten Schaben (Periplaneta americana) zugeordnet.
Steady-state Aktivierung mit definierten intrazellulären Kalziumkonzentratio-
nen ([Ca
2+]
i) zeigte, dass der I
K(Ca)von Typ I LNs die größte Sensitivität für Kalz-
ium besitzt. In den übrigen AL Interneurontypen sind mehr als 10 mal höhere
[Ca
2+]
inotwendig um den I
K(Ca)bei physiologischem Membranpotential zu ak-
tivieren. In allen AL Interneuronen wies der I
K(Ca)deutliche Kalzium- und Span-
nungabhängigkeit auf, jedoch zeigten die biophysikalischen Eigenschaften Un-
terschiede in der kalziumabhängigen Aktivierung. Während in Typ I LNs der
I
K(Ca)starr als Reaktion auf Ca
2+Einstrom aktiviert wird, weisen in uniglome-
rulären PNs (uPNs) und Typ II LNs die biophysikalischen Eigenschaften auf
einen kooperativen Effekt zwischen I
Caund I
K(Ca)Aktivierung hin.
uPNs, Typ IIb LNs und den meisten Typ IIa LNs bei hohen [Ca
2+]
Odie I
K(Ca)Aktivierung vom I
Caemanzipiert. In uPNs wurde zudem eine außergewöhnlich hohe Stromdichte festgestellt, dagegen wurde in Typ I LNs der langsamste Ver- lauf der kalziumabhängigen Aktivierung gemessen. Der I
K(Ca)ist in allen AL Interneuronen bereits bei unterschwelligem Membranpotential aktivierbar um erregenden Ca
2+Einstrom entgegen zu wirken. Dennoch wurde bei ’current- clamp’ Experimenten kein Einfluss auf das Ruhemembranpotential von uPNs und Typ I LNs nachgewiesen. In Typ IIb LNs zeigte der I
K(Ca)den schnellsten Verlauf von kalziumabhängiger Aktivierung und Inaktivierung. Während in der Population von Typ IIa LNs die breiteste Streuung der Messwerte festzustellen war. Dies könnte auf unterschiedliche Subtypen von IIa LNs zurückzuführen sein.
Trotz großer Unterschiede in der Kalziumsensitivität konnten diese keinen Kanal Subtypen zugeordnet werden. In allen AL Interneuronen war I
K(Ca)unempfind- lich gegenüber dem SK Kanal Imhibitor Apamin. Dagegen wurde bei allen AL Interneuronen mit Charybdotoxin eine vollständige Inhibition des I
K(Ca)erreicht.
In uPNs wurde ein EC
50Wert von 2 nM ermittelt, in allen Typen von LNs lag
der EC
50Wert bei 4 nM. Iberiotoxin, ein BK Kanal Inhibitor mit hoher Spez-
ifität, zeigte einen ähnlichen aber weniger wirksamen Effekt als ChTX. Selbst
bei der höchsten verwendeten IbTX Konzentration wurde nur ein Teil des I
K(Ca)gehemmt. Obwohl I
K(Ca)aus verschiedenen AL Interneuronen Unterschiede in
der Kalziumsensitivität, in der kalziumabhängigen sowie spannungsabhängigen
Aktivierung aufweisen, scheint der I
K(Ca)in allen AL Interneuronen durch BK
Kanäle geleitet zu werden.
Abstract
The olfactory system of insects has already served as a suitable model to investi- gate mechanisms of general information processing. Thus, insect olfactory neu- rons were used to study physiology, transmitter content, from that evoked cur- rents as well as sensory processing on a network level. As an important step towards understanding how distinct electrophysiological properties of neurons are generated by intrinsic currents, I used whole-cell patch-clamp recordings to analyze biophysical and pharmacological properties of I
K(Ca)from unequivocally identified uniglomerular projection neurons (uPNs) and local interneurons (LNs) in the adult, intact brain of the cockroach Periplaneta americana.
Steady-state activation at defined [Ca
2+]
irevealed highest Ca
2+sensitivity of I
K(Ca)from type I LNs, I
K(Ca)from other AL interneurons require at least 10 fold higher [Ca
2+]
ito activate at physiological membrane potential. I
K(Ca)from all AL in- terneurons was clearly dependent on voltage and calcium, while biophysical properties of I
K(Ca)delineate distinct qualities in calcium dependent activation.
While I
K(Ca)from type I LNs is rigidly activated in response to Ca
2+influx, bio- physical properties of I
K(Ca)from uPNs and type II LNs suggest a beneficial effect by I
Caactivation.
Steady-state activation with simultaneous Ca
2+influx revealed that I
K(Ca)is ac-
tive at subthreshold potential and high [Ca
2+]
Ouncoupled I
K(Ca)activation from
I
Cain uPNs, type IIb LNs, and the major part of type IIa LNs. A remarkable high
current density of I
K(Ca)was found in uPNs, whereas in type I LNs the slowest
time course of Ca
2+-dependent activation was observed. Although I
K(Ca)from
all AL interneurons is actived at subthreshold potential, buffering the membrane
Within the population of type II LNs, the quality of biophysical properties varied within the range bounded by uPNs and type I LNs. Whereby I
K(Ca)from type IIb LNs displayed fastest time course of Ca
2+dependent activation and inactivation.
In type IIa LN population greatest variability of data was observed, which might arise from different subtypes of type IIa LNs.
However, differential Ca
2+sensitivity could not be assigned to K
Cachannel sub-
types. I
K(Ca)from all AL interneurons were insensitive to the SK channel blocker
apamin, whereas charybdotoxin achieved complete inhibition of I
K(Ca)yielding
in EC
50of 2 nM for uPNs and 4 nM for both type I and type II LNs. Iberiotoxin, a
BK channel specific inhibitor displayed similar but less potent effects than ChTX,
suppressing only a fraction of I
K(Ca)in all AL interneurons even at highest ap-
plied concentration. Biophysical properties of I
K(Ca)delineate distinct qualities in
calcium sensitivity and calcium dependent as well as voltage dependent activa-
tion, even though I
K(Ca)seems to be mediated by BK channels in all types of AL
interneurons.
1 Introduction
Odor detection and discrimination is a powerful evolutionary advantage, as it is essential for sensing dangers, food and fertile mates as well as it is a substan- tial part of social behavior and learning. As an example of convergent evolution the olfactory systems of vertebrates and invertebrates share striking similarities in physiology and neuronal organization, suggesting that olfactory information is processed through similar mechanisms in these unlike classes of animals (Eis- then, 2002; Hildebrand & Shepherd, 1997; Strausfeld & Hildebrand, 1999; Wilson
& Mainen, 2006). Therefore the insect olfactory system has been studied in great detail as a model system to understand general principles of sensory processing on a network level (Distler et al., 1998; Fiala, 2007; Galizia & Roessler, 2010; Lau- rent, 1999; Vosshall & Stocker, 2007). As an important step towards understand- ing how intrinsic electrophysiological properties of different circuit components are produced by the ion channels they endow, I analyzed biophysical properties of the calcium-dependent potassium current I
K(Ca)in distinct antennal lobe (AL) interneurons of Periplaneta americana. Additionally, pharmacological properties of I
K(Ca)were investigated, establishing concentration-response relations for K
Cachannel inhibitors with high specificity. On this basis exclusion experiments will be performed to elucidate the impact of I
K(Ca)on firing properties of AL interneu- rons.
1.1 The insect olfactory system
When an insect perceives an odor, it is bound by odorant binding proteins lo-
cated in the membrane of olfactory sensory neurons (OSNs). OSNs are housed in
olfactory sensilla located on the insects antennea. Generally, one OSN expresses a single functional receptor gene and its excitatory output terminates in a discrete spherical structure of the ipsilateral antennal lobe (AL) called glomerulus, which is the primary olfactory center and the first synaptic relay processing olfactory information. OSNs expressing the same receptor type converge into the same glomerulus and there they form synapses onto both local interneurons (LNs) and projection neurons (PNs).
PNs convey the integrated olfactory information from the AL to higher order brain centers where multimodal information processing associated to learning and memory formation occurs. Uniglomerular PNs (uPNs) branch in a single glomerulus within the AL and send their axons to the calyxes of the mushroom body (MB) and the lateral lobe of the protocerebrum (LLP) (Ernst & Boeckh, 1983;
Malun, 1991a; Fusca et al., 2013).
Within the AL LNs connect different glomeruli with each other, while their neu- rite branching pattern is limited to the AL (Ernst & Boeckh, 1983; Malun, 1991b;
Distler & Boeckh, 1998). Based on early immunohistochemical (Hoskins et al., 1986; Malun, 1991b; Distler et al., 1998; Bicker, 1999) and electrophysiological work (Waldrop et al., 1987; Christensen et al., 1993), LNs have been regarded as mostly GABAergic and inhibitory. However, recent work showed that LNs are a more heterogeneous population of neurons with very different morphological and intrinsic electrophysiological properties (Seki & Kanzaki, 2008; Olsen & Wil- son, 2008; Husch et al., 2009b,a; Reisenman et al., 2011; Fusca et al., 2013). Hence, the composition and biophysical properties of ion currents from distinct interneu- ron types are likely to differ, too.
1.2 Olfactory processing within the AL
Hitherto it is clear that LNs can also contain neurotransmitters like acetylcholine (Shang et al., 2007; Fusca et al., 2013) or glutamate (Daniels et al., 2008) addi- tional to neuromodulators such as peptides and biogenic amines (Ignell, 2001;
Homberg, 2002; Nässel & Homberg, 2006; Dacks et al., 2010; Neupert et al., 2012).
1 Introduction
Up to date, two types of LNs can be distinguished by their transmitter content, as well as morphological and electropysiological properties (Husch et al., 2009a,b;
Fusca et al., 2013). Type I LNs (LN I) display GABA-like immunoreactivity, and upon odor stimulation or depolarizing current injection they generate Na
+driven action potentials (Husch et al., 2009a). Type II LNs are nonspiking interneurons which accordingly do not possess voltage activated sodium channels and pre- sumably accomplish graded transmitter release. Within the type II LN population at least two subtypes can be distinguished by their dinstinct morphological fea- tures and active membrane properties (Husch et al., 2009b). Type IIb LNs respond to odorants with relatively uniform depolarization, whereas type IIa LNs gener- ate more complex changes in membrane potential that include depolarizations, sometimes with Ca
2+driven spikelets or pure hyperpolarization. Both nonspik- ing LN subtypes exhibit large voltage activated Ca
2+currents (I
Ca), but type IIa LNs display a fast inactivating I
Cacomponent, while type IIb LNs show a more sustained current profile during voltage pulses (Husch et al., 2009b). As a result, the interglomerular circuits provided by diverse LN types, mediate complex exci- tatory and inhibitory interactions to structure the olfactory representation within the AL and ultimately determine the tuning profile of uPNs (Bazhenov et al., 2001;
Stopfer, 2005; Olsen et al., 2007; Shang et al., 2007; Olsen & Wilson, 2008; Assisi et al., 2012).
Without external stimulation uPNs are spontaneously active and respond to ol- factory stimuli with sequences of depolarizing and hyperpolarzing epochs, each lasting hundreds of milliseconds (Christensen et al., 1998; Bazhenov et al., 2001).
A single uPN responds to a broader range of odors than the matching presynaptic
OSN, whereby one odor might elicit a temporally complex pattern with phases
of excitation and inhibition, whereas another odor elicit a phasic excitation with
no inhibition (Laurent et al., 1996; Ito et al., 2008; Lei et al., 2011). Imaging studies
have shown that different odors evoke temporally synchronized activity pattern
in different glomeruli, leading to spatial maps finally encoding for odor identity
(Galizia et al., 1999; Silbering et al., 2008; Watanabe et al., 2012). Higher odor con-
centrations evoke broader glomerular activation patterns which results in greater
spatial overlap among different odor representations (Cleland & Linster, 2002;
Sachse & Galizia, 2003).
Although network responses to odors and response profiles of participating neu- rons are well documented we have only limited information about intrinsic elec- trophysiological properties of participating neurons and how they are determined by cellular mechanisms. Husch et al. (2009a) already described distinct proper- ties of I
Cafrom AL interneurons which correlate with their electrophysiological properties (Husch et al., 2009b). As the electrophysiological properties of a certain neuron are produced by the complement of intrinsic ion channels, investigation on I
K(Ca)is the next step towards understanding how olfactory information is processed on the cellular level.
1.3 Calcium-dependent potassium channels
Since its first observation in red blood cells by Gardos (1958), I
K(Ca)has been described in numerous cell types with diverse physiological roles. Beside i.e.
it regulates secretion in endocrine and exocrine cells (Petersen & Maruyama,
1984), as well as myogenic tone and contraction of smooth muscle (Ghatta et al.,
2006). Calcium-dependent potassium channels (K
Cachannels) are activated by
rises in cytosolic calcium concentration ([Ca
2+]
i) leading to a rapid potassium ef-
flux, thereby coupling intracellular Ca
2+signalling to the membrane potential. In
neurons K
Cachannels play a crucial role in controlling a variety of firing char-
acteristics. They contribute to action potential repolarization, shaping the ampli-
tude and width of action potentials (Shao et al., 1999). They mediate fast (in the
range of milliseconds) and slow (in the range of seconds) after hyperpolarization
(AHP) following action potentials (Pineda et al., 1992; Stocker et al., 2004), con-
trol repetetive firing patterns, and mediate spike frequency adaptation (Gu et al.,
2007; Vandael et al., 2012). Three families of K
Cachannels have been identified,
which can be separated on biophysical, genetical and pharmacological grounds
and have been named K
Cachannels of big, intermediate, and small conductance
(BK, IK, and SK channels), respectively (Sah, 1996; Vergara et al., 1998).
1 Introduction
BK channels
Large conductance K
Cachannels (BK channels; also known as maxi-K or slo- channels) have a large unitary conductance of ~ 100 to 300 pS and are composed of four
αsubunits, where a single
αsubunit is encoded by the slowpoke gene (IUPHAR name K
Ca1.1) (Atkinson et al., 1991; Adelman et al., 1992). Functional diversity is achieved through alternative mRNA splicing and the use of tissue- specific transcriptional promoters (Atkinson et al., 1998; Brenner et al., 1996). The slo gene encodes a pore-forming
αsubunit that shares significant homology with pore regions of other potassium channels (Wei et al., 1994). The resultant polypep- tide comprises seven transmembrane domains (S0 – S6), a short extracellular amino-terminus and a large intracellular carboxyl-terminus. The intracellular domain contains four hydrophobic segments (S7 – S10), two domains that reg- ulate the conductance of K
+(RCK domains), and a stretch of aspartate residues responsible for Ca
2+binding (Meera et al., 1997; Wang & Sigworth, 2009; Wu et al., 2010).
BK channels activate in response to membrane depolarization and binding of in- tracellular Ca
2+(Marty, 1981; McManus, 1991). Interestingly, it appears that the effect of Ca
2+and membrane potential are allosterical processes, both of which enhance the open probability (Horrigan & Aldrich, 2002; Latorre et al., 2010).
Each
αsubunit can be modulated by an accessory
βsubunit, which increases the channel’s Ca
2+sensitivity by stabilizing the voltage sensor activation (Bao &
Cox, 2005). However, no
βsubunit has been found in insects yet (Littleton &
Ganetzky, 2000; Orio et al., 2002; Berkefeld et al., 2010). The Ca
2+ions required for activation are mainly delivered by voltage-gated Ca
2+channels (Ca
(V)channels) directly linked to BK channels (Robitaille et al., 1993; Berkefeld et al., 2006).
Several pharmacological blockers of BK channels have been described so far, in-
cluding the two toxin peptides charybdotoxin (ChTX) and iberiotoxin (IbTX),
which are derived from scorpion venom of Leiurus quinquestriatus var. hebraeus
and Buthus tamulus, respectively (Miller et al., 1985; Galvez et al., 1990). Both
polypeptides are comprised of 37 amino acids displaying 68% sequence homol-
ogy and a solution structure of a
αhelix affixed by disulfide bonds to a three-
stranded
βsheet (Galvez et al., 1990; Miller, 1995). Mutational studies and radi- olabeling have provided molecular information of interaction between peptide toxin and BK channel, and the resolved ChTX-BK complex structure unveiled that the
βsheet of ChTX is the main binding surface with Lys27 occluding the channel pore (Qiu et al., 2009). Moreover, specific inhibition with ChTX and IbTX revealed the physiological role of BK channels, which mediate action potential (AP) repolarization and fast AHP in many neurons (Pineda et al., 1992; Shao et al., 1999; Gu et al., 2007).
SK channels
Initially, small conductance Ca
2+-activated potassium channels (SK) were named according to their single-channel conductance, which ranges from 2 to 20 pS.
Later, three genes SK1, SK2 and SK3 (IUPHAR names are K
Ca2.1, K
Ca2.2 and K
Ca2.3, respectively) sharing 60% sequence homology were identified and at- tributed to the SK channel family (Köhler et al., 1996). Members display a tertiary structure consisting of six transmembrane domains with intracellular amino- and carboxyl-terminus. SK channels possess no voltage-sensing segment therefore lacking voltage dependence, instead they are activated by low Ca
2+concentra- tions (Hirschberg et al., 1999). Calcium sensitivity is conferred by calmodulin, which is constitutively bound to the C-terminus of SK channels (Schumacher et al., 2001). Binding of Ca
2+to calmodulin leads to a conformational change of the channel protein, opening the channel pore, and allowing potassium efflux (Xia et al., 1998).
Specific inhibition of SK channels by apamin allowed for their initial characteri- zation and assigned their impact to slow AHP, spike frequency adaptation (SFA), and tonically firing pattern (Blatz & Magleby, 1986; Bennett et al., 2000; Faber &
Sah, 2003). Up to date several pharmacological agents are known which selec-
tively inhibit SK channels, including D-tubocurarine (Ishii et al., 1997a; D’hoedt
et al., 2004), bicuculine salts (Seutin & Johnson, 1999) and the scorpion toxin scyl-
latoxin (Auguste et al., 1990, 1992).
1 Introduction
IK channels
The third type of K
Cachannels display an intermediate single-channel conduc- tance of 20-100 pS and therefore have been named intermediate conductance channels (IK channels) (Ishii et al., 1997b). Encoded by the SK4 gene, this channels share structural features of SK channels, forming tetrameres from subunits con- sisting of six transmembrane segments with an intracellular amino- and carboxyl- terminus (Joiner et al., 1997; Khanna et al., 1999). But also formation of IK channels from interaction by slo and slack subunits has been reported (Joiner et al., 1998).
Nevertheless, they form a distinct group of K
Cachannels (IUPHAR name K
Ca3.1) which are not expressed in neuronal tissue and can clearly be seperated from BK and SK channels by their sensitivity to pharmacological agents (Wei et al., 2005;
Jensen et al., 2002).
IK channels have been shown to be sensitive to clotrimazole and the peptide tox- ins charybdotoxin and margatoxin, whereas IbTX the structurally-related selec- tive BK channel blocker, and the specific SK channel blocker apamin were with- out effects (Jensen et al., 2001; Bychkov et al., 2002).
Much of the knowledge about K
Cachannels, how they contribute to neuronal fir- ing properties and their sensitivity to specific neurotoxins, arises from studies in vertebrate species. Although the Drosophila genome contains one SK and a slow- poke gene (Littleton & Ganetzky, 2000), studies from insect are rare but hint at dif- ferential pharmacological properties of invertebrate and vertebrate K
Cachannels.
However, a depth knowledge of cell type specific firing properties and membrane conductances that mediate them, is an important prerequisite towards detailed understanding the cellular basis of olfactory information processing. Therefore, I analyzed the Ca
2+-dependent K
+currents in uPNs and different types of LNs, as I
K(Ca)plays a crucial role in controlling neuronal firing characteristics (Faber &
Sah, 2003).
1.4 Objective of this thesis
Insect olfactory neurons have been used to study physiology, transmitter content, from that evoked currents as well as sensory processing on a network level. In this thesis, biophysical, and pharmacological properties of I
K(Ca)were analyzed and assigned to unequivocally identified uPNs and three LN types. The specific objectives of this study were:
• First, to analyze I
K(Ca)with particular regard to calcium sensitivity, voltage dependence, and calcium dependence. To analyze I
K(Ca)activation associ- ated to Ca
2+influx through voltage-gated Ca
2+channels. This part aimed to characterize the complex aspects of I
K(Ca)activation and presents averaged data from a large number of experiments allowing comparison among AL interneurons.
• Second, to examine the sensitivity of I
K(Ca)to highly specific K
Cachannel
blocker as apamin, charybdotoxin, and iberiotoxin and establish concentra-
tion-response relations. This will set the stage for exclusion experiments
which elucidate the electrophysiological role of I
K(Ca)in spiking uPNs and
type I LNs.
2 Materials and Methods
2.1 Animals & Materials
Periplaneta americana were reared in crowded colonies at 27
◦C under a 12:12 light/dark photoperiod regimen and fed on a diet of dry rodent food, oatmeal and water. All experiments were performed in situ on brains from adult male animals.
All chemicals, unless stated otherwise, were obtained from AppliChem (Darm- stadt, Germany) or Sigma-Aldrich (Taufkirchen, Germany) with a purity grade p.a. (per analysis).
2.2 Preparation
The intact brain preparation was based on an approach described previously
(Demmer & Kloppenburg, 2009; Husch et al., 2009a) in which the entire olfac-
tory network is left intact. Before dissection animals were anesthetized by CO
2for several minutes. The animal’s legs were amputated distal of the coxa and
the animals were placed in custom built holders. Heads and antennae were im-
mobilized with adhesive tape (tesa ExtraPower Gewebeband, tesa AG, Hamburg
Germany). The head capsule was opened by cutting a window between the two
compound eyes at the bases of the antennae. The brain was dissected in extra-
cellular saline (see below) and pinned in a Sylgard-coated (Dow Corning Corp.,
Midland, Michigan, USA) recording chamber. To gain access to the recording site
and facilitate penetration of pharmacological agents into the tissue, parts of the
AL were desheathed using fine forceps. The preparations were also enzymati-
cally treated with a mixture of papain (0.3 mg/ml) and L-cystein (1 mg/ml) dis- solved in extracellular saline (~ 3 min, 37
◦C). For electrophysiological recordings, the somata of the AL neurons were visualized with a fixed upright microscope (BX51WI, Olympus, Hamburg, Germany) using a 40× water-immersion objective (UMPLFL, 0.8 numerical aperture (NA), 3.3 mm working distance, Olympus).
2.3 Electrophysiological recordings
2.3.1 Whole-cell recordings
Whole-cell recordings were performed at room temperature (RT) following the
methods described by Hamill et al. (1981). Electrodes with a tip resistance be-
tween 2.5 - 3.5 MΩ were fashioned from borosilicate glass (inner diameter (ID)
0.86 mm, outer diameter 1.5 mm, GB150-8P, Science Products, Hofheim, Ger-
many) with a temperature-controlled pipette puller (PP-830, Narishige Interna-
tional, London, U.K.). For patch-clamp recordings the pipettes were filled with
intracellular saline solution containing (in mM): 190 K-aspartate, 10 NaCl, 1 CaCl
2,
2 MgCl
2, 10 HEPES and 10 EGTA to pH 7.2 with KOH, resulting in an osmo-
larity of ~ 415 mOsm. During the experiments, if not stated otherwise, cells
were superfused constantly with extracellular saline solution (in mM): 185 NaCl,
4 KCl, 1 CaCl
2, 2 MgCl
2, 10 HEPES and 35 D-glucose. The solution was ad-
justed to pH 7.2 with NaOH and to 430 mOsm with glucose. Whole-cell volt-
age and current-clamp recordings were made with an EPC9 patch-clamp ampli-
fier (HEKA-Elektronik) that was controlled by the program Patch Master (ver-
sion2.5, HEKA-Elektronik) running under Windows. The electrophysiological
data were sampled at 20 kHz. Recordings were low pass filtered at 2 kHz with
a 4-pole Bessel-Filter. Compensation of the offset potential and capacitive cur-
rents was performed using the ’automatic mode’ of the EPC9 amplifier. Whole-
cell capacitance was determined by using the capacitance compensation (C-slow)
of the amplifier. The liquide junction potential between intracellular and extra-
cellular solution of 15.6 mV was calculated with Patcher’s-Power-Tools plug-in
2 Materials and Methods
(http://www3.mpibpc.mpg.de/groups/neher/index.php?page=software) for Igor Pro (Wavemetrics, Portland, Oregon) and was compensated. To remove un- compensated leakage and capacitive currents, a p/6 protocol was used. Voltage errors due to the series resistance (Rs) were minimized using the Rs-compensa- tion of the EPC9. Rs was compensated between 50% and 90% with a time con- stant (τ) of 100 µs. For current clamp recordings the bridge-balance setting was set to 70% to compensate for the potential drop due to the pipette. To isolate the recorded cell from synaptic input 10 µM CNQX (6-cyano-7-nitroquinoxaline-2.3- dione, C127, Sigma Aldrich), 50 µM DL-AP5 (DL-2amino-5-phosphonopentanoic acid, BN0086, Biotrend), and 100 µM PTX (picrotoxin, P1675, Sigma Aldrich) were added to the extracellular saline during current clamp recordings. These chemicals block AMPA-, NMDA, GABA
Aand nicotinic acetylcholine receptors respectively. Stimulus protocols used for each set of experiments are given in the Results section.
2.3.2 Current isolation
I
K(Ca)was isolated using a combination of pharmacological blockers, appropri- ate holding potential and digital current subtraction protocols, based on proto- cols that have been effective in insect preparations. Voltage activated Na
+cur- rents were blocked by tetrodotoxin (10
-6M, TTX, T-550, Alomone, Jerusalem, Is- rael). Ca
+2currents were blocked by CdCl
2(5 × 10
-4M), whereby I
K(Ca)was indi- rectly eliminated. The transient K
+current (I
A) was blocked by 4-aminopyridine (10
-2M, 4-AP, A78403, Sigma-Aldrich). To compensate for changes in osmolarity, the glucose concentration was appropriately adjusted. Details of recording so- lutions and voltage protocols for each set of experiments are given in the Result section.
2.3.3 Data analysis
I used the software Igor Pro 6.0.1 (Wavemetrics, including the Patcher’s Power
Tools plug-in) for analysis of electrophysiological data. All calculated values are
expressed as mean ± standard deviation (SD), if not stated otherwise. To deter- mine concentration-response relations, each concentration was applied at least two times. Current amplitudes were scaled as a fraction of maximal current and fit to a modified form of the Hill equation. The Hill equation (2.1) describes simul- taneous and saturating binding of ligands activating a multi-subunit complex.
I I
Max= K
nH
· [ S ]
nH1 + K
nH· [ S ]
nH(2.1)
In case of complete inhibition, the formulation is transformed to following equa- tion:
I
I
Max= 1
1 + 10
([S]−K)·
nH(2.2) I is the measured current amplitude at toxin concentration [ S ] , I
Maxis the max- imal current amplitude under control conditions, K is the association constant decribed by log of the concentration with half maximal effect, n
His the Hill co- efficient describing the slope of the curve. All calculated curves have a standard slope n
Hequals -1.
Conductance (G) was calculated using the equation:
G = I
V − V
rev(2.3)
Where I is the current density, V the test pulse potential and V
revis the K
+equi- librium potential. To convert current density to conductance, a K
+equilibrium potential of -98.5 mV was calculated.
To determine voltages for half-maximal current activation, data of steady-state
activation were fit using a first-order (n = 1) Boltzmann equation:
2 Materials and Methods
G
G
Max= 1
( 1 + e
(V0.5−V)/s)
n(2.4) Where G
Maxis the maximal conductance, V equals test pulse potential, G is the conductance at voltage V, s is the slope factor and V
0.5is the voltage at which half-maximal activation of current occurs.
2.4 Single cell labeling
To label individual cells, 1% (w/v) biocytin (B4261, Sigma) was added to the in-
tracellular solution. After electrophysiological recordings, brains were fixed in
Roti-Histofix (P0873, Carl Roth, Karlsruhe, Germany) for 2 - 3 h at RT. Subse-
quently the brains were rinsed in 0.1 M phosphate buffered saline (PBS, 3 × 20 min,
RT). PBS contained (in mM): 72 Na
2HPO
4· 2H
2O and 28 NaH
2HPO
4· H
2O, re-
sulting in pH 7.2. All brains were processed as whole mounts. To facilitate
streptavidin penetration, brains were treated with a commercially available colla-
genase/dispase mixture (1 mg/ml, 269638, Roche Diagnostics, Mannheim, Ger-
many) and hyaluronidase (1 mg/ml, H3506, Sigma-Aldrich) disolved in PBS
(20 min, 37
◦C). Afterwards the brains were rinsed in PBS (3 × 10 min, 4
◦C)
and incubated in PBS containing 1% Triton X-100 (Serva, Heidelberg, Germany)
to improve streptavidin penetration, and 10% normal goat serum (Vector Labs,
Burlingame, CA, USA) to prevent unspecific interactions, for 40 min at RT. Sub-
sequently the brains were rinsed in PBS (3 × 10 min, RT) and incubated in Alexa
Fluor 633 (Alexa 633) conjugated streptavidin (S21375, Molecular Probes, Eugene,
OR, USA) dissolved 1:400 in PBS containing 10% normal goat serum and 1% Tri-
ton X-100 for 1 - 2 days at 4
◦C. Finally brains were rinsed in PBS (3 × 10 min, RT),
dehydrated in Ethanol (50%, 70%, 90%, 100% and 100%, each concentration for
10 min), cleared and mounted in methylsalicylate (M6752, Sigma-Aldrich). The
fluorescence images were captured with a confocal microscope (LSM 510, Carl
Zeiss, Göttingen, Germany) equipped with PlanNeofluar 10× (0.3 NA) and Plan
Apochromat 20× (0.75 NA) objectives. Alexa 633 was excited with a He-Ne Laser at 633 nm and emission was collected through a 650 nm LP filter. For overview pictures overlapping image stacks were merged in Photoshop CS5 (Adobe Sys- tems Incorporated, San Jose, Ca, USA).
Sectioning
After capturing fluorescence images of the whole mounts, brains were washed
for 10 min in 100% ethanol and rehydrated in a descending ethanol series. Brains
were stored in 70% ethanol and selected brains were further rehydrated, em-
bedded in agarose (4% (w/v) Serva, Heidelberg, Germany) disolved in PBS and
100 µm thick ventrodorsal sections were cut with a vibration microtome (HM
650 V, Thermo Scientific, Walldorf, Germany). The slices were reincubated with
streptavidin overnight at -4
◦C, rinsed with PBS (3 × 10 min) and H
2O and dried
on coated slices (HistoBond 0800001, Marienfeld-Superior, Lauda-Königshofen,
Germany). After a dehydrating ethanol series (25%, 50%, 70%, 90% and 2 × 100%,
10 min each ) the slices were treated with xylene for 10 min to remove lipids and
mounted in Entellan (107961 Merck, Darmstad, Germany). Slices could be stored
and were used to obtain high resolution detail images of the innervated brain
areas with an 40× oil-immersion Plan-Neofluar (1.30 NA) objective.
3 Results
This study aimed to characterize the I
K(Ca)in olfactory interneurons of the insect antennal lobe. Here, primary sensory input detected by olfactory sensory neu- rons is processed. Uniglomerular projection neurons (uPNs) relay the integrated olfactory information from this first order neuropile to higher order brain centers.
Whereas local interneurons (LN) ramify only within the AL, to ultimately restruc- ture and shape the output of uPNs. In most neurons Ca
2+-dependent K
+outward currents are crucial to shape their intrinsic firing properties.
To reveal biophysical properties of I
K(Ca)in AL interneurons, whole-cell voltage-
clamp recordings were performed. The complex aspects of calcium and voltage
interaction have been investigated in a large number of experiments, performed
in collaboration with Dr. Cathleen Bradler and Andreas Klein, whose contribu-
tion is indicated in respective sections and figure legends. Sensitivity of I
K(Ca)to peptide neurotoxins apamin, charybdotoxin, and iberiotoxin was investigated
and concentration-response relations were established. On this basis exclusion
experiments were performed, in which portions of I
K(Ca)were pharmacologically
blocked, to unveil the impact of I
K(Ca)in shaping the intrinsic electrophysiolog-
ical properties of spiking AL interneurons. This studies were done by Dr. Ben
Warren, Viktor Bardos, Merit Klemann, and Sandra Wendler and are provided in
an appendix section 5. All recordings were performed under visual control from
cell bodies within the ventrolateral somata group (VSG) in an intact brain prepa-
ration of male P. americana.
3.1 Identification of AL interneurons
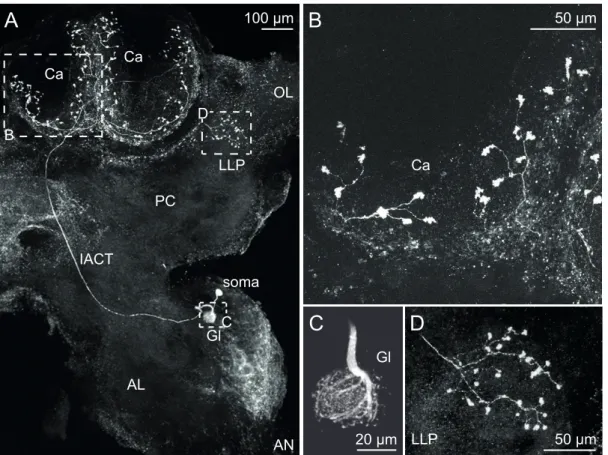
The cell bodies of uPNs are located in a homogeneous cluster at the ventral part of the VSG. Each of the recorded uPNs innervated a single glomerulus within the AL by surrounding it with thick neurite fibres that give rise to fine processes entering the dense neuropile and arborizing within the entire glomerulus (Malun, 1991a). Each uPN sends a single axon through the inner antenno-cerebral tract (iACT) to the mushroom body calyces and the lateral lobe of the protocerebrum (LLP) where it arborizes and terminates in boutons. Morphology and response properties of uPNs have been investigated extensively in P. americana and are well documented (Boeckh & Tolbert, 1993; Boeckh et al., 1984; Distler et al., 1998;
Lemona & Getz, 1998; Malun, 1991a).
The somata of LNs are arranged dorsal to the uPN soma cluster. Type I LNs own long primary neurites that bifurcate and give rise to the Y-shaped tract (Distler, 1989). Within the AL, neurites arborize in thick branches innervating many, but not all glomeruli. The density of processes vary between glomeruli of a given neuron. Type I LNs are spiking interneurons that generate Na
+driven action po- tentials (APs) (Husch et al., 2009a). Further dorsally located somata belong mostly to non-spiking type II LNs, referred to as type IIa and type IIb LNs (Husch et al., 2009a,b). Neurons of both LN II subtypes innervate all glomeruli of the AL, but subtypes could be distinguished by their branching pattern within the glomeruli.
Type IIa LNs display uniform innervation of the whole glomerulus, whereas type IIb LNs innervate all glomeruli only partially. All neurons were labeled by dye injection via the recording pipette and were subsequently identified by their def- inite morphology.
Figure 3.1(following page). Morphological characteristics of LN types.Morphology of recorded LNs was revealed by staining via the patch pipette. (A) Morphology of type I LN (310 µm image stack, left side). The neuron innervated many, but not all glomeruli of the AL. The density of neurites varied between glomeruli, shown in detail at the right side (20 µm image stack). (B) Type IIa LN (320 µm image stack, left side) displayed homogeneous innervation of all glomeruli (20 µm image stack, right side). (C) Type IIb LN (375 µm image stack, right side) innervated all glomeruli only partially (20 µm image stack, right side).
3 Results
20 µm
20 µm 100 µm
soma
AN a
p m l
A
100 µm soma
AN a
p m l
C
100 µm soma
AN a
p m l
B
20 µm100 µm
20 µm GlC
C
soma
AN AL
IACT
LLP D
PC B
A
OL Ca Ca
Gl
50 µm
B
Ca
50 µm
D
LLP
Figure 3.2. Morphological characteristics of an uPN. Morphology of a recorded uPN revealed by staining via the patch pipette. (A) 600 µm image stack of the right hemi- sphere. The uPN innervated a single glomerulus (Gl) within the antennal lobe (AL) and sent a single axon along the inner antenno-cerebral tract (iACT) to the mushroombody’s calyces (Ca) and the lateral lobe of the protocerebrum (LLP). AN: antennal nerve, OP: op- tical lobe, PC: protocerebrum. (B – D) Higher magnification of the innervated glomerulus (C), a single calyx (B) and the LLP (D).
3 Results
3.2 Steady-state activation of I
K(Ca)Steady-state activation of I
K(Ca)was investigated at defined intracellular Ca
2+concentration ([Ca
2+]
i) or by influx of 1 or 6 mM extracellulare Ca
2+concentra- tion, respectively ([Ca
2+]
O). Thus, recording conditions were designed to activate I
K(Ca)by either persistent Ca
2+concentration or by Ca
2+influx through simulta- neously activated Ca
Vchannels. Currents were activated by 300 ms depolarizing voltage steps up from -60 mV, increased in 10 mV increments.
3.2.1 Steady-state activation at defined calcium concentrations
Defined [Ca
2+]
iwere applied via the recording pipette to evaluate calcium sensi- tivity, and voltage dependent activation of I
K(Ca). Pipette solutions were prepared by using an EGTA-Ca
2+buffering system, resulting in [Ca
2+]
iof 56, 143, 540, and 1800 µM. The preparation was superfused with saline containing 10
-6M TTX to block voltage activated Na
+currents (I
Na), 10
-2M 4-AP to block transient potas- sium currents (I
A), and 5 ×10
-4M CdCl
2to block voltage activated Ca
2+currents (I
Ca). Thus, I
K(Ca)was activated by a series of depolarizing voltage pulses at defined [Ca
2+]
i. Recordings fom uPNs were perfomed by Dr. Cathleen Bradler and myself. Analysis and figures of uPNs were kindly provided by Dr. Cathleen Bradler.
During a sustained voltage pulse I
K(Ca)displayed a sustained, noninactivating current profile (Fig. 3.3A and B). Moreover, I
K(Ca)amplitudes increased with progressively depolarizing voltage pulses, showing clear voltage dependence of steady-state activation at all applied [Ca
2+]
i. Comparing the G/V relations from different [Ca
2+]
ishowed that increasing [Ca
2+]
ilowered the voltage threshold for activation (Fig. 3.3C) and the voltage for half-maximal activation (V
0.5(act)) (Fig.
3.3D). At an [Ca
2+]
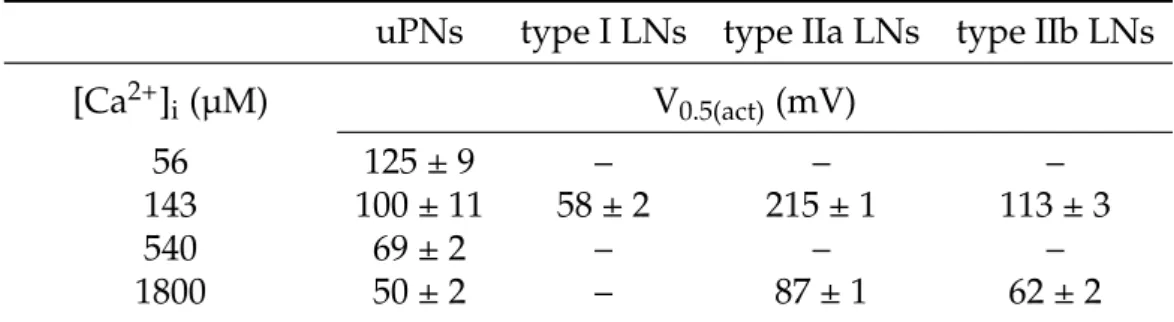
iof 143 µM, V
0.5(act)equals 100 mV in uPNs, 58 mV in type I LNs, 215 mV in type IIa LNs and 113 mV in type IIb LNs (Fig. 3.4B), ascrib- ing highest calcium sensitivity to type I LNs. Nonspiking type II LNs required higher [Ca
2+]
ito activate at 0 mV, compared to spiking uPNs and type I LNs.
Higher [Ca
2+]
iare required to activate I
K(Ca)from non-spiking type II LNs. At a
Table 3.1. Steady-state activation ofIK(Ca)at defined Ca2+concentrations.Conductance was calculated using equation (2.3). To determine Gmax, conductances were fit to a first- order Boltzmann equation (2.4) and calculated as a fraction of Gmax. Normalized conduc- tances were fit to a first-order Boltzmann equation (2.4) yielding in following voltages for half-maximal activation. All values are are expressed as mean ± SD.
uPNs type I LNs type IIa LNs type IIb LNs
[Ca
2+]
i(µM) V
0.5(act)(mV)
56 125 ± 9 – – –
143 100 ± 11 58 ± 2 215 ± 1 113 ± 3
540 69 ± 2 – – –
1800 50 ± 2 – 87 ± 1 62 ± 2
defined [Ca
2+]
iof 1.8 mM, V
0.5(act)equales 87 mV in type IIa LNs and 62 mV in type IIb LNs (Fig. 3.4A).
Elevation of [Ca
2+]
iin this extent occure only in very local spatiotemporal do-
mains close to a calcium source (Augustine et al., 2003). The [Ca
2+]
iis strictly
controlled as calcium serves as second messenger signal with diverse effects on
enzyme activity, gene expression, cell growth, and cell death via apotosis. Since
K
Cachannels are activated by I
Ca, steady-state activation of I
K(Ca)with calcium
influx through Ca
Vchannels should resemble more physiological conditions.
3 Results
-60 mV +90 mV 100 ms
10 nA
[Ca2+]i = 1800 µM
A
[Ca2+]i = 540 µM [Ca2+]i = 143 µM [Ca2+]i = 56 µM
-60 mV +60 mV 100 ms10 nA
1800540 14356 [Ca2+]i (µM)
B
G/Gmax
EM (mV)
C
1.0 0.6 0.2200 150 100 50 0 -50
1800540 14356 [Ca2+]i (µM)
V0.5(act) (mV)
[Ca2+]i (mM)
D
120 100 80 602.0 1.6 1.2 0.8 0.4 0
Figure 3.3. Voltage dependence ofIK(Ca)from uPNs. (A) Current traces of steady-state activation from four uPNs with distinct [Ca2+]iapplied via the recording pipette. (B) Cur- rent traces elicited by a depolarizing voltage pulse to 60 mV with different [Ca2+]i. (C) G/Vrelations of steady-state activation with different [Ca2+]i. Conductances were calcu- lated according to equation (2.3) and fit to a first-order Boltzmann equation (2.4). Con- ductances were calculated as a fraction of maximal conductance and again fit to a first- order Boltzmann equation to determine voltages for half-maximal activation (V0.5(act)).
(D) Voltage of half-maximal activation as a function of [Ca2+]i. This figure was kindly provided by Dr. Cathleen Bradler.
400 G/Gmax
EM (mV)
A
1.0 0.6 0.2200 150 100 50 0
-50 300
type IIb LN 1800 type IIb LN 143 type IIa LN 143 type IIa LN 1800
250 350
[Ca2+]i (µM)
G/Gmax
EM (mV)
B
1.0 0.6 0.2200 150 100 50 0
-50 300 400
uPNtype I LN type IIa LN type IIb LN
250 350
[Ca2+]i 143 µM
Figure 3.4. Voltage dependence ofIK(Ca)from different AL interneurons. (A)G/Vrela- tion from steady-state activation ofIK(Ca)from type IIa and b LNs with 1.8 mM or 143 µM [Ca2+]i. (B) Comparision of G/V relations for steady-state activation from different AL interneurons with 143 µM [Ca2+]i. Conductances were calculated according to equation (2.3) and fit to a first-order Boltzmann equation (2.4). Conductances were calculated as a fraction of maximal conductance and again fit to a first-order Boltzmann equation to determine voltages for half-maximal activation (V0.5(act)).
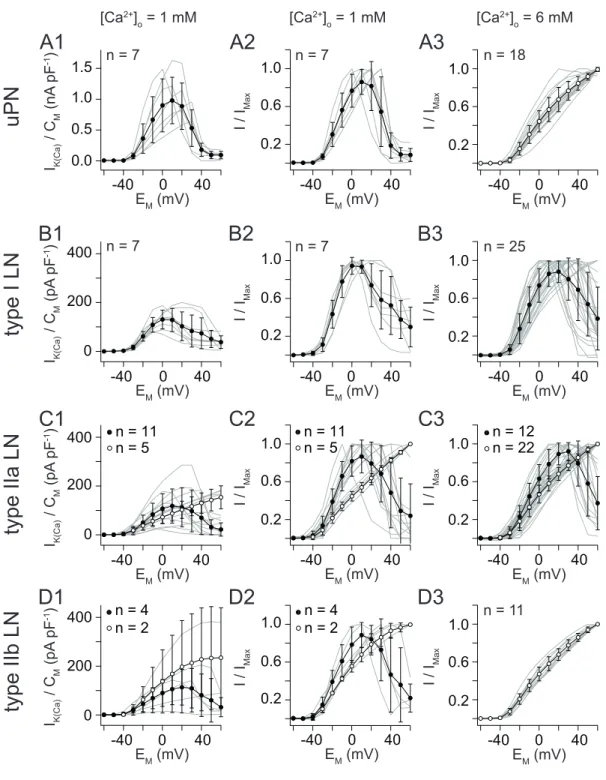
3.2.2 Steady-state activation with calcium influx
I
K(Ca)was isolated using a combination of pharmacological tools, appropriate holding potential and current subtraction protocols. The preparation was super- fused with saline containing 10
-6M TTX and 10
-2M 4-AP to abolish voltage ac- tivated sodium (I
Na) and transient potassium currents (I
A). The [Ca
2+]
Owas ad- justed to 6 mM or 1 mM, respectively. To determine current-voltage relations (I/V relations), series of 300 ms voltage pulses between -60 and +60 mV were applied in 10 mV increments, while neurons were held at -60 mV between voltage pro- tocols. Afterwards, another series was recorded with saline containg 5 × 10
-4M CdCl
2additionally, which completely abolished voltage activated Ca
2+currents (I
Ca). Accordingly, under Cd
2+treatment I
K(Ca)was blocked too and only the delayed rectifying K
+outward current (I
K(V)) was recorded. I
K(V)was digitally subtracted from the ’untreated’ series and the resulting current profile was de- fined as I
K(Ca)(see Fig. 3.5 – 3.8A –E). The current profiles were dominated by I
K(Ca)but contain underlying I
Ca. Experiments contributing to this section were performed by Dr. Cathleen Bradler, Andreas Klein, and myself. The results are summarized in table 3.2.
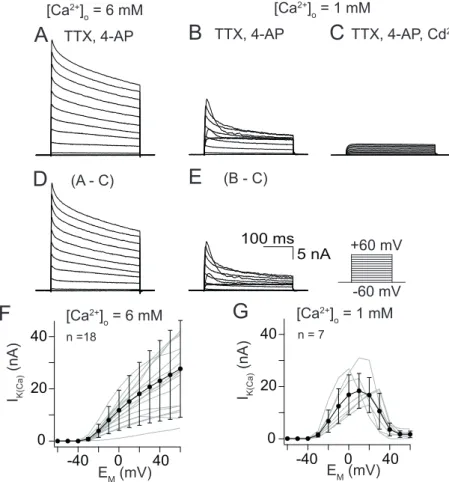
Uniglomerular Projection Neurons
During a 300 ms voltage pulse, I
K(Ca)consisted of a sustained, noninactivating component and a transient component, inactivating at diverse time scales (Fig.
3.5D and E). Activated by influx of 6 mM [Ca
2+]
O, I
K(Ca)amplitudes increased
with progressively depolarizing voltage pulses (Fig. 3.5D) and reached a max-
imal current amplitude of 28 ± 18 nA at 60 mV. At 20 mV an average current
amplitude of 18 ± 12 nA (Fig. 3.5F) was achieved. With 1 mM [Ca
2+]
O, peak cur-
rents were reached at 17 ± 11 mV and decreasing I
K(Ca)amplitudes were observed
with progressively depolarizing voltage pulses (Fig. 3.5E). This is reflected in an
inverted U-shape of the I/V relation (Fig. 3.5G). An average maximal current am-
plitude of 18 ± 7 nA was reached at 10 mV.
3 Results
40
F
4020
0
0 -40 IK(Ca) (nA)
EM (mV)
n =18
[Ca2+]o = 6 mM
G
IK(Ca) (nA)
EM (mV) 40
20
0
40 0 -40
n = 7
[Ca2+]o = 1 mM TTX, 4-AP
A
(A - C)
D
[Ca2+]o = 6 mM
C
TTX, 4-AP, Cd2+B
-60 mV +60 mV
E
(B - C)100 ms 5 nA TTX, 4-AP
[Ca2+]o = 1 mM
Figure 3.5. Steady-state activation ofIK(Ca) from uPNs.(A – E) Current traces of steady- state activation elicited by 300 ms depolarizing voltage steps from -60 mV to 60 mV in 10 mV increments. (A) Current traces elicited by influx of 6 mM [Ca2+]O. (B) Current traces elicited by influx of 1 mM [Ca2+]O. (C) Current traces elicited by the same depolar- izing voltage steps as A and B but during additional application of 5×10⁻⁴M CdCl2. (D – E) Digital subtraction of the CdCl2treated series from ’untreated’ series yielded inIK(Ca) activated by 6mM [Ca2+]O(D) and 1mM [Ca2+]O (E). (F)I/Vrelation of steady-state acti- vation with 6 mM [Ca2+]O. (G)I/Vrelation of steady-state activation with 1 mM [Ca2+]O.
TTX, 4-AP
A
(A - C)
D
[Ca2+]o = 6 mM [Ca2+]o = 1 mM
C
TTX, 4-AP, Cd2+B
-60 mV +60 mV
E
(B - C)2 nA 100 ms TTX, 4-AP
IK(Ca) (nA)
EM (mV)
n = 25
F
2010
0 -40 0 40
[Ca2+]o = 6 mM
G
IK(Ca) (nA)
EM0 (mV)40 -40
n = 7
20 10 0
[Ca2+]o = 1 mM
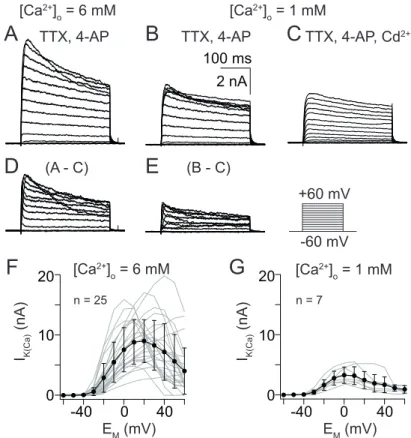
Figure 3.6. Steady-state activation ofIK(Ca) from type I LNs. (A – E) Current traces for steady-state activation elicited by 300 ms depolarizing voltage steps from -60 mV to 60 mV in 10 mV increments. (A) Current traces elicited with 6 mM [Ca2+]O. (B) Current traces elicited with 1 mM [Ca2+]O. (C) Current traces elicited during additional applica- tion of 5×10⁻⁴M CdCl2. (D – E) Digital subtraction of the CdCl2treated series from ’un- treated’ series yielded inIK(Ca)activated by influx of 6mM [Ca2+]O(D) and 1mM [Ca2+]O (E). (F) I/V relation of steady-state activation with 6 mM [Ca2+]O. (G) I/V relation of steady-state activation with 1 mM [Ca2+]O.
Type I LNs
With 6 mM [Ca
2+]
O, decreasing I
K(Ca)amplitudes were observed at progressively
depolarizing voltage pulses (Fig. 3.6D and E). Type I LNs displayed the lowest
current amplitudes compared to other AL interneurons. With 6 mM [Ca
2+]
O, a
maximal I
K(Ca)amplitude of 9 ± 4 nA was reached at 28 ± 17 mV and decreasing
the [Ca
2+]
Oto 1 mM shifted the voltage of maximal current activation to more
negative potentials (Fig. 3.6F and G). With 1 mM [Ca
2+]
O, a maximal current
amplitude of 3 ± 1 nA was reached at 5 ± 11 mV.
3 Results
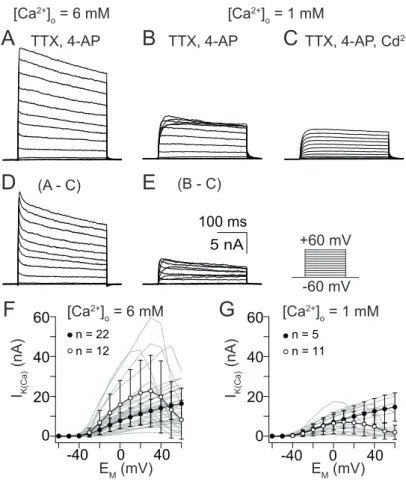
Type II LNs
The most diverse current voltage relation was observed within the type IIa LN population. With 6 mM [Ca
2+]
O, I
K(Ca)amplitude increased with progressively depolarizing voltage pulses (Fig. 3.7D) in the major part of neurons and a max- imal current amplitude of 16 ± 8 nA was reached at 60 mV (n = 22, Fig. 3.7F).
However, 12 out of 34 recorded type IIa LNs displayed decreasing current ampli- tude with progressively depolarizing voltage steps, maximal current amplitudes of 23 ± 18 nA were reached at 28 ± 10 mV (n = 12, Fig. 3.7F). When [Ca
2+]
Owas reduced to 1 mM, the major part of type IIa LNs displayed decreasing I
K(Ca)amplitudes with progressively depolarizing voltage steps and a peak current of 7 ± 6 nA was reached at 13 ± 17 mV (n = 11, Fig. 3.7G). However, in five out of 16 investigated type IIa LNs, I
K(Ca)amplitudes continued to increase with progres- sively depolarizing voltage pulses and reached a maximal amplitude of 15 ± 7 nA at 60 mV (n = 5, Fig. 3.7G).
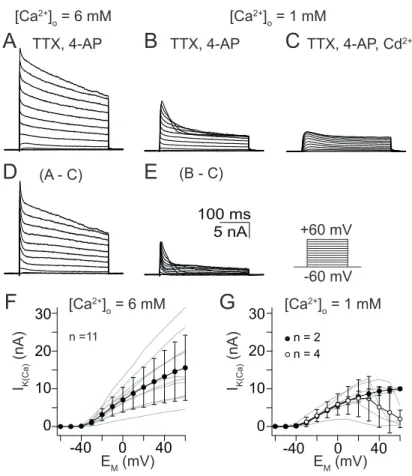
By contrast, all type IIb LNs displayed increasing I
K(Ca)amplitudes with pro- gressively depolarizing voltage steps when activated by simultaneous influx of 6 mM [Ca
2+]
O. Maximal current amplitude of 16 ± 9 nA was reached at 60 mV (Fig. 3.8 F). Diluting the [Ca
2+]
Oto 1 mM shifted the voltage of peak current acti- vation to more negative potentials, a maximal current amplitude of 7 ± 5 nA was reached at 23 ± 15 mV (n = 4, Fig. 3.8 G).
With 6 mM [Ca
2+]
OuPNs, type IIb LNs and the major part of type IIa LNs dis-
play increasing I
K(Ca)amplitudes with progressively depolarizing voltage pulses,
reflected in a linearly increasing I/V relation. Decreasing the [Ca
2+]
Oto 1 mM
altered the I/V relation in all uPNs as well as the major part of type IIa and type
IIb LNs to an inverted U-shaped I/V relation. The inverted U-shaped I/V relation
mirrored the I/V relation of I
Caas the driving force for Ca
2+declined at higher
voltages (Husch et al., 2009a). In type I LNs, a bell-shaped I/V relation of I
K(Ca)was observed with both applied [Ca
2+]
O. Assuming that influx of 6 mM [Ca
2+]
Owas high enough to uncouple I
K(Ca)activation from I
Ca, 1 mM [Ca
2+]
Oconstitute
appropriate conditions to study the biophysical properties of I
K(Ca).
TTX, 4-AP
A
(A - C)
D
[Ca2+]o = 6 mM [Ca2+]o = 1 mM
C
TTX, 4-AP, Cd2+B
-60 mV +60 mV
E
(B - C)TTX, 4-AP
100 ms 5 nA
40 20
0 -40 0 40 IK(Ca) (nA)
EM (mV)
F
[Ca2+]o = 6 mMn = 22 n = 12
60
G
IK(Ca) (nA)
EM (mV) 40
20 0
40 0 -40
[Ca2+]o = 1 mM
n = 5 n = 11
60
Figure 3.7. Steady-state activation ofIK(Ca)from type IIa LNs. (A – E) Current traces for steady-state activation elicited by 300 ms depolarizing voltage steps from -60 mV to 60 mV in 10 mV increments. (A) Current traces elicited with 6 mM [Ca2+]O. (B) Current traces elicited with 1 mM [Ca2+]O. (C) Current traces elicited by the same depolarizing voltage steps as A and B but during additional application of 5×10⁻⁴M CdCl2. (D – E) Digital subtraction of the CdCl2 treated series from ’untreated’ series yielded in IK(Ca) activated by influx of 6mM [Ca2+]O (D) or 1mM [Ca2+]O (E). (F)I/V relation for steady- state activation with 6 mM [Ca2+]O. (G)I/Vrelation for steady-state activation with 1 mM [Ca2+]O. Open circles◦indicate bell-shapedI/Vrelation, filled circles • indicate linearI/V relation.
![Figure 3.3. Voltage dependence of I K(Ca) from uPNs. (A) Current traces of steady-state activation from four uPNs with distinct [Ca 2+ ] i applied via the recording pipette](https://thumb-eu.123doks.com/thumbv2/1library_info/3634520.1502380/31.892.152.786.161.415/figure-voltage-dependence-current-activation-distinct-applied-recording.webp)
![Table 3.2. Parameters of steady-state activation with influx of 1 and 6 mM [Ca 2+ ] O](https://thumb-eu.123doks.com/thumbv2/1library_info/3634520.1502380/38.892.183.759.544.843/table-parameters-steady-state-activation-influx-mm-ca.webp)