A TLAS-CONF-2020-014 01 June 2020
ATLAS CONF Note
ATLAS-CONF-2020-014
27th May 2020
Test of the universality of τ and µ lepton couplings in W boson decays from t t ¯ events at 13 TeV with the
ATLAS detector
The ATLAS Collaboration
The Standard Model of particle physics constitutes our current best understanding of physics at the smallest scales. A fundamental axiom of this theory is the universality of the couplings of the different generations of leptons to the electroweak gauge bosons. The measurement of the ratio R(τ/µ) = BR (W → τν
τ)/ BR (W → µν
µ) constitutes an important test of this axiom. A measurement of this quantity from an approach using di-leptonic t t ¯ events is presented based on 139 fb
−1of data recorded with the ATLAS detector in the years 2015 to 2018. Muons originating from W bosons and those originating via an intermediate τ are distinguished using the lifetime of the τ lepton, through the muon transverse impact parameter, and differences in the muon transverse momentum spectra. The value of R(τ/µ) is found to be 0 . 992 ± 0 . 013 [± 0 . 007 (stat) ± 0 . 011 (syst) ] and therefore is in agreement with the hypothesis of universal lepton couplings as postulated in the Standard Model. This forms the most precise measurement of this ratio, and the only such measurement from the Large Hadron Collider, to date.
© 2020 CERN for the benefit of the ATLAS Collaboration.
Reproduction of this article or parts of it is allowed as specified in the CC-BY-4.0 license.
1 Introduction
A fundamental axiom of the Standard Model (SM) is the universality of the lepton couplings, g
`( ` = e, µ, τ ), to the electroweak gauge bosons. This paper presents a test of this fundamental assumption by measuring the ratio of the branching ratios, R(τ/µ) = BR (W → τν
τ)/ BR (W → µν
µ) for on-shell W -bosons. The measurement is performed in the top + anti-top quark pair ( t¯ t ) final state, assuming BR (t → W q) = 100%, using a tag and probe technique between the two W bosons produced in the t¯ t decay. The transverse displacement of the τ decay vertex and the different muon transverse momentum ( p
T) spectra are used to separate muons from the processes W → τν
τ→ µν
µν
τν
τand W → µν
µ. This is achieved by utilizing the precise reconstruction of muon tracks.
This measurement relies on the knowledge of the branching ratio of τ -leptons decaying to muons to extrapolate to the full W → τν
τbranching ratio. This was measured to high precision by the Large Electron-Positron Collider (LEP) experiments [1–4]. A central value of ( 17 . 39 ± 0 . 04 ) % is found from a fitted average of the results [5]. This is used as the central value for this branching ratio in the analysis and a fractional uncertainty of 0.23% is added to the result, which forms a sub-dominant component to the overall uncertainty.
Previously R(τ/µ) has been measured by the four experiments at LEP, yielding a combined value of 1 . 070 ± 0 . 026 [6]. This deviates from the SM expectation of unity
1by 2.7 σ , motivating the precise measurement of this ratio at the Large Hadron Collider (LHC). Other experimental measurements of the ratio BR (W → τν
τ)/ BR (W → eν
e) or BR (W → τν
τ)/ BR (W → `ν
`) , where ` is either light lepton, do not reach the precision of the LEP results [7–11]. The equivalent ratio for the two light generations, BR (W → µν
µ)/ BR (W → eν
e) , has been accurately measured by LEP [6], LHCb [12] and ATLAS [13], and is found to be consistent with the SM prediction. Additionally, while most low-energy experiments show very good agreement with the hypothesis of universality of lepton couplings [14], some recent results from LHCb [15, 16], Belle [17–19] and BaBar [20, 21] show some tension with the SM, further motivating this analysis.
The note is structured as follows. In §2 the ATLAS experiment and recorded data sample is described.
The simulated samples are described in §3. The data-driven normalisation of the primary backgrounds is described in §5 followed by the systematic uncertainties and fit setup in §6. The results are presented in §7 and conclusions are given in §8.
2 Experimental set-up
The ATLAS experiment [22] at the LHC is a multi-purpose particle detector with a forward-backward symmetric cylindrical geometry and a near 4 π coverage in solid angle.
2It consists of an inner tracking detector surrounded by a thin superconducting solenoid providing a 2 T axial magnetic field, electromagnetic and hadron calorimeters, and a muon spectrometer. The inner tracking detector covers the pseudorapidity range |η | < 2 . 5. It consists of silicon pixel, silicon microstrip, and transition radiation tracking detectors,
1
The phase space effects due to the masses of the decay products on this ratio are very small ( ∼ 5 × 10
−4) and hence can be neglected [5].
2
ATLAS uses a right-handed coordinate system with its origin at the nominal interaction point (IP) in the centre of the detector and the z -axis along the beam pipe. The x -axis points from the IP to the centre of the LHC ring, and the y -axis points upwards.
Cylindrical coordinates (r, φ) are used in the transverse plane, φ being the azimuthal angle around the z -axis. The pseudorapidity is defined in terms of the polar angle θ as η = − ln tan ( θ / 2 ) . Angular distance is measured in units of ∆R ≡ p
(∆η )
2+ (∆φ )
2.
and the innermost layer of the pixel detector is at an average radius of 33 mm from the beam line.
Lead/liquid-argon (LAr) sampling calorimeters provide electromagnetic (EM) energy measurements with high granularity. A steel/scintillator-tile hadron calorimeter covers the central pseudorapidity range ( |η| < 1 . 7). The end-cap and forward regions are instrumented with LAr calorimeters for both EM and hadronic energy measurements up to |η| = 4 . 9. The muon spectrometer surrounds the calorimeters and is based on three large air-core toroidal superconducting magnets with eight coils each. The field integral of the toroids ranges between 2.0 and 6.0 T m across most of the detector. The muon spectrometer includes a system of precision tracking chambers and fast detectors for triggering. A two-level trigger system is used to select events. The first-level trigger is implemented in hardware and uses a subset of the detector information to reduce the accepted rate to 100 kHz. This is followed by a software-based trigger that reduces the accepted event rate to 1 kHz on average, depending on the data-taking conditions.
The proton–proton ( pp ) collision data analysed were recorded with the ATLAS detector from 2015 to 2018 at a centre-of-mass energy of
√ s = 13 TeV. The average number of interactions per bunch crossing was 33.7. Events were selected by single-lepton triggers [23–25] requiring either a single high p
Tisolated electron or muon. After the application of data-quality requirements [26], the data sample corresponds to an integrated luminosity of 139 fb
−1with an uncertainty of 1.7% [27] obtained using the LUCID-2 detector [28] for the primary luminosity measurements.
3 Monte Carlo simulated samples
Samples of simulated events are used to model the SM processes. The production of t¯ t and single top quark events is modelled using the PowhegBox v2 [29–32] generator at NLO with the NNPDF3.0NLO [33] set of parton distribution functions (PDFs). These events are processed with Pythia v8.230 [34] using the A14 tune [35] and the NNPDF2.3lo set of PDFs [36]. The decays of bottom and charm hadrons are modelled using the EvtGen v1.6.0 [37] program. In t¯ t events the h
dampparameter
3is set to 1.5 m
top[38]. The t¯ t process is normalised to the inclusive cross section calculation at next-to-next-to-leading order (NNLO) in QCD including the resummation of next-to-next-to-leading logarithmic (NNLL) soft-gluon terms from Top++2.0 [39–45] and an additional re-weighting is applied to either the top- or anti-top-quark p
Tto match the calculation at NNLO in QCD with NLO electroweak corrections [46]. The single top quark production processes are normalised to the inclusive cross sections calculated at NLO in QCD with NNLL soft gluon corrections [47, 48]. For single top quark production in the Wt -channel events, the diagram removal scheme [49] is used to remove overlap with t¯ t production. In all samples the top mass is 172.5 GeV.
The production of V (W, Z) +jets is simulated with the Sherpa v2.2 [50, 51] generator using NLO-accurate matrix elements for up to two jets, and LO-accurate matrix elements for up to four jets calculated with the Comix [52] and OpenLoops [53, 54] libraries. They are matched with the Sherpa parton shower [55]
using the MEPS@NLO prescription [56–59] with the set of tuned parameters developed by the Sherpa authors. The NNPDF3.0nnlo set of PDFs [33] is used and the samples are normalised to a NNLO prediction [60]. Smaller backgrounds of di-boson processes and t¯ t + V are simulated with Sherpa v2.2 and MadGraph5_aMC@NLO v2.3.3 [61] interfaced with Pythia v8.210, respectively. All processes are normalised to their highest order available cross-sections [62].
3
The h
dampparameter is a resummation damping factor and one of the parameters that controls the matching of Powheg matrix
elements to the parton shower and thus effectively regulates the high- p
Tradiation against which the t t ¯ system recoils.
All samples were passed through a detailed simulation of the ATLAS detector based on Geant4 [63].
Furthermore, simulated inelastic proton-proton collisions were overlaid to model additional collisions in the same and neighbouring bunch crossings (pile-up).
4 Event selection, object identification and calibration
Events in the signal region contain either one electron and one muon of opposite electric charge ( e - µ channel), or two muons of opposite electric charge ( µ - µ channel). A tag and probe analysis is performed probing whether a muon comes from a prompt decay, W → µν
µ, or via an intermediate tau, W → τν
τ→ µν
µν
τν
τ, based on its reconstructed properties.
Muons are reconstructed using combined fits of inner detector [64, 65] and muon spectrometer tracks [66].
They are required to satisfy the medium identification critera. Additionally they are required to be isolated by passing strict criteria on both the sum of the transverse momentum of other tracks within a cone of 0.3 in ∆R and of calorimeter deposits within a cone of ∆R < 0 . 2. Tag muons are used to trigger and select the event, while probe muons are used to measure R(τ/µ) . Tag muons are required to have p
µT
> 27 . 3 GeV to pass the trigger thresholds, while probe muons are required to have p
µT
> 5 GeV. Both tag and probe muons are required to have |η| < 2 . 5 and to be close to the primary vertex
4with a distance of closest approach in r - z plane of less than 0.3 mm and a transverse impact parameter with respect to the beamline, |d
µ0
| , of less than 0.5 mm. Additional criteria are placed on the compatibility of the momenta measured in the inner detector and in the muon spectrometer to remove reconstructed muons which result from decays in-flight of π
±and K
±.
Electrons are reconstructed from clusters of calorimeter cells and inner detector tracks [67]. They are required to pass the “tight" identification criteria and additionally to pass strict isolation criteria. Tag electrons are required to have p
eT
> 27 GeV, to pass the trigger criteria and to satisfy |η| < 2 . 47, excluding the calorimeter crack region, 1 . 37 < |η| < 1 . 52. They are also required to pass the same criteria on the distance of closest approach to the primary vertex in the transverse and r - z planes as muons.
Hadronic jets are built using the anti- k
talgorithm [68] from clusters of calorimeter cells [69] at the electromagnetic energy scale with a radius parameter of 0.4, and are calibrated to the energy scale of identical jets created from stable truth particles excluding muons and neutrinos. Additional corrections are applied to jets in data to account for differences in the energy scale between data and simulation [70].
The jets in the simulated samples are smeared to correct for differences in the jet resolution between data and simulation. For jets with 25 < p
T< 60 GeV and |η| < 2 . 4, pile-up suppression requirements in the form of a jet vertex tagger [71] are applied. Only jets with p
T> 25 GeV and |η| < 2 . 5 are considered in the analysis. To classify jets as containing a b -hadron, the 70% efficiency working point of the MV2c10 algorithm [72, 73] is used.
An overlap removal procedure is applied to resolve the ambiguity of lepton signals in the calorimeter being reconstructed as hadronic jets as described in Ref. [74].
Events are required to be triggered by the electron in the e - µ channel or by the tag muon in the µ - µ channel.
This ensures that there is no trigger bias on the probe muon. For the µ - µ channel if both leptons satisfy the tag and probe criteria both muons are used as probes . Events with more than two leptons are rejected.
Additionally it is required that there are at least two reconstructed hadronic jets which are identified as
4
The primary vertex is defined as the vertex with the highest Σp
2T
of the tracks associated with it.
containing a b -hadron. Finally, to reduce backgrounds from the Z -boson and hadron decays, events with di-muon mass 85 < m
µµ< 95 GeV are excluded in the µ - µ channel only, and events with di-lepton mass m
``< 15 GeV are excluded in both channels.
The muon transverse impact parameter, | d
µ0
| , the closest distance of approach in the x - y plane of the track to the beam-line
5has particular importance for this analysis. It is defined with respect to the beam-line rather than the primary vertex such that the resolution of |d
µ0
| is not related to the vertex x, y resolution which is process dependent. The shape of the |d
µ0
| distribution of prompt muons can be therefore determined in a fully data-driven method using Z → µµ events and then applied to the signal t t ¯ selection. Events with two muons passing the same kinematic criteria as the signal region, with an additional invariant mass requirement of 85 < m
µµ< 100 GeV are selected. Additionally the jet criteria are not applied. This gives a large sample of ∼ 95 million prompt muons with a purity of > 99 . 9%. The shape of the | d
µ0
| distribution is then taken from this data after subtracting the expected contributions from simulation of processes with significant parent lifetimes, primarily Z → ττ . These |d
µ0
| templates are extracted in 33 bins in p
µT
and
|η| to capture the dependence of the distribution on these variables. Separate templates are are used for 2015+2016, 2017 and 2018 data to account for differences in the beam conditions and possible differences in the alignment of the inner detector. The closure of this method is probed in simulation by extracting templates in simulated Z → µµ events and testing how well this agrees with the shape in simulated t t ¯ events.
Additionally, using this selection of prompt muons, the Gaussian core of the |d
µ0
| resolution is estimated in data and simulation, by fitting the |d
µ0
| distribution in the range |d
µ0
| < 0 . 02 mm. For p
µT
∼ 20 GeV the resolution is ∼ 14 µ m. Corrections are applied to the simulated samples of the processes with significant displacement: muons from τ decays and from hadron decays, to account for differences in the resolution of the detector between the data and simulation. For the range of | d
µ0
| values considered in this analysis, the resolution measured from prompt muons can be applied to those with significant displacement.
5 Background normalisation
The normalisation of the residual Z (→ µµ) +jets background in the µ - µ channel is extracted from the data by applying the same event selection, including the hadronic jet requirements, but without the criteria on m
µµand then fitting the peak in the invariant mass of the di-muon system over the range 50 < m
µµ< 140 GeV. A Voigt profile [75] is used for the Z → µµ resonance and a 3rd-order Chebychev polynomial for the background, which provides a good description of the data. Other functions are tested to provide a systematic uncertainty which is combined with the statistical uncertainties. The normalisation factor required to scale the simulated sample to data is found to be 1 . 36 ± 0 . 01. The di-muon mass is shown in figure 1 after this normalisation is applied. This normalisation is also applied to the very small Z (→ ττ )+jets background.
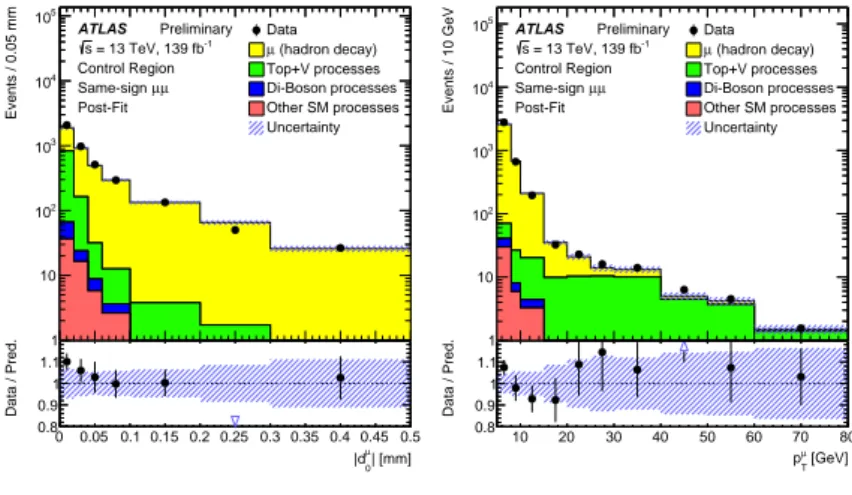
The most significant background to this measurement at large values of |d
µ0
| comes from events in which the probe muon does not originate from a W -decay but rather from the decay of b - or c -hadrons, or more rarely from decays in-flight of π
±and K
±, primarily in semi-leptonic t¯ t events. These muons are referred to as µ (hadron decay) . A data-driven method is used to control the normalisation of this background from a control region, which requires the same analysis selection but where the two leptons have the same-sign of electric charge. This results in a sample with a high purity of this µ (hadron decay) background. The largest source of µ (hadron decay) is from b− hadron decays, and this is expected to contribute equally to same-sign and opposite-sign selections, and the other significant source, c− hadrons, has a significant component in
5
The beam-line is the path through the detector drawn by the centre in x, y of the luminous region.
both selections although they are not equal. The extrapolation from same-sign to opposite-sign selections is taken from simulation. In the same-sign control region there is also a significant background at high p
µT
from t¯ t + V which are not from hadron decays, and t t ¯ through charge mis-identification in the e - µ channel, such that before extracting the normalisation of the µ (hadron decay) background a correction factor is applied to these processes based on the number of events observed with probe muon p
µT
> 30 GeV. Normalisation factors, to scale the simulation to data, for the µ (hadron decay) background are found to be 1.39 (1.37) in the e - µ ( µ - µ ) channels, respectively. Figure 2 shows the simulation and data are consistent within uncertainties in the control region, providing confidence that the differential distributions of p
µT
and |d
µ0
| are well-modelled.
60 80 100 120 140 160
[GeV]
µ
mµ
0.9 0.95 1 1.05
Data / Pred.
0 10000 20000 30000 40000 50000
Events / 2.5 GeV
ATLAS Preliminary = 13 TeV, 139 fb-1
s
Z Normalisation Selection µ
µ Post-Fit
Data µ µ
→ Z Top
Di-Boson processes Other SM processes Uncertainty
Figure 1: The m
µµdistribution which is used to extract the Z → µµ nor- malisation, which is applied. Blue bands indicate the systematic uncer- tainties with the constraints from the analysis fit of the signal region data applied.
0 0.05 0.1 0.15 0.2 0.25 0.3 0.35 0.4 0.45 0.5
| [mm]
µ
|d0
0.8 0.9 1 1.1
Data / Pred.
1 10 102
103
104
105
Events / 0.05 mm
ATLAS Preliminary = 13 TeV, 139 fb-1
s Control Region
µ µ Same-sign Post-Fit
Data (hadron decay) µ
Top+V processes Di-Boson processes Other SM processes Uncertainty
(a): Probe muon |d
µ0
| distribution
10 20 30 40 50 60 70 80
[GeV]
µ
pT
0.8 0.9 1 1.1
Data / Pred.
1 10 102
103
104
105
Events / 10 GeV
ATLAS Preliminary = 13 TeV, 139 fb-1
s Control Region
µ µ Same-sign Post-Fit
Data (hadron decay) µ
Top+V processes Di-Boson processes Other SM processes Uncertainty
(b): Probe muon p
µT
distribution Figure 2: The probe muon |d
µ0
| and p
µT
distributions in the µ - µ same-sign µ (hadron decay) control region. The extracted normalisation factors have been applied. Blue bands indicate the systematic uncertainties with the constraints from the analysis fit of the signal region data applied.
6 Systematic uncertainties and fit setup
A fit is then performed in three bins in p
µT
(5-10, 10-20, 20-250 GeV) and eight bins in the transverse impact parameter, |d
µ0
| , of the probe muon (boundaries of: 0, 0.01, 0.02, 0.03, 0.04, 0.06, 0.09, 0.15, 0.5 mm) for each channel ( e - µ and µ - µ ), making 48 bins in total, to extract the ratio of the number of events in which the probe muon comes from the process W → τν
τ→ µν
µν
τν
τto those which come from the process W → µν
µ. A profile likelihood fit [76] is used to extract the measured value of R(τ/µ) . The negative- log-likelihood minimisation is performed with several unknown (nuisance) parameters representing the statistical and systematic uncertainties which can be modified by the fit. Additionally two fit parameters are freely floating: R(τ/µ) and k(t¯ t) , the top normalisation scaling factor. The k(t¯ t) parameter is a constant scaling factor applied to the normalisation of both the prompt - and τ -muon t t ¯ and Wt components whilst R(τ/µ) only affects the τ -muon components, and both are applied across all bins and in both channels.
This means that R(τ/µ) forms the parameter of interest and it is not affected by the overall normalisation of the t¯ t and Wt processes.
Many systematic uncertainties are correlated between the prompt -muon and τ -muon templates, such
that despite being included in the fit they have minimal impact on R(τ/µ) . This includes, for example,
uncertainties related to jet reconstruction, flavour tagging and trigger efficiencies. Only the remaining dominant uncertainties are described in detail in the following.
An uncertainty on the data-driven templates for the | d
µ0
| distribution of prompt muons is derived to account for the fact that the templates are constructed in a Z -enriched selection, but applied to a t t ¯ final state. Due to differences in the hadronic environment around the lepton between Z and t t ¯ final states and the finite binning in p
µT
and |η| , which may not be able to encapsulate the full shape information, small biases can exist in the template distributions. The size of such a possible bias is estimated from the full difference between Z and t t ¯ prompt | d
µ0
| templates in simulation. This uncertainty is split into two components corresponding to the tail, |d
µ0
| & 0 . 05 mm, and core, | d
µ0
| . 0 . 05 mm, to prevent the data from constraining the uncertainty using the full |d
µ0
| distribution.
Uncertainties on the µ (hadron decay) background normalisation in the e - µ ( µ - µ ) channels are: 4% (4%) due to the limited size of the same-sign dataset; 8% (3%) due to the choice of generators used; and 1.0% (1.3%) due the uncertainty in the subtraction of the other processes in the same-sign region. The uncertainties associated with the Z +jets normalisation derived from data and the higher order cross section uncertainties, including that on the integrated luminosity, applied to all other backgrounds estimated from simulation are also included in the fit but have minor impact on the result.
Uncertainties are derived on the prompt -, τ → µ and µ (hadron decay) shapes and yields due to the choices in t¯ t modelling in simulated samples. The total yield of the prompt - and τ -muon templates is floating in the fit, but different generators or scale choices can result in changes to the modelling of the muon p
µT
, and subsequently the |d
µ0
| distribution, so that there can be relative changes of the prompt - and τ -muon template yields in each bin. For the µ (hadron decay) background, in addition to the uncertainties on the normalisation, there can be changes to the muon p
µT
modelling and the relative fractions of muons from different sources, both of which can change the shape of |d
µ0
| . The uncertainties due to the choice of generator for all of these processes are estimated by varying different components of the modelling in a factorised way: varying the amount of inital (final) state radiation according to allowed values from the A14 eigen-tune variations [35] of the corresponding strong coupling, α
s; varying the factorisation and renormalisation scales up by a factor of 2 and down by a factor of 0.5 to estimate potential missing higher-order QCD corrections; varying the Powheg h
dampparameter to estimate the resummation scale uncertainty; removing the NNLO in QCD top p
Treweighting; and changing the parton shower and hadronisation model to Herwig v7.04 [77, 78], using the H7UE set of tuned parameters [78] and the MMHT2014LO PDF set [79], referred to as t¯ t PS . In general the effects on prompt - and τ -muons (collectively referred to as “signal”) are treated as correlated and the effects on µ (hadron decay) are separated out. For the t¯ t PS uncertainty on the signal component several correlation models were considered to cover different possible scenarios. They were found to have little impact on the final result and an approach was chosen where the parton shower uncertainty is separated into four nuisance parameters: one each corresponding to low and middle probe-muon p
µT
bins used in the fit and two corresponding to the high p
µT
bin where the uncertainty is further separated into components relating to normalisation and shape differences.
The muon reconstruction and isolation efficiencies are measured in data and simulation using a tag and
probe method [66]. Scale factors are applied to the simulated samples to correct for the differences, and
the uncertainties on these scale factors are important for the extraction of R(τ/µ) . Additionally the amount
of pile-up simulated is varied through reweighting the simulated events to provide an uncertainty on how
well this is modelled [80].
7 Results
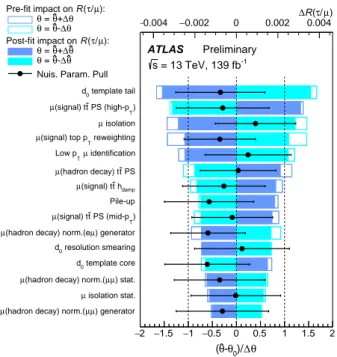
After the fit to data was performed, figure 3 shows the differential distributions of | d
µ0
| in the different regions for the prediction and data. The global goodness of fit is defined as twice the difference in negative log-likelihood with respect to a fit performed assuming the pre-fit expectation per degree of freedom, the value of which is 1.11 ( p -value of 0.29). The fit parameters with the largest post-fit (pre-fit) impact on R(τ/µ) are shown in figure 4, where post-fit (pre-fit) impact is defined by re-fitting the data with a given parameter fixed to its post-fit (pre-fit) value and measuring the change in uncertainty on R(τ/µ) . This gives a measure of which uncertainties dominate the overall precision on the measurement of R(τ/µ) . The uncertainties which have the largest effect on R(τ/µ) are those which directly change the fitted prompt - and τ -muon yields, or when they indirectly change the fitted values by changing the shape of the muon p
µT
or
| d
µ0
| distributions.
The total systematic uncertainty is 1.1%, including the uncertainty on the τ → µνν branching ratio, and the statistical uncertainty resulting from the dataset size is 0.7%. The three leading contibutions to the systematic uncertainty come from: the knowledge of the tail of the |d
µ0
| distribution (0.4%), the shape component of the t¯ t parton shower uncertainty in the highest p
µT
bin for prompt - and τ -muons (0.3%) and the uncertainty on the muon isolation efficiency (0.3%). There are small pulls on some of the parameters, but none are significant.
The measured value of R(τ/µ) is 0 . 992 ± 0 . 013 [± 0 . 007 (stat) ± 0 . 011 (syst) ] , which is the most precise measurement to date. The results are summarised in figure 5 with a comparison to the previous combination of LEP measurements.
The analysis was finalised prior to looking at the value of R(τ/µ) in data such that it was performed with
minimal bias. Also, it has been checked that the result is consistent with respect to different channels,
kinematic bins, data-taking periods and the charge of the probe lepton.
0 0.05 0.1 0.15 0.2 0.25 0.3 0.35 0.4 0.45 0.5
| [mm]
µ
|d0
0.9 0.95 1 1.05
Data / Pred.
1 10 102
103
104
105
Events / 0.01 mm
ATLAS Preliminary = 13 TeV, 139 fb-1
s
Signal Region
<10 GeV
µ
, 5<pT
µ e Post-Fit
Data (top) µ Prompt
(top) µ
→ τ
(hadron decay) µ
τ τ
→ Z
Other SM processes Uncertainty
0 0.05 0.1 0.15 0.2 0.25 0.3 0.35 0.4 0.45 0.5
| [mm]
µ
|d0
0.9 0.95 1 1.05
Data / Pred.
1 10 102
103
104
105
Events / 0.01 mm
ATLAS Preliminary = 13 TeV, 139 fb-1
s
Signal Region
<10 GeV
µ
, 5<pT
µ µ Post-Fit
Data (top) µ Prompt
(top) µ
→ τ
(hadron decay) µ
µ µ
→ Z
τ τ
→ Z
Other SM processes Uncertainty
0 0.05 0.1 0.15 0.2 0.25 0.3 0.35 0.4 0.45 0.5
| [mm]
µ
|d0
0.9 0.951 1.05
Data / Pred.
1 10 102
103
104
105
Events / 0.01 mm
ATLAS Preliminary = 13 TeV, 139 fb-1
s
Signal Region
<20 GeV
µ
, 10<pT
µ e Post-Fit
Data (top) µ Prompt
(top) µ
→ τ
(hadron decay) µ
τ τ
→ Z
Other SM processes Uncertainty
0 0.05 0.1 0.15 0.2 0.25 0.3 0.35 0.4 0.45 0.5
| [mm]
µ
|d0
0.9 0.951 1.05
Data / Pred.
1 10 102
103
104
105
Events / 0.01 mm
ATLAS Preliminary = 13 TeV, 139 fb-1
s
Signal Region
<20 GeV
µ
, 10<pT
µ µ Post-Fit
Data (top) µ Prompt
(top) µ
→ τ
(hadron decay) µ
µ µ
→ Z
τ τ
→ Z
Other SM processes Uncertainty
0 0.05 0.1 0.15 0.2 0.25 0.3 0.35 0.4 0.45 0.5
| [mm]
µ
|d0
0.9 0.951 1.05
Data / Pred.
1 10 102
103
104
105
106
Events / 0.01 mm
ATLAS Preliminary = 13 TeV, 139 fb-1
s
Signal Region
<250 GeV
µ
, 20<pT
µ e Post-Fit
Data (top) µ Prompt
(top) µ
→ τ
(hadron decay) µ
τ τ
→ Z
Other SM processes Uncertainty
0 0.05 0.1 0.15 0.2 0.25 0.3 0.35 0.4 0.45 0.5
| [mm]
µ
|d0
0.9 0.951 1.05
Data / Pred.
1 10 102
103
104
105
106
Events / 0.01 mm
ATLAS Preliminary = 13 TeV, 139 fb-1
s
Signal Region
<250 GeV
µ
, 20<pT
µ µ Post-Fit
Data (top) µ Prompt
(top) µ
→ τ
(hadron decay) µ
µ µ
→ Z
τ τ
→ Z
Other SM processes Uncertainty
Figure 3: The |d
µ0
| distributions for each tag lepton channel (left: eµ -channel, right: µµ -channel) and probe muon p
µT
bin (top: 5 < p
µT
< 10 GeV, middle: 10 < p
µT
< 20 GeV, bottom: 20 < p
µT
< 250 GeV) that enter the anaysis fit.
Plots are shown after the fit has been performed. Blue bands indicate the systematic uncertainties with the constraints
from the analysis fit applied.
−2 −1.5 −1 −0.5 0 0.5 1 1.5 2 θ
∆
0)/
θ θ- ( ) generator
µ µ (hadron decay) norm.(
µ
isolation stat.
µ ) stat.
µ µ (hadron decay) norm.(
µ
template core d0
resolution smearing d0
) generator µ (hadron decay) norm.(e µ
T) PS (mid-p t (signal) t µ
Pile-up hdamp
t (signal) t µ
PS t (hadron decay) t µ
identification
Tµ Low p
reweighting (signal) top pT
µ
isolation µ
T) PS (high-p t (signal) t µ
template tail d0
0.004
− −0.002 0 0.002 0.004
µ) τ/ (
∆R µ):
τ/ ( R Pre-fit impact on
θ
∆ θ+ θ =
θ
∆ θ- θ =
µ):
τ/ ( R Post-fit impact on
θ
∆ θ+ θ =
θ
∆ θ- θ =
Nuis. Param. Pull
ATLAS Preliminary = 13 TeV, 139 fb-1
s
Figure 4: The leading individual systematic uncertainties in- cluded in the fit ranked by their post-fit impact on R(τ/µ) . Solid (outlined) bars indicate the post-fit (pre-fit) impact on R(τ/µ) as indicated by the legend at the top of the plot. The difference between the pre- and post-fit reflects the constraint of the nuisance parameter, θ . The post-fit values of the nuisance parameters (pulls) and their post-fit uncertainties normalised to the pre-fit uncertainties are shown by the black point with errors.
0.98 1 1.02 1.04 1.06 1.08 1.1
) ν µ )/BR(W→ ν τ )=BR(W→ /µ R(τ ATLAS Preliminary
= 13 TeV, 139 fb-1
s
LEP (Phys.Rept. 532 119) ATLAS- this result
Statistical Error Systematic Error Total Error
Figure 5: A comparison of this measurement to that from LEP. A vertical dashed line indicates equal branching ratios to different lepton flavours.
8 Conclusions
A measurement of R(τ/µ) has been performed using t¯ t events in the di-lepton decay mode and a dataset corresponding to an integrated luminosity of 139 fb
−1of proton–proton collision data at
√ s = 13 TeV recorded with the ATLAS experiment at the LHC. The best fit observed value is
R(τ/µ) = 0 . 992 ± 0 . 013 [± 0 . 007 (stat) ± 0 . 011 (syst) ].
This agrees well with the SM prediction and is the most precise measurement of this ratio to date.
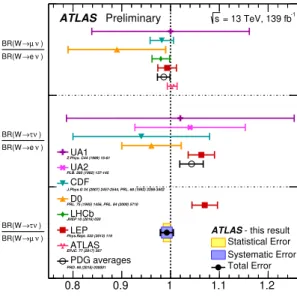
Appendix
Figure 6 shows the results of this analysis in the wider context of previous measurements of R(τ/µ) and equivalent measurements of the ratios R(τ/e) = BR (W → τν
τ)/ BR (W → eν
e) and R(µ/e) = BR (W → µν
µ)/ BR (W → eν
e) .
0.8 0.9 1 1.1 1.2
) ν µ BR(W→
) ν τ BR(W→
) eν BR(W→
) ν τ BR(W→
) eν BR(W→
) ν µ BR(W→
ATLAS Preliminary
UA1 UA2 CDF D0 LHCb LEP ATLAS PDG averages
Z.Phys. C44 (1989) 15-61
PLB. 280 (1992) 137-145
J.Phys.G 34 (2007) 2457-2544, PRL. 68 (1992) 3398-3402
PRL. 75 (1995) 1456, PRL. 84 (2000) 5710
JHEP 10 (2016) 030
Phys.Rept. 532 (2013) 119 EPJC. 77 (2017) 367
PRD. 98 (2018) 030001
ATLAS- this result = 13 TeV, 139 fb-1
s
Statistical Error Systematic Error Total Error