MORE ON DIABATIC
PROCESSES
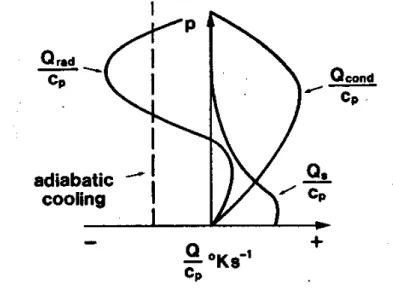
In generalthe totaldiabaticheatingratemay bewrittenasthesum ofthree
components,
Q
total
=Q
rad +Q
cond +Q
sen
thecontributionsontheright-hand-sidebeingfromradiative,condensational
andsensibleheating,respectively. Figure3.1shows schematicallythetypical
vertical distributionof these contributions.
Figure 3.1: Vertical distribution of radiative, condensational and sensible
heating.
Whilediabaticprocessesdriveatmosphericmotion,itisimportanttoem-
phasize that the contributions Q
rad
;Q
cond
;Q
sen
are not pure external func-
tions, but are stronglycoupled tothe ow congurationthey produce. This
interdependence reects a redistribution of the only pure external heating
function, the solar energy, which impinges on the atmosphere from space
(S
0
). In order to understand the full relevance of diabatic process and how
the drive atmospheric motions, it is necessary to understand the manner in
whichS
0
is redistributed.
If we assume that the atmosphere is in radiative equilibrium with outer
space and note that the earth isa sphere, it is clear that considerably more
energy will reach the surface near the equator than near the poles. Conse-
quently,heatenergymustbetransferredpolewardifthereistobeanapprox-
imate steady state. The question arises, how is the energy S
0
redistributed
in the vertical? We consider rst the eects of radiationalone.
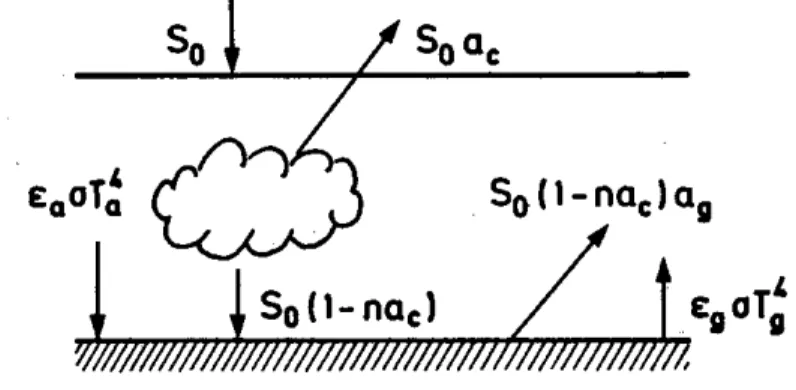
Figure 3.2 shows a highly simplied radiation model in which we have
neglected the absorption of short wave radiation, since it is at the earth's
surface that the major eect of S
0
occurs. Pure radiative balance at the
surface would require that
Figure3.2: A highlysimpliedradiation model.
S
0
(1 na
c
)(1 a
g )="
g T
4
g
"
a T
4
a
; (3.1)
wheren denotes the fractionalareaof cloud,T
s and T
a
arethe temperatures
ofthesurfaceandtheatmosphere 1
,respectively,a
c anda
a
arethealbedosof
cloud and the ground surface, "
c and "
s
, are the corresponding emissivities,
and is the Stefan-Boltzmann constant. This equation says that the net
short wave ux into the atmosphere is balanced by the net outward long
1
wave ux. Now "
a T
4
a
represents the re-radiation of the atmosphere back
to the surface. As "
a
0:7, we cannot neglect this term. In fact such long
wave absorption has amajor impacton the distributions shown in Fig. 3.1.
However, the solarradiation(thelefthandside ofEq. (3.1)maybedisposed
of in other ways besides being merely radiated upwards (i.e. a, "
g T
4
a ) as
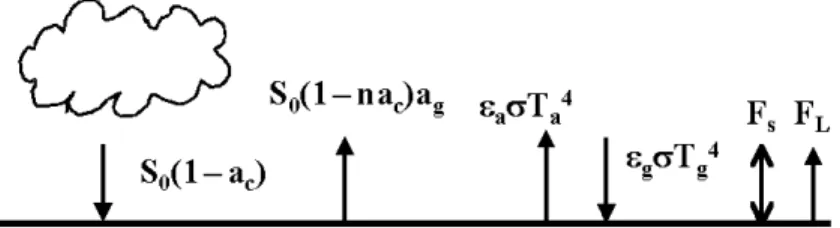
long wave radiation. Adjacent to the surface there willbe diusion of heat
to or from the atmosphere and possibly convective mixing upwards to the
atmosphere. Over moist ground or over the ocean, evaporation may occur
and there will be an evaporative ux of heat away from the surface (Fig.
3.3). In this case the total energy balanceat the surface is
S
0
(1 na)(1 a
g )="
g T
4
g
"
a T
4
a +F
s +F
L
; (3.2)
where F
s
, and F
L
are the sensible and latent heat uxes, respectively. The
former quantity, F
s
, depends on the magnitude and sign of temperature
dierence T = T
g T
a
. The behaviour is roughly as sketched in Fig.
3.4. If T > 0, F
s
> 0 and there is convective heat transfer to the air, If
T < 0, F
s
< 0, but the heat transfer is then diusive and relatively small
(i.e. jF
sconv:
j>>jF
sdiff:
j).
Figure3.3: Energy balanceat the earth'ssurface.
Generally, F
L F
s
. ThusF
s
, and F
L
are usually net uxes of heat away
fromthesurface. Notethattheyeectivelychangeradiativediabaticheating
into other types of heat transfer, which then contribute to redistributing
the heat. Both F
s
, and F
L
have important eects on the total columnar
heatingrates,Q
g
and Q
L
,andbotharefunctionsofatmosphericmotionand
structure. The dependence of F
s
onT and onthetemperaturestructureis
depicted in Fig. 3.5. Note that the greater T, the greater is the degree of
convective instability within the boundary layer, a feature seen also in Fig.
3.5.
The functions F and F can beparameterized as
Figure3.4: F
s
=F
s (T):
Figure3.5: Atmosphericconditions inuencingF
s .
F
s
=C
D jVj(T
g T
a
); (3.3)
F
L
=C
g jVj(q
s q
a
); (3.4)
where V isthe wind speed near the surface, T , and q are the temperature
andspecichumidityoftheairnearthesurface,T
g ,andq
g
,aretheseasurface
temperatureandsaturated specic humidity atthe seasurface temperature,
respectively,andC
D ,C
E
areempiricalcoeÆcientsthatdependonthesurface
characteristics(and overthe seaonwindspeed). ThecoeÆcientC
D
iscalled
the drag coeÆcient and C
E
is called the heat transfer coeÆcient. Generally,
the uxes F
s
and F
L
depend on
(a) the degree of surface roughness,
(b) the wind speed,
(c) and in the case of moisture there is a dependency on the degree of
saturation in the vertical.
The sensible heating, Q
sen
, tends to be conned to the lowest 1-2 km,
exceptoverdrycontinentalsurfaceswhereitmaybeashighas4km. Further
it represents animmediate acquisitionof heat by the column.
Thelatentheating,Q
cond
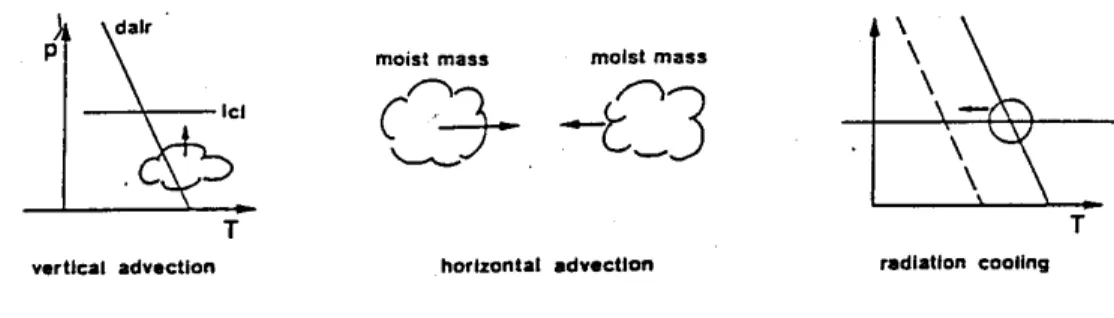
,isnotimmediate,but requiressaturationinor-
der toaccomplishtheheatrelease. Thisisaprocessthatishighlydependent
onthedynamics. Therearethreemainways ofproducingcondensation: two
are associated with advection, the other (non-dynamic) by radiativecooling
(Fig. 3.6).
Figure3.6: Schematicillustrationof process leading tocondensation.
Most of the latent heat release in the tropical atmosphere is associated
with moistconvection,verticaladvectiveprocess. Wewillrestrict ouratten-
tion to this form of Q
L
. The actual region of moist ascent is rather small
and rather vigorous. Most of the tropics is involved in the ux of latent
heat (F
L
), but only a small part is involved in its release. The situation is
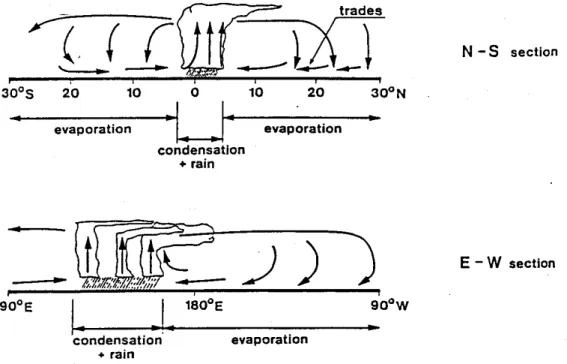
depicted inthe moisture cycle, shown schematicallyin Fig. 3.7.
Insummary,thereare two majorformsof Q. Theseare Q
rad
, principally
the longwave componentthereof,and Q , whichisanindirectmanifestation
Figure3.7: The moisture cycle in the tropics.
of S
0 via F
L
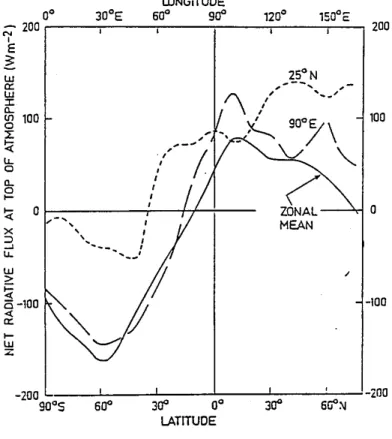
. Figures 3.8and 3.9 indicate something of their disposition in
the east-west and north-south cross-sections. Of particular importance in
Fig. 3.8isthatthelongitudinalgradient ofnetuxisofthesamemagnitude
as the latitudinal gradient. Most of the variation in the latitudinal prole
may beaccountedforinthelatitudinalgradientofthe solarinput. However,
as the solar input is constant along 25 Æ
N, the longitudinal variation in net
ux must be due to other eects such as ground albedo and cloud cover;
the latter being closely associated with the dynamical system. Note that
the desert regions (10 Æ
E to 50 Æ
E) appear as net radiative sinks with the
outgoinglongwaveradiation(OLR)greaterthanthe netincomingsolarux.
On theotherhand,theconvectivemonsoonregions(80 Æ
Eto18 Æ
E)actasnet
radiativeheatsources. Inthecaseshowntheradiativeheatingdistributionis
probablyindicativeofthetotalheatingeld. Thecondensationalheatingwill
be a maximum inthe monsoonregions as Q
cond
willbe strongly tied to the
precipitationpatterns. Inthedesertregionsthe sensibleheatingwillact ina
senseoppositetothatofradiativecooling,butthiscomponentwillbesmaller
and restricted toatmost the lowest fewkilometresof the atmosphere. Thus
atmosphericcolumnsabovethedesertsshouldbecontinuallycoolingandthe
columnsin the monsoon regionscontinuallyheating. A dynamic response is
necessary to rectify the imbalance. Recall that from the scaling of Chapter
2, [see Eq. (2.29)], N 2
w Q=(c
p
T), which states that the diabatic heating
(Q
rad +Q
cond
)isnearlyexactlybalancedbyw. Asaconsequence, dynamical
processes are involved and, consistent with mass continuity, a circulation
develops. Note, however, thatQ
cond
willdepend onwsothatfeedbackloops
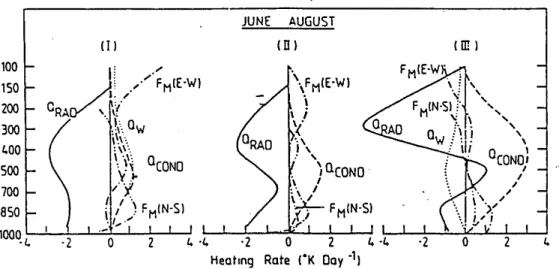
are extremely important. To determine the form of the dynamic response,
WebsterandStephens(1979)useddatafromNewelletal. (1972)tocalculate
the heat convergence into the longitudinal section between the arid regions
of Saudi Arabia (I), the Arabian Sea (II) and the Bay of Bengal (III). The
resultant uxes, together with the estimates of the vertical proles of the
components of the total heating are shown in Fig. 3.9.
Figure 3.8: The distribution of the net radiative ux at the top of the at-
mosphere inferred from NIMBUS 3. Plots of the zonally averaged net ux
(solidline),theuxalong90 Æ
E(largestdashedline)andalong20 Æ
N(dashed
curve) for July 1969are shown. (From Webster & Stephens, 1979).
heatintotheuppertroposphereofthedesertregionsandoutoftheconvective
regions. Thenet radiativecoolingiscompensatedbyadiabaticwarmingover
the desertsand anadiabaticcooling overtheBay ofBengal. Inother words,
the dynamic response to the longitudinal imbalance of total heating is the
generation of a rathervigorous thermally-forced circulation.
More detailsaboutthe role and representation ofmoist processesand, in
particular, moist convection are given in a later chapter.
Figure3.9: Theverticaldistributionofthe heatingcomponentsintheatmo-
spheric columnabove SaudiArabia (I),the Arabian Sea (U)and the Bay of
Bengal (III). The quantities Q
rad
;Q
cond
;F
M
(E W) and F
M
(N S) refer
to heating due to radiation,condensation and heat ux convergence due to
mean zonal (E W)and meridional(N 5) motions.