Image correction for atomic force microscopy images with functionalized tips
M. Neu,1N. Moll,2L. Gross,2G. Meyer,2F. J. Giessibl,1and J. Repp1
1Institute of Experimental and Applied Physics, University of Regensburg, 93053 Regensburg, Germany
2IBM Research–Zurich, 8803 R¨uschlikon, Switzerland
(Received 27 February 2014; revised manuscript received 12 April 2014; published 7 May 2014) It has been demonstrated that atomic force microscopy imaging with CO-functionalized tips provides unprecedented resolution, yet it is subject to strong image distortions. Here we propose a method to correct for these distortions. The lateral force acting on the tip apex is calculated from three-dimensional maps of the frequency shift signal. Assuming a linear relationship between lateral distortion and force, atomic force microscopy images could be deskewed for different substrate systems.
DOI:10.1103/PhysRevB.89.205407 PACS number(s): 68.37.Ps,68.43.Fg I. INTRODUCTION
The possibility to reveal the chemical structure of individual molecules by means of atomic force microscopy has recently been enabled by using functionalized tips [1]. Whereas different tip functionalizations have been reported [2,3], CO was used most often, and is now being widely applied [2–14].
The molecular geometry appears considerably distorted in these images—an effect that is attributed to the bending of the CO molecule at the tip apex because of its interaction with the sample [15,16]. This effect leads to an apparent sharpening of bonds [15] and increases the lateral size of features arising from individual atoms [9,17]. Whereas in many cases a slight distortion of the images may not compromise the experimental findings, in some cases the detailed geometric structure itself bears crucial information [18]. As the positions of atoms appear displaced by distances on the order of 1 ˚A, this effect may also prevent a site determination of adsorbates of low symmetry.
Here, we present a technique to correct for the image distortions that are due to this effect. The correction is based on the assumption that the bending of the CO molecule at the tip apex is, in good approximation, linear to the lateral forces acting on the cantilever. The latter can be derived from three-dimensional (3D) maps of the frequency shift f of the force sensor by subsequent integration and differentiation [19–23]. As the scaling constant of the distortion with lateral force is unknown, it needs to be extracted from a known structure, which can be a functional group of known geometry of the molecule under study. Here, we successfully apply the proposed method to deskew images of pentacene molecules adsorbed on bare copper and on NaCl films, respectively.
II. METHODS
Experiments are performed using a home-built qPlus-based [24] atomic force microscope (AFM) in ultrahigh vacuum (p≈5×10⁻¹¹ mbar) at low temperatures of 5 K. Sodium chloride was evaporated onto a clean Cu(111) surface at sample temperatures of about 277 K. Pentacene was adsorbed at sample temperatures below 10 K. CO was dosed onto the sample for tip functionalization. The sensor is characterized by its resonance frequency off0=26.057 kHz, its stiffness of k=1800 N/m, and its quality factor ofQ≈13 000. The AFM was operated in the frequency modulation mode (FM-AFM [25,26]) while keeping the oscillation amplitude constant at
0.45 ˚A. The images were acquired in the constant height mode at zero sample voltage for different tip-sample distances.1
To minimize creep, the tip was held in constant current mode for more than 12 h at scanning tunneling microscopy (STM) set-point parameters of 1 pA and 400 mV before the entire set of constant-height f(x,y) images at given tip- height values was acquired. Between the acquisition of each two subsequent images, the feedback loop was switched on for several seconds. During the entire data acquisition no tip changes were observed and a cross-correlation analysis of the images revealed that drift was negligible.
III. RESULTS AND DISCUSSION
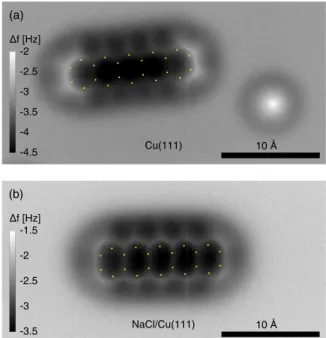
Figure 1 shows atomically resolved f images of pen- tacene on bare Cu(111) (top panel) as well as on a bilayer of NaCl on Cu(111) (bottom panel). Superimposed on the experimental images are the positions of the carbon atoms, for the well known geometry of pentacene [27]. From these, the distortions can be estimated to be of up to roughly 0.6 ˚A on Cu(111) and 1.4 ˚A on NaCl/Cu(111), leading to an apparent increase in the C–C bond lengths of up to approximately 40%
and 100%. These apparent elongations are much larger than the experimental uncertainty of the image scaling and the expected bond length changes that could arise from the interaction of pentacene with the substrate. As the distortions are thought to be due to the bending of the CO molecule at the tip apex [15], it should be possible to correct for the distortions, if the forces acting on the CO can be experimentally determined.
To correct for the image distortion in the simplest possible way, we assume the in-plane distortion (that is, parallel to the surface)r to scale linearly with the corresponding forces Fwith a certain unknown scaling constantαas
r=αF. (1) The scaling constantα has the dimension of the inverse of a spring constant. Even though related, it is not simply the inverse of the stiffness of the CO molecule at the tip apex, as will be discussed further below. In FM-AFM the tip-sample
1An STM setpoint of I=1 pA, V =0.4 V was used between image acquisitions. After interrupting the feedback loop the tip was vertically displaced byzCu= −3.2 ˚A andzNaCl=0.2 ˚A to reach z=0 on copper and NaCl, respectively.
10 Å 10 Å
NaCl/Cu(111) Cu(111)
-3.5 -3 -2.5 -2 -1.5 f [Hz]
(b) -4.5 -4 -3.5 -3 -2.5 -2 f [Hz]
(a)
FIG. 1. (Color online) Pentacene adsorbed on (a) bare Cu(111) and (b) NaCl/Cu(111) was imaged by recording the frequency shift f at a constant height of z=0. Dots indicate the positions of carbon atoms in the known geometry of pentacene. In comparison, one realizes that the molecule’s geometric structure appears distorted.
This effect is attributed to a bending of the CO due to forces acting on it. The distortions are considerably larger on the NaCl substrate as compared to the case of adsorption on the bare copper. In the right part of the image in the top panel there is a CO molecule on the surface.
interaction results in a frequency shiftf [28]. Using small oscillation amplitudes of the cantilever, the frequency shift f with respect to the eigenfrequency without tip-sample interactionf0 is, in good approximation, proportional to the vertical force gradient:
∂F⊥(x,y,z)
∂z ≈ −2k
f0f(x,y,z) (2)
where F⊥ is the out-of-plane component of the force andk is the stiffness of the cantilever [29,30]. Integrating∂F⊥/∂z twice over z yields the tip-sample interaction potential, the lateral gradient of which provides the lateral tip-sample forces [22]:
F(x,y,z)= −2k f0 ∇
z
∞
ζ
∞
f(x,y,χ)dχ dζ
. (3) Hence, a 3D map of f(x,y,z) is needed in order to extract the lateral forces and to correct the distortions in the images. There are two conceptually different ways to obtain 3Df maps: namely, one may acquire manyf(z) spectra on a two-dimensional grid of (x,y) values [19,31], or many constant-height f(x,y) images at a given set of z values [23] above the molecule. While both methods have their own advantages, we here make use of the latter, as it allows for a high spatial resolution in a reasonable data-acquisition time.
f(x,y,z) changes much more rapidly with z for short tip-sample distances than for large ones. We therefore chose
the set of z values, at which we acquired f maps, to be nonequidistant, with the sampling becoming more dense with decreasing tip-sample separations. For each 3D map we acquired 40 images. The intramolecular resolution was shown to be due to Pauli repulsion between tip and molecule [15], which is very short-range in nature and should therefore depend sensitively on the actual tip-molecule separation.
In contrast, attractive interactions are expected to laterally vary only slowly over the molecule. Therefore, we expect that the appearance of intramolecular resolution occurs at a comparable tip-molecule separation for adsorption on different substrates (when determined with the same tip apex under identical imaging conditions).
To this end, we determined the tip height at which intramolecular resolution on pentacene starts to appear. From this height, the tip was moved 0.85 ˚A closer to the sample to acquire the atomically resolved images, shown in Fig.1.
These images are the ones that are to be deskewed, and we defined the tip-sample distance at which they were acquired as z=0. Note that, for this definition, at z=0 the tip is still a few angstroms above the molecule. The local minima of f(z) spectra may also be used as a reference for the tip-adsorbate distance [14,18]. Here, these minima occur at z0.2 ˚A for spectra acquired at the center of one of the two outermost carbon rings on both substrates,2 supporting that z=0 corresponds indeed to the same tip-adsorbate distance on both substrates.
According to Eq. (3), f data is numerically integrated twice over thezaxis and then differentiated laterally to obtain the in-plane component of the force F. In practice, this integration will never extend to infinite distances, but only to a largest tip-sample separation, which will be referred to aszlim in the following. Here, we reverse the sequence of integration and differentiation as
F(x,y,z)= −2k f0
z
zlim
ζ zlim
(∇f(x,y,χ))dχ dζ. (4) This has the advantage that the quantity∇fcan be analyzed separately for each image, providing an understanding of its influence on the total lateral forces, as discussed further below.
Performing integration by parts on Eq. (4) with respect toζ yields
F(x,y,z)= −2k f0
z
z
zlim
(∇f(x,y,χ))dχ
− z
zlim
ζ(∇f(x,y,ζ))dζ
(5)
= −2k f0
zlim z
(ζ −z)(∇f(x,y,ζ))dζ. (6) Note that the factor (ζ −z) weighs the contributions of f(x,y,ζ) images increasingly for increasingζ, which will become important further below. Further, in the experiment one has a discrete set off maps recorded atndifferent tip
2The position of local minima off(z) spectra for pentacene on Cu(111) vary over the molecule, as it is not adsorbed entirely flat [14].
-5 -4 -3 -2 -1 0 1 2 34 5
(a)
Fll [pN]
-8 -6 -4 -2 0 2 4 6 8
(b)
Fll [pN]
-5 -4 -3 -2 -1 0 1 2 34 5
(c)
Fll [pN]
-8 -6 -4 -2 0 2 4 6 8
(d)
Fll [pN]
Cu(111) NaCl/Cu(111)
Cu(111) NaCl/Cu(111)
10 Å 10 Å
10 Å 10 Å
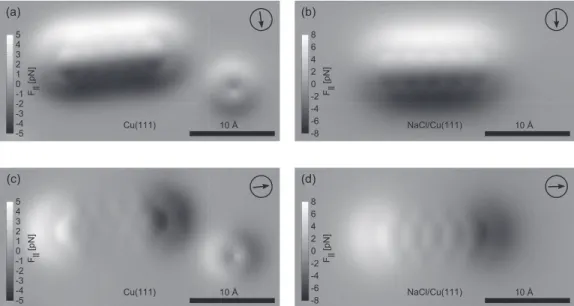
FIG. 2. Component of the lateral force between tip and sample above an individual pentacene molecule along the high-symmetry directions of the molecule atz=0. The lateral force of pentacene (and CO) on clean Cu(111) [(a) and (c)] and pentacene on NaCl [(b) and (d)] are shown with respect to the short and long axes of the molecule (directions as indicated by the arrows). The main contribution is a force pointing towards the center of the molecule. In order to reflect mainly the lateral forces acting on the CO molecule of the functionized tip, the integration off has been limited tozlim=3.95 ˚A. On the NaCl substrate, the lateral force is considerably larger compared to the Cu substrate.
sample distancesζi. Hence, the integral in Eq. (6) is replaced by a sum.
Figure2shows the calculated lateral forces above pentacene adsorbed on Cu and on NaCl, respectively, at z=0. The forces are displayed with respect to the short and long axes of the molecule. To obtain these, the integration was performed of up to zlim=3.95 ˚A. The main contribution is a force pointing toward the center of the molecule, corresponding to an overall attractive force decaying on the angstrom scale.
This contribution is present all along the periphery of the molecule and in direct proximity to it. In addition to this overall behavior, there is a smaller intramolecular contribution at the positions of the bonds. This contribution is very short-range, locally pointing away from the bonds and thus repulsive.
Obviously, the lateral forces in the case of pentacene on NaCl are substantially larger than on copper. The same holds true for the distortions in the AFM images (cf. Fig.1).
To obtain the lateral forces acting on the entire tip, the integration has to be performed up to values ofzlim, at which f(x,y) no longer varies laterally. If zlim is chosen to be smaller,F(x,y,z) as determined from Eq. (6) will implicitly depend on zlim and will reflect all the lateral forces minus the ones occurring at zlim. Here, only the forces that act on the CO molecule give rise to the image distortion, whereas the measured f(x,y) results from the forces acting on the entire tip. Unfortunately, the ratio between the forces acting on the metal tip and the CO molecule depends on the tip-sample distance: Pauli repulsion occurs only at short distances and will primarily act on the CO molecule. Van der Waals attraction is dominating at intermediate distances and will act on both the CO molecule and the metal tip apex [1]. Finally, forces arising from local contact potential differences are dominant at large distances (z3 ˚A) and will primarily act on the metal tip apex. We note that thef(x,y)
images used here were all acquired at zero bias voltage and hence not at compensated contact potential difference, to avoid large tunneling currents that may cause artifacts from phantom force [32], inelastic excitations, and other sources.
Since in the current context only the forces that act on the CO molecule are of interest, it might be beneficial to limit the integration (or summation) to a certain value ofzlim in order to exclude the long-range force contributions that do not act on the CO molecule strongly. Whereas, from the above considerations, a value ofzlimof a couple of angstroms seems reasonable, no rigorous value can be provided from simple arguments.
It is therefore crucial to analyze the lateral gradient of the frequency signal ∇f(x,y), the integration of which will result in the lateral forces for these different regimes. As has been pointed out above [Eq. (6)], the influence of contributions off(x,y) images increases with distance ζi, at which they are acquired. On the other hand, the corrugation inf(x,y) images fades away with increasing distance from the surface.
To understand the contribution of one individual f(x,y) image at a particular distanceζi to the overall lateral force, we determined the quantity (ζi−z)
| ∇f(x,y,ζi)|dx dy.
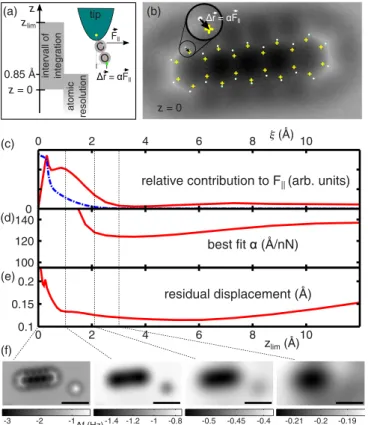
Here, the integration overxandyis performed to obtain this contribution averaged laterally over each image. This quantity is displayed for pentacene on Cu(111) in Fig.3(c). The largest contribution to the lateral forces arises fromf data in the range of 0.2 ˚Az3 ˚A.
As reported earlier [1], at intermediate distances (forz 3 ˚A), the pentacene gives rise to a “bathtub” shaped depression in constant-height f(x,y) images [1]. This contribution arises from the van der Waals attraction and corresponds to forces pointing always towards the center of the molecule.
The evolution of thef images with increasing distance is shown in Fig.3(f). In addition, Fig.4(a)shows anf image
0
100 120
ξ (Å)
0 2 4 6 8 10
0.1 0.15 0.2
best fit (Å/nN)
residual displacement (Å) relative contribution to F|| (arb. units)
f (Hz)
(c)
(d)
(e)
(f)
-0.21 -0.2 -0.19 -0.5 -0.45 -0.4
-1.4 -1.2 -1 -0.8
-3 -2 -1
140
0 2 4 6 8 10
zlim (Å)
(a) z (b)
z = 0 zlim
intervall of integration C
O r = Fll
Fll tip
atomic resolution 0.85 Å
z = 0
r = Fll
FIG. 3. (Color online) (a) Schematic illustration of the geometry and definition ofzandzlim. (b) The coordinates of the positions at which one would expect the carbon atoms of pentacene on Cu(111) in the distorted AFM images are indicated by white dots, their positions according to the known structure of pentacene by yellow crosses. The dash-dotted line in (c) shows the averaged absolute lateral gradient of each image. This is a relative measure of the corrugation in each image. The solid line represents the same quantity multiplied withζi and is a measure of the relative contribution of each image to the resulting lateral force atz=0. The best fit of the scaling constantα is displayed in (d) as a function of the upper limit of integrationzlim. The corresponding residual displacement of carbon atoms in the corrected image is shown in (e). A selected subset off images in (f) shows that the largest contribution to the lateral forces arises from the “bathtub” like depression in these images. Scale bars are 10 ˚A.
atz1 ˚A, for which the relative contribution to the lateral forces is very large [cf. Fig. 3(c)], exhibiting the bathtub shaped depression. For easy reference, the lateral gradients of this image along the two axes of the molecule are shown in Figs.4(b)and4(c). Comparing these to the lateral forces shown in Fig. 2 illustrates that the bathtub feature indeed corresponds to the main contribution of the lateral force.
For larger distances, the bathtub feature fades more rapidly than the linear increase of its influence onto the lateral forces.
Compared to the bathtub shaped depression, the intramolecular features result only in a smaller contribution to the lateral forces, as they emerge only at the last few tenths of an angstrom. At large distances, thef(x,y) signal is dominated by electrostatic forces. Even though the f(x,y) signal at these distances is small, it still results in appreciable lateral forces acting on the cantilever, as can be seen in Fig. 3(c).
(a)
(b)
(c)
FIG. 4. (a) f image of pentacene on Cu(111) at z1 ˚A, showing a characteristic bathtub feature. Its lateral derivatives along the short and long molecular axes are shown in panels (b) and (c), respectively (directions as indicated by the arrows). These images closely resemble the lateral forces shown in Fig.2, establishing the direct relation between the bathtub feature and lateral forces. Scale bar is 10 ˚A.
However, as argued above, these will act primarily on the metal part of the tip and do not reflect the forces acting on the CO molecule.
To determine the best fit of the free parameterα and to quantify the goodness of the correction, we determined the coordinates of the positions at which one would expect the carbon atoms of pentacene in the distorted AFM images, as is illustrated in Fig.3(b), in which the apparent carbon positions as well as their positions according to the known structure are indicated. On average, these positions differ from the known structure of pentacene by 0.43 ˚A and 0.80 ˚A for pentacene on clean Cu(111) and on NaCl/Cu(111), respectively. Based on the experimentally determined lateral force [cf. Eq. (6)] these positions are shifted according to relation1 [see Fig. 3(a)].
This allows us to obtain a best fit of the free parameter α from linear regression. As argued above, the upper limit of the vertical integration (or summation) may influence the result. To quantify this, we determined the lateral force for all possible upper limitszlim and plotted the best fit ofα as well as the residual apparent lateral displacement of carbon atoms as a function ofzlim, as shown in Figs.3(d)and3(e),
respectively. In agreement with the above considerations, we observe that for an upper limit of 3–5 ˚A the corrections are best. An integration to even larger distances only reduces the quality of the correction. Interestingly, in this regionαbarely varies with zlim. We therefore chose zlim=3.95 ˚A for the image correction, as was also done for calculating the lateral forces shown in Fig. 2. This integration range included 17 images for each data set. The image correction reduces the average apparent displacement of carbon atoms in pentacene from 0.43 ˚A in the raw data to only 0.12 ˚A. Note that the latter distance is comparable to the size of an individual pixel in the original images.
To correct the entire image for its distortions, we shift each pixel in the image byr as explained above [according to Eqs. (1) and (6)] using the best fit of α=123 ˚A/nN. As can be seen in Fig. 1, the distortions at different positions within one single molecule as well as for the two images on bare Cu(111) and on NaCl/Cu(111) are quite different.
Most importantly, we can correct both images reasonably well with the very same value for the parameter α, as is shown in Fig. 5. This supports the assumption that the distortions and the lateral forces are roughly proportional to each other and corresponds to the observation that on NaCl not only the distortions but also the lateral forces (cf. Fig.2) are roughly twice as large as compared to adsorption on bare copper. A detailed best-fit analysis performed analogously for pentacene on NaCl/Cu(111) yields that also for this case an upper limit zlimof 3–5 ˚A works best. It yields a slightly larger value for α of α=140 ˚A/nN, resulting in an average displacement being reduced from an initial value of 0.80 ˚A without image correction to 0.18 ˚A for the corrected case. Hence, in both cases the correction reduces the distortions by approximately a factor of 4.
The observation that the integration has to be limited to roughlyzlim4 ˚A greatly reduces the experimental effort for image correction, as only a very limited set offimages has to be recorded as input to the correction algorithm. To investigate
this further, we chose a subset of only four of the images from the dataset acquired on pentacene on Cu(111) at distances ζi 1.0, 2.1, 3.0 and 4.3 ˚A, respectively, and we used only these for the image correction. Even with this small number of images, the correction yields good results (α=138 ˚A/nN with a residual average displacement of 0.13 ˚A).
Finally, we repeated the above described experiments for a different tip apex, also terminated with a CO molecule. In the image obtained with this apex the atomic structure of pen- tacene and the bathtub feature were slightly displaced against each other, indicating a slightly asymmetric tip apex. With an optimal scaling constant ofα=116 ˚A/nN the average dis- placement could be reduced from 0.55 ˚A to 0.17 ˚A, in this case.
We assume that there is no universal value for the optimal scaling constantα, so that it has to be separately determined for each individual tip apex. It may well be that the effective lateral stiffness of the CO at the tip apex depends on the details of the individual tip apex. Even more likely, the ratio of the force that acts on the CO and on the rest of the tip will probably vary from tip to tip. However, for a given tip,αcan be extracted from a known structure, which can be a part of the molecule under study. We note that, when imaging at even closer tip- sample distance, we do not expect this method to still produce reasonable corrections, since in this regime the linear scaling in Eq. (1) will be justified no longer.
The bending of the CO changes along the vertical integra- tion path from large to small tip-sample separations. One may account for this bending by correcting each individual image along the integration path and hence integrate over corrected images. We tested this type of correction against the simpler case of integration of the uncorrected data, where only the final image is corrected. Whereas there are no appreciable differences for both methods, the first is more susceptible to noise, as there the noise will also affect the integration pathway.
As is discussed above, the main contribution to the lateral forces result from the images in the range of 0.2 ˚Az3 ˚A, in which the contrast varies only on the angstrom but not on the
-3.5 10 Å -3 -2.5 -2 -1.5 f [Hz]
(d)
NaCl/Cu(111) -4.5 10 Å
-4 -3.5 -3 -2.5 -2 f [Hz]
(b)
Cu(111)
10 Å 10 Å
NaCl/Cu(111) Cu(111)
-3.5 -3 -2.5 -2 -1.5 f [Hz]
(c)
-4.5 -4 -3.5 -3 -2.5 -2 f [Hz]
(a) original deskewed
deskewed original
FIG. 5. (Color online) Original and deskewed images of individual pentacene molecules atz=0. In (a) and (c) the original images of pentacene adsorbed on Cu(111) and on NaCl/Cu(111) are shown for easy reference (same as in Fig.1). These images are deskewed by means of the lateral force shown in Fig.2and are displayed in (b) and (d).
subangstrom scale. Bearing this in mind, it is not surprising that the correction as proposed above does not result in a significant improvement over the simpler correction method.
As pointed out above,αdoes not directly correspond to the inverse of the stiffness of the CO molecule attached to the tip.
Most likely, the motion of the CO at the tip apex leading to the distortions occurs at the metal-CO bond, corresponding to a hindered rotation of the CO. As the bonding at a tip apex will be quite different from the one at an extended surface its stiffness may not be the same as for the latter. Even more importantly, the stiffness of the CO is not only determined by its bonding to the tip apex but also by its attractive interaction with the substrate. The vertical force resulting from the latter was previously determined to be up to 80 pN [1] for similar imaging conditions. If we use the same moment arm as Weymouthet al.
of 3.02 ˚A [33], this vertical force alone results in a stiffness of the CO molecule of 0.26 N/m, even if there are no other restoring forces. This stiffness is a factor of 3 larger than the value of 1/α, underscoring that the two quantities are not at all the same. A difference in these two quantities arises firstly because the experimentally determined forceF reflects not only forces acting on the CO molecule but also those acting on the metal tip apex. Secondly, the lever arm of AFM imaging will be different from the moment arm of F. Thirdly, the cut-off of the integration at a limit ofzlimneglects some unkown fraction ofF. However, even under consideration of the above, the discrepancy of a factor of 3 is still surprisingly large.
As previously pointed out, the intramolecular contrast in AFM images on molecules with a CO-functionalized tip arises from Pauli repulsion, which results from the electron density overlap between tip and sample. Hence, the lateral positions
of largest repulsion in a constant-height AFM image correlate with the maxima in charge density of the sample at a given height [15,34], which are not necessarily located exactly above the atomic nuclei. This effect—going beyond the scope of this work—will also change the apparent positions of atoms in the AFM images in addition to the bending of the CO molecule at the tip apex. It can be accounted for by computing the positions of highest electron density above the molecule and, instead of the molecular geometry, comparing these with the AFM images.
IV. CONCLUSION
We have proposed a technique to deskew experimental AFM images that have been obtained with functionalized tips. The correction is based on the assumption that the distortions depend linearly on the lateral forces, which can be determined experimentally. Such a correction reduces the image distortions by approximately a factor of 4. Distortions in AFM images of pentacene on Cu and on NaCl can be corrected with similar scaling constants, despite the distortions of the original images in both cases being quite different.
ACKNOWLEDGMENTS
We thank Gerhard M¨unnich, Bruno Schuler, Niko Pavliˇcek, Jay Weymouth, Rolf Allenspach, and Klaus Richter for fruitful discussions. Financial support from the Volkswagen Foundation (Lichtenberg program), the Deutsche Forschungs- gemeinschaft (SPP 1243), and the ERC Advanced Grant CEMAS is gratefully acknowledged.
[1] L. Gross, F. Mohn, N. Moll, P. Liljeroth, and G. Meyer,Science 325,1110(2009).
[2] F. Mohn, B. Schuler, L. Gross, and G. Meyer,Appl. Phys. Lett.
102,073109(2013).
[3] G. Kichin, C. Wagner, F. S. Tautz, and R. Temirov,Phys. Rev.
B87,081408(2013).
[4] L. Gross, F. Mohn, N. Moll, G. Meyer, R. Ebel, W. M. Abdel- Mageed, and M. Jaspars,Nat. Chem.2,821(2010).
[5] L. Gross, N. Moll, F. Mohn, A. Curioni, G. Meyer, F. Hanke, and M. Persson,Phys. Rev. Lett.107,086101(2011).
[6] Z. Sun, M. P. Boneschanscher, I. Swart, D. Vanmaekelbergh, and P. Liljeroth,Phys. Rev. Lett.106,046104(2011).
[7] N. Pavliˇcek, B. Fleury, M. Neu, J. Niedenf¨uhr, C. Herranz- Lancho, M. Ruben, and J. Repp,Phys. Rev. Lett.108,086101 (2012).
[8] M. P. Boneschanscher, J. van der Lit, Z. Sun, I. Swart, P. Liljeroth, and D. Vanmaekelbergh, ACS Nano 6, 10216 (2012).
[9] J. Welker and F. J. Giessibl,Science336,444(2012).
[10] F. Albrecht, M. Neu, C. Quest, I. Swart, and J. Repp,J. Am.
Chem. Soc.135,9200(2013).
[11] D. G. de Oteyza, P. Gorman, Y.-C. Chen, S. Wickenburg, A. Riss, D. J. Mowbray, G. Etkin, Z. Pedramrazi, H.-Z. Tsai, A. Rubio, M. F. Crommie, and F. R. Fischer,Science340,1434 (2013).
[12] J. van der Lit, M. P. Boneschanscher, D. Vanmaekelbergh, M. Ij¨as, A. Uppstu, M. Ervasti, A. Harju, P. Liljeroth, and I. Swart,Nat. Commun.4,2023(2013).
[13] J. Zhang, P. Chen, B. Yuan, W. Ji, Z. Cheng, and X. Qiu,Science 342,611(2013).
[14] B. Schuler, W. Liu, A. Tkatchenko, N. Moll, G. Meyer, A. Mistry, D. Fox, and L. Gross,Phys. Rev. Lett.111,106103 (2013).
[15] N. Moll, L. Gross, F. Mohn, A. Curioni, and G. Meyer,New J.
Phys.12,125020(2010).
[16] M. P. Boneschanscher, S. K. H¨am¨al¨ainen, P. Liljeroth, and I. Swart,ACS Nano8,3006(2014).
[17] J. Welker, A. J. Weymouth, and F. J. Giessibl,ACS Nano7, 7377(2013).
[18] L. Gross, F. Mohn, N. Moll, B. Schuler, A. Criado, E. Guiti´an, D. Pe˜na, A. Gourdon, and G. Meyer,Science337,1326(2012).
[19] A. Schwarz, H. H¨olscher, S. M. Langkat, and R. Wiesendanger, in Scanning Tunneling Microscopy/Spectroscopy and Related Techniques: 12th International Conference STM’03, July 2003, Eindhoven, edited by P. M. Koenraad and M. Kemerink, AIP Conf. Proc. No. 696 (AIP, New York, 2003), p. 68.
[20] A. Schirmeisen, D. Weiner, and H. Fuchs,Phys. Rev. Lett.97, 136101(2006).
[21] K. Ruschmeier, A. Schirmeisen, and R. Hoffmann,Phys. Rev.
Lett.101,156102(2008).
[22] M. Ternes, C. P. Lutz, C. F. Hirjibehedin, F. J. Giessibl, and A. J. Heinrich,Science319,1066(2008).
[23] B. J. Albers, T. C. Schwendemann, M. Z. Baykara, N. Pilet, M. Liebmann, E. I. Altman, and U. D. Schwarz, Nat. Nanotechnol.4,307(2009).
[24] F. J. Giessibl,Appl. Phys. Lett.76,1470(2000).
[25] T. R. Albrecht, P. Gr¨utter, D. Horne, and D. Rugar, J. Appl.
Phys.69,668(1991).
[26] U. D¨urig, H. R. Steinauer, and N. Blanc,J. Appl. Phys.82,3641 (1997).
[27] R. Endres, C. Fong, L. Yang, G. Witte, and C. W¨oll, Comput. Mater. Sci.29,362(2004).
[28] F. J. Giessibl,Phys. Rev. B56,16010(1997).
[29] F. J. Giessibl,Rev. Mod. Phys.75,949(2003).
[30] Y. Sugimoto, T. Namikawa, K. Miki, M. Abe, and S. Morita, Phys. Rev. B77,195424(2008).
[31] F. Mohn, L. Gross, N. Moll, and G. Meyer,Nat. Nanotechnol.
7,227(2012).
[32] A. J. Weymouth, T. Wutscher, J. Welker, T. Hofmann, and F. J.
Giessibl,Phys. Rev. Lett.106,226801(2011).
[33] A. J. Weymouth, T. Hofmann, and F. J. Giessibl,Science343, 1120(2014).
[34] N. Moll, L. Gross, F. Mohn, A. Curioni, and G. Meyer, New J. Phys.14,083023(2012).