Motivation-Research Questions
Instrumentation
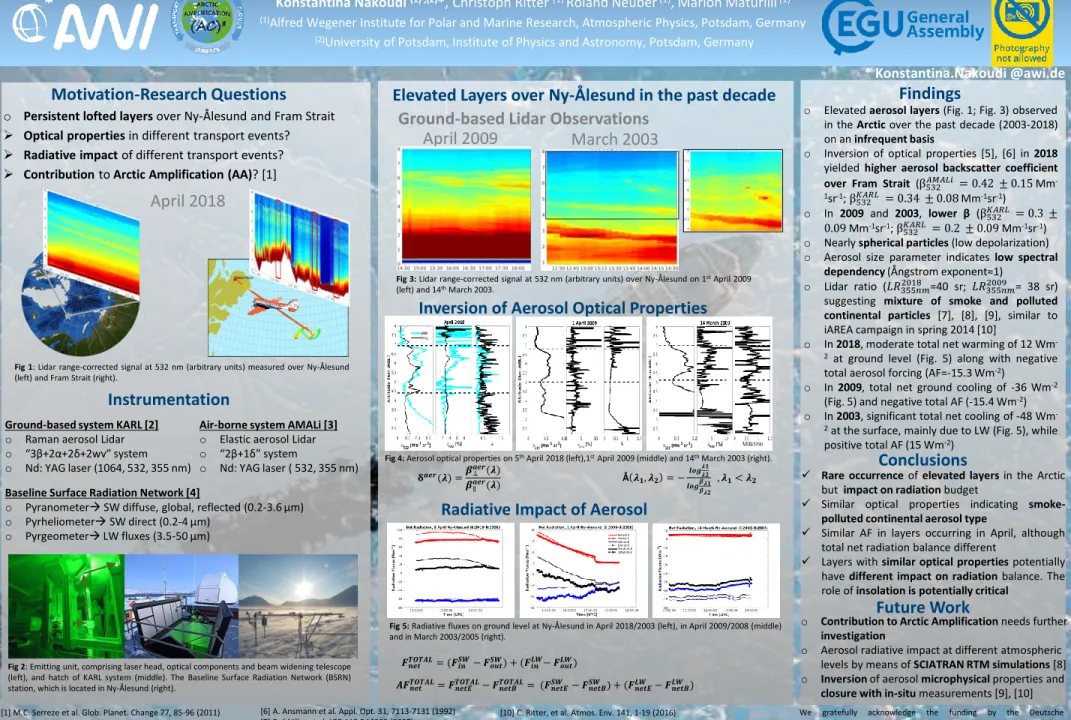
Radiative Impact of Aerosol
Inversion of Aerosol Optical Properties
Konstantina Nakoudi
(1) ,(2)*, Christoph Ritter
(1) Roland Neuber(1), Marion Maturilli(1)(1)Alfred Wegener Institute for Polar and Marine Research, Atmospheric Physics, Potsdam, Germany
(2)University of Potsdam, Institute of Physics and Astronomy, Potsdam, Germany
We gratefully acknowledge the funding by the Deutsche Forschungsgemeinschaft (DFG, German Research Foundation) – Project Number 268020496 – TRR 172, within the Transregional Collaborative Research Center “ArctiC Amplification: Climate Relevant Atmospheric and SurfaCe Processes, and Feedback Mechanisms (AC)³”.
[6] A. Ansmann et al. Appl. Opt. 31, 7113-7131 (1992) [7] D. Müller et al. JGR 112 D16202 (2007)
[8] S. Groß et al. Atmos. Chem. Phys. 13, 2487-2505 (2013) [9] A. Illingworth et al. Bull. Amer. Meteorol. Soc.
doi:10.1175/BAMS-D-12-00227.1
Rare occurrence of elevated layers in the Arctic but impact on radiation budget
Similar optical properties indicating smoke- polluted continental aerosol type
Similar AF in layers occurring in April, although total net radiation balance different
Layers with similar optical properties potentially have different impact on radiation balance. The role of insolation is potentially critical
* Konstantina.Nakoudi @awi.de
Elevated Layers over Ny-Ålesund in the past decade
Investigation of Aerosol Optical Properties in the European Arctic using Lidar remote sensing technique
Ground-based system KARL [2]
o Raman aerosol Lidar o “3β+2α+2δ+2wv” system o Nd: YAG laser (1064, 532, 355 nm)
Air-borne system AMALi [3]
o Elastic aerosol Lidar o “2β+1δ” system
o Nd: YAG laser ( 532, 355 nm) Baseline Surface Radiation Network [4]
o PyranometerSW diffuse, global, reflected (0.2-3.6 μm) o PyrheliometerSW direct (0.2-4 μm)
o PyrgeometerLW fluxes (3.5-50 μm)
April 2009 March 2003
April 2018
o Persistent lofted layers over Ny-Ålesund and Fram Strait
Optical properties in different transport events?
Radiative impact of different transport events?
Contribution to Arctic Amplification (AA)? [1]
Conclusions
𝑭𝒏𝒆𝒕𝑻𝑶𝑻𝑨𝑳= (𝑭𝒊𝒏𝑺𝑾− 𝑭𝒐𝒖𝒕𝑺𝑾) + (𝑭𝒊𝒏𝑳𝑾− 𝑭𝒐𝒖𝒕𝑳𝑾)
Findings
Fig 1: Lidar range-corrected signal at 532 nm (arbitrary units) measured over Ny-Ålesund (left) and Fram Strait (right).
Fig 2: Emitting unit, comprising laser head, optical components and beam widening telescope (left), and hatch of KARL system (middle). The Baseline Surface Radiation Network (BSRN) station, which is located in Ny-Ålesund (right).
Ground-based Lidar Observations
Fig 3: Lidar range-corrected signal at 532 nm (arbitrary units) over Ny-Ålesund on 1stApril 2009 (left) and 14thMarch 2003.
Fig 4: Aerosol optical properties on 5thApril 2018 (left),1stApril 2009 (middle) and 14thMarch 2003 (right).
Fig 5: Radiative fluxes on ground level at Ny-Ålesund in April 2018/2003 (left), in April 2009/2008 (middle) and in March 2003/2005 (right).
[1] M.C. Serreze et al. Glob. Planet. Change 77, 85-96 (2011) [2] A. Hoffmann, PhD Thesis Uni.Potsdam (2011)
[3] I. Stachlewska et al. Atmos. Chem. Phys. 10, 2947-2963 (2010) [4] M. Maturilli, et al. Theor. Appl. Climatol. 120, 333-339 (2015) [5] ] J. D. Klett, Appl. Opt. 20, 211-220 (1981)
Future Work
o Contribution to Arctic Amplification needs further investigation
o Aerosol radiative impact at different atmospheric levels by means of SCIATRAN RTM simulations [8]
o Inversion of aerosol microphysical properties and closure with in-situ measurements [9], [10]
o Elevated aerosol layers (Fig. 1; Fig. 3) observed in the Arctic over the past decade (2003-2018) on an infrequent basis
o Inversion of optical properties [5], [6] in 2018 yielded higher aerosol backscatter coefficient over Fram Strait (β532𝐴𝑀𝐴𝐿𝑖 = 0.42 ± 0.15Mm-
1sr-1;β532𝐾𝐴𝑅𝐿 = 0.34 ± 0.08Mm-1sr-1)
o In 2009 and 2003, lower β (β532𝐾𝐴𝑅𝐿 = 0.3 ± 0.09Mm-1sr-1;β532𝐾𝐴𝑅𝐿= 0.2 ± 0.09Mm-1sr-1) o Nearly spherical particles (low depolarization) o Aerosol size parameter indicates low spectral
dependency (Ångstrom exponent≈1)
o Lidar ratio (𝐿𝑅355𝑛𝑚2018 =40 sr;𝐿𝑅355𝑛𝑚2009 = 38 sr) suggesting mixture of smoke and polluted continental particles [7], [8], [9], similar to iAREA campaign in spring 2014 [10]
o In 2018, moderate total net warming of 12 Wm-
2 at ground level (Fig. 5) along with negative total aerosol forcing (AF=-15.3 Wm-2)
o In 2009, total net ground cooling of -36 Wm-2 (Fig. 5) and negative total AF (-15.4 Wm-2) o In 2003, significant total net cooling of -48 Wm-
2at the surface, mainly due to LW (Fig. 5), while positive total AF (15 Wm-2)
𝑨𝑭𝒏𝒆𝒕𝑻𝑶𝑻𝑨𝑳= 𝑭𝒏𝒆𝒕𝑬𝑻𝑶𝑻𝑨𝑳− 𝑭𝒏𝒆𝒕𝑩𝑻𝑶𝑻𝑨𝑳= (𝑭𝒏𝒆𝒕𝑬𝑺𝑾 − 𝑭𝒏𝒆𝒕𝑩𝑺𝑾 ) + (𝑭𝒏𝒆𝒕𝑬𝑳𝑾 − 𝑭𝒏𝒆𝒕𝑩𝑳𝑾 )
[10] C. Ritter, et al. Atmos. Env. 141, 1-19 (2016) [11] V.V. Rosanov et al. JQSRT 197, 65-85 (2017) [12] C. Böckmann et al., Appl. Opt. 40, 1329-1342 (2001) [13] S. Samaras et al. J. Comput. Phys. 299, 156-174 (2015) 𝛅𝒂𝒆𝒓(𝝀) =𝜷⊥𝒂𝒆𝒓(𝝀)
𝜷∥𝒂𝒆𝒓(𝝀) Å𝝀𝟏, 𝝀𝟐 = −𝒍𝒐𝒈
𝝀𝟏 𝝀𝟐 𝒍𝒐𝒈𝜷𝝀𝟏
𝜷𝝀𝟐
, 𝝀𝟏< 𝝀𝟐