https://doi.org/10.5194/bg-16-4535-2019
© Author(s) 2019. This work is distributed under the Creative Commons Attribution 4.0 License.
Comparisons of dissolved organic matter and its optical characteristics in small low and high Arctic catchments
Caroline Coch1,2,3, Bennet Juhls4, Scott F. Lamoureux5, Melissa J. Lafrenière5, Michael Fritz1, Birgit Heim1, and Hugues Lantuit1,2
1Alfred-Wegener-Institute Helmholtz Centre for Polar and Marine Research, Telegrafenberg A45, 14473 Potsdam, Germany
2Institute of Earth and Environmental Science, University of Potsdam, Karl-Liebknecht-Straße 24/25, 14476 Potsdam, Germany
3World Wildlife Fund, The Living Planet Centre, Rufford House, Brewery Road, Woking, Surrey, GU214LL, UK
4Institute for Space Sciences, Department of Earth Sciences, Freie Universität Berlin, 12165 Berlin, Germany
5Department of Geography and Planning, Mackintosh-Corry Hall, Queen’s University, Kingston, Ontario K7L 3N6, Canada
Correspondence:Caroline Coch (coch.caroline@gmail.com) Received: 14 January 2019 – Discussion started: 21 January 2019
Revised: 1 September 2019 – Accepted: 23 October 2019 – Published: 29 November 2019
Abstract. Climate change is affecting the rate of carbon cycling, particularly in the Arctic. Permafrost degradation through deeper thaw and physical disturbances results in the release of carbon dioxide and methane to the atmosphere and to an increase in lateral dissolved organic matter (DOM) fluxes. Whereas riverine DOM fluxes of the large Arctic rivers are well assessed, knowledge is limited with regard to small catchments that cover more than 40 % of the Arc- tic drainage basin. Here, we use absorption measurements to characterize changes in DOM quantity and quality in a low Arctic (Herschel Island, Yukon, Canada) and a high Arc- tic (Cape Bounty, Melville Island, Nunavut, Canada) set- ting with regard to geographical differences, impacts of per- mafrost degradation, and rainfall events. We find that DOM quantity and quality is controlled by differences in vegeta- tion cover and soil organic carbon content (SOCC). The low Arctic site has higher SOCC and greater abundance of plant material resulting in higher chromophoric dissolved organic matter (cDOM) and dissolved organic carbon (DOC) than in the high Arctic. DOC concentration and cDOM in surface waters at both sites show strong linear relationships simi- lar to the one for the great Arctic rivers. We used the opti- cal characteristics of DOM such as cDOM absorption, spe- cific ultraviolet absorbance (SUVA), ultraviolet (UV) spec- tral slopes (S275–295), and slope ratio (SR) for assessing quality changes downstream, at base flow and storm flow
conditions, and in relation to permafrost disturbance. DOM in streams at both sites demonstrated optical signatures in- dicative of photodegradation downstream processes, even over short distances of 2000 m. Flow pathways and the con- nected hydrological residence time control DOM quality.
Deeper flow pathways allow the export of permafrost-derived DOM (i.e. from deeper in the active layer), whereas shal- low pathways with shorter residence times lead to the export of fresh surface- and near-surface-derived DOM. Compared to the large Arctic rivers, DOM quality exported from the small catchments studied here is much fresher and therefore prone to degradation. Assessing optical properties of DOM and linking them to catchment properties will be a useful tool for understanding changing DOM fluxes and quality at a pan- Arctic scale.
1 Introduction
Climate change has important impacts on carbon cycling, particularly in the Arctic. Approximately 1300 Gt of organic carbon is stored in permafrost soils in the Northern Hemi- sphere (Hugelius et al., 2014), which is 40 % more than currently circulating in the atmosphere. Thawing permafrost and deepening of the active layer lead to the mobilization of this carbon (Osterkamp, 2007; Woo et al., 2008), the release
of carbon dioxide (CO2) and methane (CH4) to the atmo- sphere (Schaefer et al., 2014), and an increase in riverine dis- solved organic carbon (DOC) fluxes (Frey and Smith, 2005;
Le Fouest et al., 2018). Also associated with warming is the development of surface (physical) disturbances such as ac- tive layer detachments or retrogressive thaw slumps (Lacelle et al., 2010; Lamoureux and Lafrenière, 2009; Lewkowicz, 2007; Ramage et al., 2018) and thermal perturbation of the subsurface (Lafrenière and Lamoureux, 2013). As these pro- cesses influence freshwater systems, they ultimately have im- pacts on the biological production and the biogeochemistry of the Arctic Ocean. The six largest Arctic rivers (Macken- zie, Yukon, Ob’, Yenisey, Lena, Kolyma) drain 53 % of the Arctic Ocean drainage basin (Holmes et al., 2012) and trans- port huge amounts of nutrients and dissolved organic mat- ter (DOM) to the ocean. However, there are limited flux es- timates and information on DOM quality available for the remaining 47 %, which is sourced by smaller watersheds.
“Small” in this context refers to smaller than the large Arc- tic rivers, as the actual size distribution of these watersheds remains unknown.
Terrigenous DOM is an important source of DOC originat- ing from allochthonous (terrestrial such as soil and plants) and autochthonous (in situ production) sources (Aiken, 2014), and it is modified by biotic and abiotic processes dur- ing its lateral transport to the ocean (Tank et al., 2018; Vonk et al., 2015a, b). Yet little is known about the transforma- tion of DOM along short distances in small catchments. The composition and the vulnerability of riverine DOM to trans- formation is influenced by several factors such as soil or- ganic matter and vegetation, sorption processes in the min- eral layers, and biodegradation and photodegradation pro- cesses (Cory et al., 2014; Mann et al., 2012; Vonk et al., 2015b; Ward and Cory, 2015; Ward et al., 2017). Chro- mophoric or coloured dissolved organic matter (cDOM) is a fraction of DOM, which absorbs light in the ultraviolet and visible wavelengths (Green and Blough, 1994). Optical char- acteristics of cDOM such as absorption coefficients and spec- tral slopes can serve as proxies for DOM molecular weight and aromaticity, which in turn can help to characterize the la- bility of DOM (Helms et al., 2008; Neff et al., 2006; Spencer et al., 2009; Striegl et al., 2005; Weishaar et al., 2003). High SUVA values (UV specific absorbance at 254 nm) in com- bination with low S275–295 (spectral cDOM slope between 275 and 295 nm) values indicate “fresh” DOM, or systems of shorter residence time receiving a greater input of fresh DOM from the catchment area. In contrast, low SUVA and high S275–295 are considered indicators of limited inputs of fresh DOM, a higher relative contribution of autochthonous DOM, greater exposure to photobleaching, and longer resi- dence time (Anderson and Stedmon, 2007; Fichot and Ben- ner, 2012; Fichot et al., 2013; Helms et al., 2008; Whitehead et al., 2000).
Previous studies have focused on characterizing the cDOM–DOC relationship for the large Arctic rivers and
coastal shelf areas, which exhibit a strong seasonality (Spencer et al., 2008; Stedmon et al., 2011; Walker et al., 2013). Some studies have investigated cDOM–DOC relation- ships in smaller Arctic catchments: Dvornikov et al. (2018) examined cDOM characteristics in surface waters of the Ya- mal Peninsula, and cDOM–DOC relationships were exam- ined for subarctic catchments (Balcarczyk et al., 2009; Cory et al., 2015; Larouche et al., 2015; O’Donnell et al., 2014) and the high Arctic (Fouché et al., 2017; Wang et al., 2018).
Optical parameters have also been used to assess the impact of permafrost disturbance on stream geochemistry in Alaska (Abbott et al., 2014; Larouche et al., 2015) and the North- west Territories (NWT), Canada (Littlefair et al., 2017). As most studies focused on downstream reaches, knowledge on the spatial variability across catchments is limited. To our knowledge, no study has examined this relationship in a low Arctic setting or attempted to resolve geographic differences between the low and high Arctic.
Here, we investigate cDOM and DOC in surface waters in the low Arctic (Herschel Island, Yukon, Canada) and the high Arctic (Cape Bounty, Melville Island, Nunavut, Canada).
The aim of this study is to (1) compare the variability and relation of DOC concentration and cDOM in low and high Arctic surface water environments, (2) to investigate changes in DOM composition along longitudinal stream profiles and with regard to permafrost disturbances, and (3) examine changes in DOM concentration and composition throughout the summer season with occasional rainfall events.
2 Study area
This study was carried out in two Arctic locations, Herschel Island in the low Arctic and at the Cape Bounty Arctic Wa- tershed Observatory (CBAWO), Melville Island, in the high Arctic (Fig. 1a). Herschel Island (Yukon, Canada) is located at 69◦350N and 139◦050W in the Beaufort Sea off the Yukon coast. The island is composed of unconsolidated and fine- grained marine and glaciogenic sediments as it was formed by the Laurentide Ice Sheet (Rampton, 1982). The island is situated in the zone of continuous permafrost with ground ice content between 30 % and 60 % for the entire island. Physical permafrost degradation typically occurs in the form of retro- gressive thaw slumps (Lantuit and Pollard, 2008) and active layer detachments (Coch et al., 2020). Ramage et al. (2019) reported mean active layer depths of 52.2±20.2 cm. Soil organic carbon content (SOCC) for valleys on the eastern side of Herschel Island was estimated to be 11.4±3.7 kg m2 at 0–30 cm depth and 26.4±8.9 kg m2 at 0–100 cm depth with a C:N ratio of 12.9±2.2 at 0–100 cm depth (Ramage et al., 2019). The dominant vegetation type is lowland tun- dra (Myers-Smith et al., 2011; Smith et al., 1989) and can be classified into subzone E (CAVM, 2003), which corre- sponds to the low Arctic. The mean annual air temperature and yearly precipitation between 1971 and 2000 at Komakuk
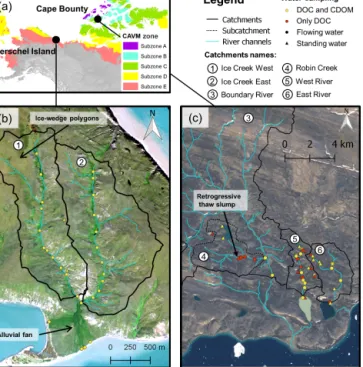
Figure 1.Maps of the study area showing(a)the location of Her- schel Island and Cape Bounty in the Canadian Arctic including the Circumpolar Arctic Vegetation Map (CAVM) bioclimatic zones (CAVM, 2003), (b) the studied catchments Ice Creek West and Ice Creek East on Herschel Island, and(c)the studied catchments Boundary River with its subcatchment Robin Creek (dashed water- shed), West River, and East River. The watershed names are indi- cated with numbers, and the general flow direction is southwards towards the ocean. Note that samples from flowing water (rivers and streams) are indicated by circles, whereas samples from stand- ing water (ponds and lakes) are indicated by triangles. Yellow marks locations where DOC concentration and cDOM measurements are available, while only DOC concentrations are available at red loca- tions. The basemap for(a)is the World Hillshade layer by Esri (cre- ated 2015, last updated 2019). The background images for(b)and (c)are true colour mosaics (Herschel Island: WorldView-3 quasi- true colour RGB composite, acquired on 8 August 2015; Cape Bounty: Sentinel-2 quasi-true colour RGB composite, acquired on 7 August 2016).
Beach, the nearest long-term meteorological station∼40 km away from our study site, are −11◦C and 161.3 mm re- spectively. The mean July temperature is 7.8◦C and average precipitation is 27.3 mm (Environment and Climate Change Canada, 2018). Snowmelt is the largest hydrological event of the year occurring in May to early June. Summer base flow after mid-June is controlled by rainfall events (Coch et al., 2018). The active layer freezes up by mid-November (Burn, 2012). The studied catchments unofficially named Ice Creek West (1.4 km2) and Ice Creek East (1.6 km2) are adjacent to each other and merge before draining into the Beaufort Sea (Fig. 1b, Table 1). Both sampled ponds in Ice Creek West are
<1 ha, and there are degrading ice-wedge polygons present in the headwaters of Ice Creek West (Coch et al., 2020).
The CBAWO is situated on the south coast of Melville Is- land (Nunavut, Canada) at 74◦550N and 109◦350W. The ge- ology is characterized by Devonian sandstone and siltstone bedrock overlain by Quaternary marine and glacial sediments (Hodgson et al., 1984). The soils are categorized as Cryosols with a thin organic horizon. The site is situated in the zone of continuous permafrost, and active layer depths typically range from 50 to 70 cm (Lafrenière et al., 2013). Permafrost degradation such as deep thaw and physical disturbances have altered hydrochemical fluxes of the rivers (Lamoureux and Lafrenière, 2017). The vegetation cover is patchy with polar semi-desert, mesic tundra, and wet sedge meadows (Edwards and Treitz, 2018), and it falls into subzones B and C (CAVM, 2003). Soil organic carbon is estimated to be 3.0 kg m2 at 0–30 cm depth and 10.2 kg m2 at 0–100 cm depth (Hugelius et al., 2013), with a C:N ratio of 10.0 at 0–100 cm depth (ADAPT, 2014). The nearest long-term me- teorological station is located∼300 km away, at Mould Bay (NWT). Between 1971 and 2000, the mean annual air tem- perature and precipitation were−17.5◦C and 111 mm re- spectively. The mean July temperature is 4.0◦C and precip- itation is 13.5 mm. Snowmelt and nival runoff start in early to mid-June with base flow establishing around early to mid- July. Refreezing of the active layer starts late August or early September (Lamoureux and Lafrenière, 2017; Lewis et al., 2012). Samples were taken downstream in Boundary River (152.5 km2), its sub-catchment Robin Creek (14.8 km2), and the neighbouring watersheds West River (8.6 km2) and East River (12.0 km2) (all unofficial names). There is an active retrogressive thaw slump in the Robin Creek watershed and a number of recent (since 2007) active layer detachments and other disturbances in the other watersheds. The sampled lakes and ponds cover a range of sizes from below 1 ha in West River to the larger downstream West and East lakes (∼140–160 ha).
3 Methods
3.1 Field methods and hydrochemistry
To explore downstream changes in DOM across regions, we used a transect approach in this study. Samples were taken along longitudinal stream profiles in catchments, and addi- tionally samples were collected from standing water bod- ies (ponds and lakes) (Fig. 1). We also obtained discharge records and water samples from the outflow of both catch- ments at Herschel Island over the course of the 2016 season as detailed below.
Field work on Herschel was carried out in July–
August 2016. We measured discharge using a cutthroat flume equipped with a U20 Onset Hobo level logger in Ice Creek West. Discharge data at 30 min intervals are available from 15 May 2016 and at 5 min intervals after 22 July 2016 (Coch et al., 2018, 2020). In Ice Creek East, discharge was deter-
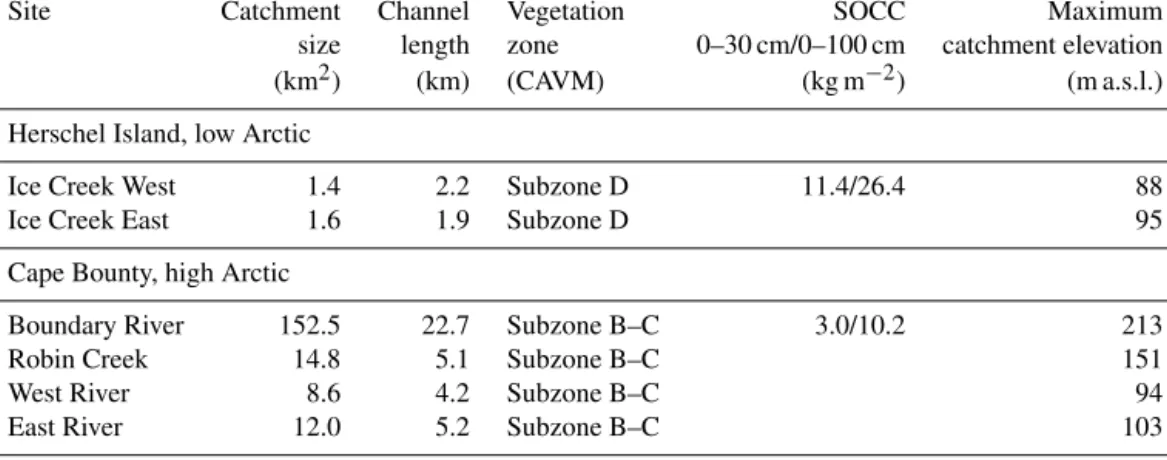
Table 1.Characteristics of studied watersheds on Herschel Island (low Arctic) and Cape Bounty (high Arctic) showing catchment size (km2), channel length (km), circumarctic vegetation map (CAVM) bioclimatic zone (CAVM, 2003), soil organic carbon content (SOCC) (Hugelius et al., 2013; Ramage et al., 2019), and maximum catchment elevation above sea level (m a.s.l.).
Site Catchment Channel Vegetation SOCC Maximum
size length zone 0–30 cm/0–100 cm catchment elevation
(km2) (km) (CAVM) (kg m−2) (m a.s.l.)
Herschel Island, low Arctic
Ice Creek West 1.4 2.2 Subzone D 11.4/26.4 88
Ice Creek East 1.6 1.9 Subzone D 95
Cape Bounty, high Arctic
Boundary River 152.5 22.7 Subzone B–C 3.0/10.2 213
Robin Creek 14.8 5.1 Subzone B–C 151
West River 8.6 4.2 Subzone B–C 94
East River 12.0 5.2 Subzone B–C 103
mined using the area velocity method in combination with a U20 Onset Hobo level logger (see Coch et al., 2020, for a detailed description). Data in Ice Creek East are avail- able at 5 min intervals after 25 July 2016. Weather data are available from the local Environment and Climate Change Canada station and from an additional station deployed in Ice Creek West during the summer. Water samples were col- lected in bottles triple rinsed with sample at the outflow of both streams between 20 July and 10 August. At the out- flow of Ice Creek West, water samples were collected us- ing an automatic water sampler (ISCO 3700) at a 12 h in- terval between 25 July and 10 August and more frequently during rainfall events (between 1 and 3 h). Prior to the au- tomatic sampling, and also in Ice Creek East, water sam- ples were taken manually once per day. We collected wa- ter samples along longitudinal profiles of the channels (11 in Ice Creek West, 12 in Ice Creek East) starting in the head- waters (∼2000 m distance from the outflow) and following the channel downstream (Fig. 1). Longitudinal profiles were sampled three times in Ice Creek West (20, 25, and 30 July) and once in Ice Creek East (30 July). Samples of flowing water are available from Ice Creek West (n=90), Ice Creek East (n=32), and the alluvial fan (n=8). Standing water samples (n=4) were collected from two ponds in the Ice Creek West catchment.
The field work at CBAWO took place during August 2017.
All samples were collected manually after triple rinsing the bottle with sample water. Similar to the Herschel field work, we collected samples along longitudinal stream profiles.
Robin Creek is a subcatchment of Boundary River (Fig. 1), where stream samples were collected at six locations down- stream of a retrogressive thaw slump. Three lakes were also sampled in the Boundary River catchment, and two samples are from the main channel of the Boundary River. A total of 21 stream samples and nine samples from lakes and ponds are available from the West River catchment, some of which
were collected after the rainfall event on 12 August 2017. In East River, four samples are available from the stream and eight samples from standing water bodies.
Within 24 h of sampling, electrical conductivity (EC) and pH were measured in the field laboratory. After collection, water samples were filtered through pre-rinsed 0.7 µm GF/F syringe filters and were then stored cool and dark for trans- port to the Alfred Wegener Institute, University of Ham- burg and Geoscience Research Centre GFZ, Germany, where analysis for DOC and cDOM was carried out. Water sam- ples for absorbance measurements were kept in brown glass bottles without acidifying. Samples for DOC analyses were acidified with HCl (30 % Suprapur) prior to the measure- ments. In 2016, DOC measurements were performed on a Shimadzu TOC-L analyzer with a TNM-L module (Univer- sity of Hamburg), whereas a Shimadzu TOC-VCPH analyzer was used in 2017 (AWI). The error for these measurements is below 10 %.
Inorganic carbon was sparged out using synthetic air prior to the measurement. As we had a shortage of HCl in the field in 2016, 82 of the samples were frozen and acidified upon return to Germany. After new acid was acquired later in the summer, sample duplicates (n=47) were processed directly in the field and also frozen. The frozen duplicate was thawed and acidified upon return to determine the effect of different sample treatment (Coch et al., 2018). There is a significant linear relationship (p <0.05, n=47, R2=0.87) between DOC concentrations of unfrozen and frozen sample dupli- cates. Samples that were frozen in the field, and subsequently thawed and acidified upon return to Germany, showed lower DOC concentrations (by 13 %) than samples that were acidi- fied directly in the field and kept unfrozen. We corrected the frozen samples for this offset (Supplement, Fig. S1). In both years, deionized water used in the field was also analyzed as a blank following the same procedure.
The absorbance was measured for the wavelengths from 200 to 800 nm with a 1 nm increment using a LAMBDA 950 UV-vis spectrophotometer (GFZ Potsdam). The measure- ments were performed in duplicates using a 5 cm cuvette and Milli-Q water as a blank. Some of the water samples showed fine particles precipitated in the sample bottle. They appeared in the form of small thin flakes, which partly remained in sus- pension or accumulated at the bottom of the flask. This pre- cipitation occurred after the samples were filtered through 0.7 µm glass fibre filters, transported to the laboratory for storage of about 4 weeks. This information was documented, and although absorbance spectra were measured, they were not further analyzed in this study as interference of the spec- tral characteristics by the particles might have occurred. This was the case for 25 (out of 55) samples at Cape Bounty and for eight samples (out of 134) at Herschel Island.
The Napierian spectral absorption coefficient of cDOM (acDOM(λ)) was calculated out of the mean of each duplicate with
acDOM(λ) (m−1)=2.303 Asample(λ)−Areference(λ)
L , (1)
where Asample is the absorbance of the sample, Areference the absorbance of the Milli-Q reference, and Lis the opti- cal path length of the used cuvette in the spectrophotometer (L=0.05 m). The decadal absorption is multiplied by 2.303, which is the conversion factor of base 10 to baseelogarithm to derive the Napierian absorption coefficient that is used for cDOM.
cDOM(λ) (m−1)2.303· Asample(λ)−Areference(λ)
L (2)
The absorption was corrected for scatter using a baseline correction by subtractingacDOM(700) (Hancke et al., 2014;
Helms et al., 2008). At that wavelength, absorption by cDOM is assumed negligible (Mitchell et al., 2002). Spectral slope values ofacDOMfor wavelength ranges from 275 to 295 nm (S275–295) and 350 to 400 nm (S350–400) were calculated using Eq. (2) and a non-linear fit. These spectral slope val- ues indicate photochemical or microbial alteration of DOM (Helms et al., 2008). The ratio of both spectral slopes (S275–
295 : S350–400) defines the slope ratio (SR). The SUVA (L mg−1m−1) was calculated by dividing the decadal ab- sorption (A254/L) at 254 nm (m−1), whereA254 is the ab- sorbance at 254 nm andLthe optical path length of the used cuvette in the spectrophotometer by DOC (mg L−1). Both parameters, SR and SUVA, have been related to the rela- tive molecular weight and aromaticity of DOM (Helms et al., 2008; Weishaar et al., 2003).
A cDOM absorption spectrum,acDOM(λ), is generally ex- pressed as an exponential function:
acDOM(λ) (λ)=acDOM(λ)·e−S(λ−λ0), (3) whereλ0is the absorption coefficient at the reference wave- length andSis the spectral slope ofacDOM(λ)for the chosen
wavelength range. To compare our data with different stud- ies, we converted absorption coefficient values reported in various studies toacDOM350 using an interpolation method developed by Massicotte et al. (2017). Throughout the paper all data are reported as mean±standard deviation.
3.2 Statistical analyses
We used RStudio (version 1.0.153) to perform statistical tests (RStudio Team, 2016). Normality was tested using the Shapiro–Wilk normality test. To determine the difference in means of two populations, we applied the Welch’s two- samplet test if the data were normally distributed with un- equal variances. In the case where data were not normally distributed, we used the Wilcoxon–Mann–Whitney test. To measure the relationship between two variables, we used the Pearson correlation coefficient for normally distributed data and the Spearman rank correlation if the data were not nor- mally distributed.
4 Results
4.1 DOM characteristics and relationships in and across low Arctic (Herschel Island) and high Arctic (Cape Bounty) catchments
Comparing DOC concentrations and cDOM absorption be- tween both study sites, significant differences can be found.
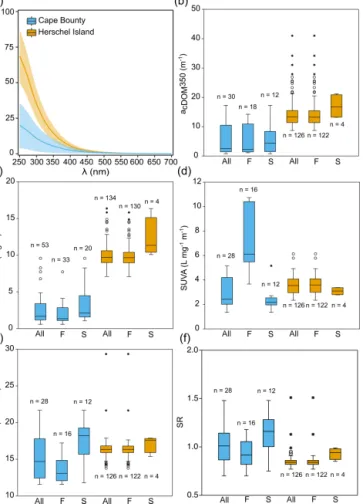
The cDOM absorption is significantly higher (p <0.05) in samples from Herschel Island compared with Cape Bounty across the entire spectrum (Fig. 2a) withacDOM350 of 14.5± 5.1 and 5.5±4.9 m−1respectively (Fig. 2b). DOC concentra- tions show a similar pattern with significantly higher values (p <0.05) on Herschel Island (10.0±1.6 mg L−1) compared to Cape Bounty (2.5±2.0 mg L−1)(Fig. 2c, Table 2).
Comparing the streams on Herschel Island (Fig. 3b), the highest DOC and acDOM350 values are found in the headwaters of Ice Creek West. Ice Creek West has signifi- cantly higher (p <0.05) values in DOC (10.4±1.5 mg L−1) andacDOM350 (16.1±5.4 m−1) than Ice Creek East, which are 8.7±1.1 mg L−1 and 11.1±1.8 m−1 respectively. At Cape Bounty, West River shows the highest DOC (2.5± 1.7 mg L−1) and acDOM350 (8.5±5.2 m−1) compared to other sampled streams. The highest values of DOC and acDOM350 values of flowing are recorded in West River after the 8 August rainfall event.
For both study areas, DOC concentrations are substan- tially higher in standing waters compared to flowing wa- ter (Fig. 2c). Furthermore, on Herschel Island, generally upstream waters show higher DOC concentrations and acDOM350 compared to downstream waters. At Cape Bounty, samples from standing waters in the East River catchment show the highest DOC concentrations andacDOM350 values.
Mean S275–295 on Herschel Island is generally higher (16.4±1.5×10⁻¹nm−1) compared to Cape Bounty (14.8±
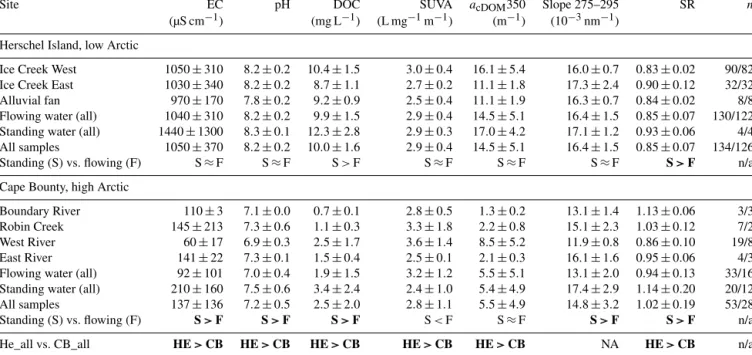
Table 2.Descriptive statistics (mean±standard deviation) of dissolved organic carbon, DOC (mg L−1), specific ultraviolet absorbance, SUVA (L mg−1m−1), coloured dissolved organic matter (cDOM) absorption at 350 nm, acDOM350 (m−1), cDOM slope S275–295 (10−3nm−1), slope ratio SR, electrical conductivity EC (µS cm−1), pH, and the number (n) of all samples/samples with cDOM absorp- tion measurements. The statistics are given for specific streams, samples from flowing waters, standing waters, and all samples on Herschel Island (HE) and Cape Bounty (CB) respectively. The symbols “>” and “<” indicate significant inter-group differences at the alpha=0.95 level. When the inter-group differences are significantly different at the alpha=0.99 level, then they are bold. When the difference is not significant, “≈” is used.
Site EC pH DOC SUVA acDOM350 Slope 275–295 SR n
(µS cm−1) (mg L−1) (L mg−1m−1) (m−1) (10−3nm−1) Herschel Island, low Arctic
Ice Creek West 1050±310 8.2±0.2 10.4±1.5 3.0±0.4 16.1±5.4 16.0±0.7 0.83±0.02 90/82 Ice Creek East 1030±340 8.2±0.2 8.7±1.1 2.7±0.2 11.1±1.8 17.3±2.4 0.90±0.12 32/32 Alluvial fan 970±170 7.8±0.2 9.2±0.9 2.5±0.4 11.1±1.9 16.3±0.7 0.84±0.02 8/8 Flowing water (all) 1040±310 8.2±0.2 9.9±1.5 2.9±0.4 14.5±5.1 16.4±1.5 0.85±0.07 130/122 Standing water (all) 1440±1300 8.3±0.1 12.3±2.8 2.9±0.3 17.0±4.2 17.1±1.2 0.93±0.06 4/4 All samples 1050±370 8.2±0.2 10.0±1.6 2.9±0.4 14.5±5.1 16.4±1.5 0.85±0.07 134/126
Standing (S) vs. flowing (F) S≈F S≈F S>F S≈F S≈F S≈F S>F n/a
Cape Bounty, high Arctic
Boundary River 110±3 7.1±0.0 0.7±0.1 2.8±0.5 1.3±0.2 13.1±1.4 1.13±0.06 3/3
Robin Creek 145±213 7.3±0.6 1.1±0.3 3.3±1.8 2.2±0.8 15.1±2.3 1.03±0.12 7/2
West River 60±17 6.9±0.3 2.5±1.7 3.6±1.4 8.5±5.2 11.9±0.8 0.86±0.10 19/8 East River 141±22 7.3±0.1 1.5±0.4 2.5±0.1 2.1±0.3 16.1±1.6 0.95±0.06 4/3 Flowing water (all) 92±101 7.0±0.4 1.9±1.5 3.2±1.2 5.5±5.1 13.1±2.0 0.94±0.13 33/16 Standing water (all) 210±160 7.5±0.6 3.4±2.4 2.4±1.0 5.4±4.9 17.4±2.9 1.14±0.20 20/12 All samples 137±136 7.2±0.5 2.5±2.0 2.8±1.1 5.5±4.9 14.8±3.2 1.02±0.19 53/28 Standing (S) vs. flowing (F) S>F S>F S>F S<F S≈F S>F S>F n/a He_all vs. CB_all HE>CB HE>CB HE>CB HE>CB HE>CB NA HE>CB n/a
NA – not available; n/a – not applicable.
3.2×10⁻¹nm−1), whereas SUVA values show a broader range at Cape Bounty (from 1.35 to 5.16 mg L−1m−1) com- pared to Herschel Island (from 2.0 to 4.3 mg L−1m−1) (Fig. 2d, Table 2). At Cape Bounty, standing water sam- ples show significantly larger spectral slopes and slope ra- tios (p <0.05) and mostly smaller SUVA (p <0.05) than flowing water samples (Fig. 2d–f). We observed a sig- nificant positive relationship (ρ=0.78,p <0.05) between acDOM350 and DOC concentration for all samples at both sites (Fig. 3a). Whereas on Herschel Island the relationship betweenacDOM350 and DOC follows one linear trend (ρ= 0.72,p <0.05), the relationship at Cape Bounty is broadly separated into two groups, which we schematically indicate by solid ellipsoids that correspond to flowing and standing water. Correlations for both groups are significant (<0.05) and show different spectral slopes. One sample identified as standing water falls into the group of flowing water. We iden- tify this sample as an outlier likely affected by a local DOM source.
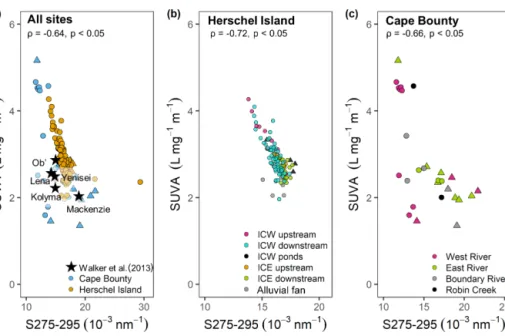
We found a strong negative relationship between SUVA and S275–295 among all water samples from both locations (ρ= −0.64, p <0.05, Fig. 4a). This relationship is even stronger when only samples from Herschel are considered (ρ= −0.72,p <0.05), whereas samples from Cape Bounty
show higher deviations. Reported SUVA and S275–295 from Walker et al. (2013) indicate a similar relationship among the large Arctic rivers (Ob’, Lena, Yenisei, Kolyma and Macken- zie). SUVA and S275 of the large Arctic rivers are located in the centre of our reported values from Herschel Island and Cape Bounty (highlighted in Fig. 4a).
Whereas no difference was found between standing and flowing water on Herschel Island, pH and EC values were significantly higher in standing water at Cape Bounty than in flowing water (Table 2). Robin Creek showed the highest EC values and the largest variability (145±213 µS cm−1) of the Cape Bounty rivers, whereas West River showed the over- all lowest EC values (60±17 µS cm−1). On Herschel Island, both adjacent streams show EC and pH values in the same order of magnitude with a slight decrease at the alluvial fan outflows.
4.2 Hydrochemical and DOM patterns along longitudinal stream transects
The studied streams followed different hydrochemical pat- terns from upstream to downstream (Fig. 5). EC and pH are significantly higher (p <0.05) in surface waters on Her- schel Island (1050±370 and 8.2±0.2 µS cm−1) than at Cape Bounty (137±136 and 7.2±0.5 µS cm−1). On Herschel Is-
Figure 2.Dissolved organic matter (DOM) quality and quantity for the sites from Herschel Island (HE, in orange) and Cape Bounty (CB, in blue).(a)Average cDOM absorption (m−1) for the wave- lengths (λ) between 250 and 700 nm. The coloured shaded ar- eas represent the standard deviation from the mean (solid line).
Boxplots of (b) coloured dissolved organic matter (cDOM) ab- sorption at 350 nm acDOM350 (m−1),(c)dissolved organic car- bon, DOC (mg L−1), (d) specific ultraviolet absorbance, SUVA (L mg−1m−1),(e)cDOM slope S275–295 (10−3nm−1), and slope ratio SR. The plots depict distributions for all samples (all) and sub- sets of flowing water (F) and standing water (S) for each of the site.
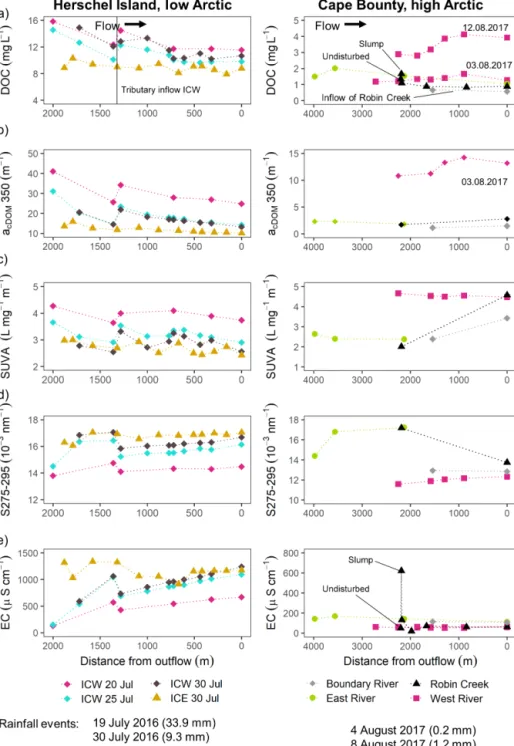
land EC increased from upstream to downstream in Ice Creek West, whereas it varied less in Ice Creek East (Fig. 5e). At Cape Bounty, river samples exhibit no clear visible trends, except for Robin Creek, where an active retrogressive thaw slump is hydrologically connected to the stream. Here, we observed a substantial downstream decrease in EC.
At Herschel Island, overall, DOC concentration and acDOM350 (Fig. 5a) decreased downstream at all sampling periods. However, we observed a stronger decrease in Ice Creek West compared to Ice Creek East. Ice Creek West shows an increase in DOC and acDOM350 concentration at ∼1300 m, where a tributary joins the main stem. On 30 July 2016, when both streams on Herschel Island were sampled simultaneously, Ice Creek East showed signifi-
cantly lower (p <0.05) DOC concentrations andacDOM350 than Ice Creek West throughout the entire profile. At Cape Bounty, DOC concentrations and acDOM350 do not show clear downstream trends but are at a rather low<2 mg L−1 in all streams. One exception is West River after the rainfall event on 12 August 2017, where we found a slight down- stream increase in DOC andacDOM350 with generally higher levels of DOC andacDOM350 compared to the period be- fore rainfall. In Robin Creek, we observed an increase in DOC from 1.3 to 1.7 mg L−1as the stream is impacted by a retrogressive thaw slump, and then DOC decreases there- after. Boundary River shows similar concentrations to Robin Creek. Generally, for Cape Bounty rivers other than West River the number of samples is likely too low to allow clear statements about downstream trends.
SUVA values on Herschel Island showed a similar, however weaker, decreasing downstream trend DOC and acDOM350 (Fig. 5c). Different from DOC and acDOM350, SUVA values of both Herschel Island streams are very sim- ilar. In contrast, at Cape Bounty, West River (sampled af- ter rainfall) showed higher SUVA than the remaining rivers (sampled before the rainfall).
Spectral slope values (S275–295) at Herschel Island showed an increase downstream (Fig. 5d). When sampled on the same day, Ice Creek West showed only slightly smaller spectral slope values along the stream profile compared to Ice Creek East on 30 July 2016. Significant differences were observed between different sampling periods in Ice Creek West. Spectral slope values were smallest after the first rain- fall event (19 July) and increase progressively over the course of the season. The Cape Bounty rivers showed the highest spectral slopes for East River (16.1±1.6×10⁻³nm−1) and the lowest for West River (11.9±0.8×10⁻³nm−1). A slight downstream increase in spectral slope was recorded in West River.
4.3 Temporal changes of DOM under different meteorological conditions
The mean annual air temperature on Herschel Island was
−6.3◦C in 2016 with mean temperatures of 9.4◦C in July and 7.7◦C in August. During the monitoring period, rainfall events of 33.9 mm (19 July), 9.3 mm (30 July), and 12.7 mm (5 August) were recorded. Cape Bounty had a mean annual air temperature of−15.3◦C in 2017, with mean air tempera- tures of 4.5◦C in July and 1.6◦C in August. During the mon- itoring period, two rainfall events of 0.2 mm (4 August) and 1.2 mm (8 August) occurred.
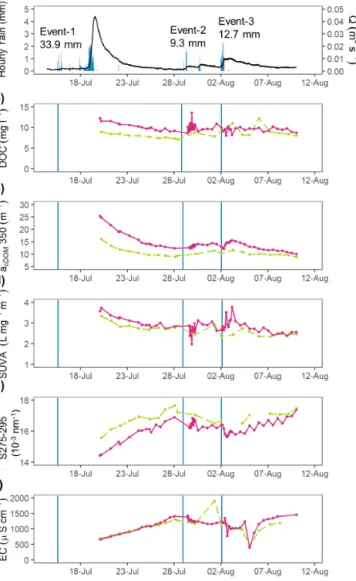
Changes in discharge, DOM composition, and conductiv- ity over the summer season were observed for both streams at Herschel Island. Rainfall response is direct with steep ris- ing hydrographs and elongated falling limbs (Fig. 6a) in both streams (detailed presentation of rainfall response in Coch et al., 2018). In both streams, DOC,acDOM350, and SUVA were highest following the 33.9 mm rainfall event (Event 1).
Figure 3.Absorption of coloured dissolved organic matter (cDOM) at 350 nm (m−1) versus dissolved organic carbon (DOC) concentration (mg L−1) for(a)all sites;(b)sites on Herschel Island depicting the sampling locations Ice Creek West (ICW) upstream, downstream, and ponds; Ice Creek East (ICE) upstream, downstream, and alluvial fan; and(c)sites at Cape Bounty (West River, East River, Boundary River, Robin Creek). Note that flowing water is indicated by a circle while standing water such as lakes or ponds is indicated by a triangle. The cDOM-to-DOC relationships are divided into two different groups(c).
Figure 4.Slope of coloured dissolved organic matter ultraviolet cDOM UV absorption 275–295 (10−3nm−1) versus specific ultraviolet absorbance SUVA (L mg−1m−1) for (a)all sites,(b) sites on Herschel Island depicting the sampling locations Ice Creek West (ICW) upstream, downstream, and ponds; Ice Creek East (ICE) upstream, downstream, and alluvial fan; and(c)sites at Cape Bounty (West River, East River, Boundary River, Robin Creek). Note that flowing water is indicated by a circle while standing water such as lakes or ponds is indicated by a triangle. Midflow SUVA and S275–295 values for the large Arctic rivers (Walker et al., 2013) are added to(a).
Figure 5. Stream transects showing values of(a)dissolved organic carbon (DOC) concentration (mg L−1),(b) absorption of coloured dissolved organic matter (cDOM) at 350 nm,acDOM350 (m−1),(c)specific ultraviolet absorbance SUVA (L mg−1m−1),(d)cDOM Slope S275–295 (10−3nm−1),(e)electrical conductivity (EC) for streams on Herschel Island (left) and Cape Bounty (right). Note that Ice Creek West (ICW) and Ice Creek East (ICE) on Herschel Island were sampled at different dates as indicated in the legend.
Following the rainfall event, declining DOC was accompa- nied by a decline inacDOM350 and SUVA and an increase in S275–295 (Fig. 6b–e). EC is steadily increasing after peak flow in both streams (Fig. 6f).
The subsequent rainfall event (Event 2, 9.3 mm) led to an increase in DOC, acDOM350, and S275–295 and a decrease in SUVA (Fig. 6b–e) in Ice Creek West on 30 July. This dy-
namic was only captured to some extent in Ice Creek East, which was sampled at a longer time interval. Base flow in- creased after this rainfall event (Fig. 6a). EC in both streams drops with peak flow and increases thereafter.
The hydrochemical response to rainfall Event 3 (12.7 mm) was different from the response to Event 2. An initial de- crease in DOC,acDOM350, and S275–295 is followed by a
Figure 6. Time series from Herschel Island in 2016 show- ing (a) discharge (m3s−1) and hourly rainfall (mm) from Ice Creek West, (b) dissolved organic carbon (DOC) concentra- tion (mg L−1), (c) coloured dissolved organic matter absorp- tion at 350 nm acDOM350 (m−1), (d) specific ultraviolet ab- sorbance SUVA (L mg−1m−1), and(e) the cDOM slope S275–
295 (10−3nm−1) over the summer season in 2016 for Ice Creek West (magenta) and Ice Creek East (green) respectively. The on- set of rainfall events is marked with vertical blue lines. As de- scribed in the methods, DOC concentrations were corrected be- tween 30 July and 7 August. The scale depicts only S275–295 val- ues below 18×10−3nm−1to capture the variability; hence the two outliers in Ice Creek East (Fig. 2) are not displayed.
sharp increase in these parameters in Ice Creek West. SUVA shows two peaks on 3 August followed by a general decreas- ing trend until the end of our sampling period 10 August. Ice Creek East had a different response, showing an increase in DOC andacDOM350 and a distinct decrease in SUVA.
5 Discussion
5.1 Catchment processes and DOM alteration 5.1.1 Regional catchment properties of DOM
Our study sites show strong differences in DOM quantity and quality related to their geographic location and envi- ronmental setting. DOM characteristics, such as SUVA and S275–295, provide insights into potential sources, degrada- tion state, and properties of the water bodies. Herschel Island (low Arctic) shows on average significantly higher values in DOC,acDOM350, and SUVA than Cape Bounty (high Arc- tic). Catchment topography (Connolly et al., 2018), vegeta- tion type, and soil characteristics (Harms et al., 2016) are important drivers of DOC concentrations in catchments. The greater abundance of vegetation in the low Arctic (Fig. 1) delivers more organic material resulting in high amounts of lignin introduced into the aquatic system (Sulzberger and Durisch-Kaiser, 2009) compared to the high Arctic. The Her- schel Island tundra catchments have thick organic moss mats and a dense layer of vascular plant cover, which delivers plant detritus that is continuously decomposed resulting in DOC andacDOM350 values higher than in the high Arctic catch- ment at Cape Bounty.
In addition to higher DOM concentrations, we observed that the sampled surface waters in the Herschel Island catch- ments contain DOM with specific optical characteristics for high aromaticity and high molecular weight (Guéguen et al., 2007; Guo et al., 2007) that are indicative of fresh organic matter (Neff et al., 2006; Stedmon et al., 2011). High value ranges and variability of SUVA and S275–295 in the sur- face waters of the Cape Bounty catchments point towards a broad spectra of different DOM sources and quality. The sampled surface waters throughout the 2017 summer season contain DOM with high spectral slope values (S275–295) and low SUVA as well as surface waters with low S275–295 and high SUVA. This is due to different flow pathways, resi- dence time, and permafrost disturbance, delivering DOM of different quality.
At Cape Bounty two different water types were identi- fied based on the acDOM350-to-DOC ratios (Fig. 3c). The group of surface waters with loweracDOM350-to-DOC ra- tios is dominated by standing water bodies. High residence times in standing waters make photodegradation of DOM a dominant process (Vonk et al., 2015b) and result in an in- crease in S275–295 and decrease in the cDOM–DOC ratio.
The group of surface waters with higheracDOM350-to-DOC ratios, higher SUVA, and lower S275–295 are, in contrast, dominated by flowing water. Higher turbidity in flowing wa- ters potentially limits photodegradation processes (Cory et al., 2015, 2014) preserving low S275–295. Within the catch- ments, there may be also more import of fresh organic mate- rial to the flowing water bodies.
5.1.2 Downstream patterns of DOM and impact of permafrost disturbance
Transport and degradation of DOM is a dynamic process.
Vonk et al. (2015b) showed that the microbial and photo- degradability decreased from small streams towards larger rivers within the continuous permafrost zone. The fate of DOM along lateral flow pathways from headwater streams through lakes and large rivers to the ocean is altered by photochemical and biological oxidation (Cory et al., 2015, 2014). Studies show the importance of headwater systems where photodegradation (Cory et al., 2014) and bacterial res- piration of ancient permafrost-derived DOC are prevalent (Mann et al., 2015). Our sampling strategy along the rivers in combination with detailed mapping of the catchments with a focus on permafrost disturbances provide insights into up- stream to downstream patterns in small coastal catchments in both the low and high Arctic.
At Herschel Island, we found a high variability of DOC, SUVA, and S275–295 in the headwaters of Ice Creek West.
The locations at 2000 and 1300 m from the outflow show distinct high values of DOC andacDOM350 compared to the other locations downstream of them. These high concentra- tions are a result of degrading ice-wedge polygons, which heavily influence DOM in the headwaters of the stream (Coch et al., 2020). The location at 1300 m marks the inflow of another headwater tributary impacted by degrading ice- wedge polygons. Thus, the main expected sources for fresh mobilized DOM, from deeper permafrost soil horizons, are the headwaters and tributary water. This is supported by high SUVA and low S275–295 indicating high molecular weight.
DOC and acDOM350 are highest in the headwaters and decrease downstream. Combined with increasing S275–295 along both streams, our results are indicative of a progressive photochemical degradation of DOM. S275–295 has been found to be a good indicator for photodegradation of DOM (Fichot and Benner, 2012; Fichot et al., 2013; Helms et al., 2008) and also been observed along a flow path continuum of the Kolyma River (Frey et al., 2016). They found a relatively constant proportion of bioavailable DOM along the entire flow path, indicating an acclimatization of aquatic microor- ganisms to downstream DOM changes and/or the generation of labile DOM for microbial processing through photodegra- dation. Cory et al. (2014, 2015) show at a subarctic site that DOC in headwater streams, which are directly sourced by soil water, have low prior exposure to light and are therefore prone to photodegradation to CO2.
At Cape Bounty, optical data of downstream patterns are more limited (see Sect. 5.3). West River shows an increase in DOC concentration downstream (3 August 2017), which is also reflected in an increase inacDOM350. As discussed by Fouché et al. (2017) and Wang et al. (2018), the West River is characterized by a downstream increase in autochthonous DOM. SUVA and S275–295 do not show strong differences downstream in the West River, suggesting little modification
of DOM through microbial and/or photodegradation pro- cesses. A retrogressive thaw slump at Robin Creek heavily impacted DOM quality. At∼2100 m distance from the out- flow, closest to the slump, we see the highest DOC, S275–
295, and EC values and lowest SUVA, indicative of low aro- maticity and lower molecular weight.
Abbott et al. (2014) found that DOM is most biodegrad- able during active disturbance at sites in the subarctic. SUVA values at thermokarst outflows in that study were half of the magnitude of the undisturbed reference waters, indicating less aromatic DOC. High S275–295 and SR were observed in conjunction with geomorphic disturbance in headwater streams of West River by Fouché et al. (2017). Impact of ret- rogressive thaw slumps on DOM quality was also studied in the subarctic Peel Plateau by Littlefair et al. (2017). They re- ported dynamics at modestly sized slumps similar to those we observed at Robin Creek: DOC concentration is high- est directly at the slump outflow and is lower downstream compared to undisturbed upstream conditions. The authors attribute low SUVA and high S275–295 within the disturbed site to deep permafrost flow pathways. SUVA values of sur- face waters in Lake Bounty catchments within the slump and downstream are very similar to the ones reported by Little- fair et al. (2017). Overall, DOM characteristics in both study areas are affected by local permafrost disturbances. In sam- pling transects which are not affected by permafrost distur- bances, gradual degradation was observed.
5.1.3 Rainfall event impacts on DOM
Rain magnitude, intensity, and antecedent conditions play an important role in mobilizing DOM in permafrost catch- ments. At Herschel Island, we captured the response to three different rainfall events through continuous sampling at the outflow and repeated sampling along the longitudinal stream profile in Ice Creek West.
Rainfall Event 1 (33.9 mm) was captured only at the reced- ing hydrograph at the outflow (Fig. 6), but along the stream profile in Ice Creek West (Fig. 5). This event of high mag- nitude and intensity led to high SUVA and low S275–295 values indicating fresh plant-derived DOM that is prone to degradation processes, both microbial and photodegradation.
After this event, the hydrograph recedes, and the DOM signa- ture during the “post-rain” conditions suggests a source from deeper in the active layer that contains potentially older car- bon (decreased SUVA and increased S275–295 at the outflow and throughout the profile) than surface soils with mostly re- cently fixed carbon from the vegetation cover. The contrast- ing response of Ice Creek West to rainfall Events 2 and 3 suggests different sourcing of DOM and controlling factors.
During the second rainfall event (9.3 mm), as DOC con- centration increased, we found a decrease in SUVA accom- panied by an increase in S275–295. This indicates a decrease in aromaticity and a lower molecular weight, indicative of more decomposed material. The following event of 12.7 mm
led to a decrease in DOC concentration and S275–295 and an increase in SUVA, indicating an increase in aromaticity and a higher molecular weight – suggesting fresher and lignin-rich plant-derived DOM. A change in water sources for these two rainfall events was examined by Coch et al. (2020). Whereas runoff during the 9.3 mm rainfall event showed the signa- ture of supra-permafrost water, which was forced out dur- ing that rainfall event, runoff during the subsequent 12.7 mm rainfall event reflected the isotopic signature of rain (Coch et al., 2020). Thus, the DOM was first sourced from the surface and through the entire active layer and had a longer residence time than the rain event after.
These results indicate that antecedent (pre-rainfall) soil water conditions play a crucial role in the sourcing of DOM.
The second rainfall event (9.3 mm) occurred about 10 d later, whereas the time difference between the second and the third one was less than 4 d (i.e. the soil was saturated, mobilizing surface OM). In addition to the antecedent conditions, the magnitude and intensity of the rainfall event might also play an important role here. The 9.3 mm rainfall event occurred over a period of 3 d. Thus, the flow pathways during this event might be deeper in the active layer, mobilizing more decomposed OM (Marín-Spiotta et al., 2014). In contrast, the subsequent 12.7 mm event occurred within 1 d, which pre- sumably led to increased overland flow and the mobilization of surface OM. Base flow in this catchment increases with summer rainfall and as the summer season progresses (Coch et al., 2018). The authors also reported a linear increase in DOC export with increasing runoff. Our dataset shows that the quality of exported DOC depends on the intensity of rain- fall and the antecedent conditions, which in turn determine hydrological flow pathways and sourcing of DOM.
When sampling before and after rainfall on Cape Bounty (West River), we found a substantial increase in DOC concentration compared to the pre-rainfall concentrations.
Fouché et al. (2017) conducted an extensive study of DOM quality in four headwater streams of West River (Cape Bounty) and also reported an increase in DOC concentra- tions and fluxes during storm flow. They observed a change in DOM quality: enrichment in fresh low-molecular-weight (LMW), microbially derived, components as indicated by an increase in S275–295 and a decrease in SUVA during rain- fall. Although we do not have data on the optical proper- ties for West River before the rainfall event, similar con- centrations of DOC in the West and East rivers point to- wards similar optical characteristics at that time. Base flow in undisturbed high Arctic headwater streams seems there- fore characterized by more high-molecular-weight (HMW) humic-like components with high aromaticity (low spectral slope and increase in SUVA) relative to storm flow DOM.
In turn, storm flow leads to an export of DOM character- ized by lower molecular weight and decreased aromaticity (high spectral slope, decreased SUVA). Fouché et al. (2017) explain this pattern by a change in flow pathways from shal- low active layer soils (base flow) to subsurface runoff (rain-
fall), where soluble components from mineral soils deeper in the active layer are mobilized. Associated with the change in DOM quality, they also found an increase in total dissolved solids (TDSs) supporting this hypothesis. Impacts of chang- ing flow pathways on DOM quality are also reported from a subarctic setting by Balcarczyk et al. (2009). The increased residence time of percolating water through the active layer leads to a selective sorption of compounds to mineral soil particles. The authors describe that hydrophobic compounds are absorbed, while hydrophilic compounds remain in the so- lution, and are therefore exported from the catchment (Bal- carczyk et al., 2009). Further, an increased residence time and subsurface flow mobilizes DOC that is more microbially degraded (Striegl et al., 2005; Ward and Cory, 2015).
Several studies anticipate a shift towards deeper flow path- ways as active layer depths increase with climate change (Drake et al., 2018; Liljedahl et al., 2016; Mann et al., 2015;
O’Donnell et al., 2014; Ward and Cory, 2015). These stud- ies found that permafrost-derived DOM is more labile and thus easily used by bacteria compared to surface (organic mat) DOM. As described above, we show that different flow pathways are activated during storm flow conditions at the low and high Arctic locations, which influences the quality of DOM exported. At the low Arctic setting our data sug- gest that more permafrost-derived DOM is exported with in- creasing base flow during the season and during a rainfall event of smaller magnitude and lower intensity. Based on the optical properties, this material shows low molecular weight and aromaticity (i.e. it is already altered). In contrast, high- magnitude and high-intensity rainfall events that act on satu- rated soil lead to shorter residence time in the flow path and thus export more fresh (less altered due to different degra- dation processes), near-surface-derived DOM (higher SUVA and lower S275–295). As summer rainfall is projected to in- crease across the Arctic (Bintanja, 2018; Bintanja and Andry, 2017), an increase in DOC export is expected (Coch et al., 2018). Small catchments in the subarctic Canadian Shield have already shifted towards a nival–pluvial flow regime, leading to substantial increases in organic matter fluxes dur- ing fall and winter (Spence et al., 2011, 2015). The DOM quality will depend on the residence time and thus flow path- ways within the catchment, which in turn are controlled by the frequency and magnitude of the rainfall events and the thaw depth of the active layer.
5.2 DOM dynamics of small and large Arctic catchments
The knowledge of ecosystem responses to external distur- bances is necessary for predictive models. Flux of DOM is a significant input into Arctic coastal oligotrophic marine envi- ronments. The major Arctic catchments cover approximately half of the Arctic drainage basin, whereas the remainder is covered by the complex network of smaller catchments. In the Arctic, most historical data and studies on riverine DOM
dynamics are from the major Arctic catchments. Research on small catchments may yield different information to riverine DOM of the major Arctic catchments.
We linked DOC and acDOM350 from this study and the literature (Tables 3 and S1 and S2 in the Supplement) to lat- itude and the soil organic carbon content (SOCC) at 0–30 and 0–100 cm depth as retrieved from Hugelius et al. (2013).
We found a positive correlation (ρ=0.53/0.51,p <0.05) between SOCC and DOC concentration, indicating that veg- etation coverage and the connected SOCC are influencing DOM. The relationship between acDOM350 and SOCC is also significant, although weaker (ρ=0.26/0.34,p <0.05).
It is important to bear in mind that the northern circumpolar soil carbon database is a product of upscaling and will most likely not cover the spatial variability reported in the studies.
Nevertheless, the data show a decrease in SOCC at higher latitudes, influenced by climate and accordingly vegetation cover and related soil cover. DOM and SOCC are further in- fluenced by watershed topography. Longer residence times in low-relief terrain and high hydrologic connectivity facilitate leaching and export of DOM from soil organic matter (Con- nolly et al., 2018; Harms et al., 2016). However, DOM char- acteristics are not always influenced by the subcatchments of the investigated waterbodies. Several of the studies con- tain data on waterbodies with small subcatchments but lo- cated within the large Arctic river floodplains with very large catchment sizes. For example, Dvornikov et al. (2018) re- port untypically high cDOM for tundra lakes in Yamal (west- ern Siberia) and Dvornikov et al. (2018) for tundra lakes in the Lena delta (central Siberia), which are all influenced by the spring flood of the large rivers seasonally flashing high amounts of organic material into these lakes.
Strong positive correlations between DOC andacDOM350 found in this study (Fig. 3a) are also characteristic for river- ine DOM of the large Arctic rivers (Walker et al., 2013), across the land–ocean continuum in the eastern Arctic (Juhls et al., 2019; Mann et al., 2016) and globally (Massicotte et al., 2017). We used DOC and cDOM data available from surface waters in northeastern Canada (Breton et al., 2009), Scandinavia (Forsström et al., 2015; Kellerman et al., 2015), and Alaska (Cory et al., 2015; Larouche et al., 2015). Com- paring our data from the low Arctic and high Arctic sites to those found in the literature confirms the strong positive rela- tionship (ρ=0.85,p <0.05) between DOC andacDOM350 (Fig. S3), indicating the robustness for using the optical pa- rameteracDOM350 as a proxy for DOC concentration in ter- restrial freshwater systems. Compared to DOC concentra- tions and cDOM magnitudes of other small Arctic catch- ments, some of the samples from Cape Bounty show ex- tremely low values, which reflects the low supply of organic matter due to the low plant abundance in the high Arctic.
DOC and cDOM from Herschel Island are within the range of most studies on Arctic catchments whereas studies at high Arctic sites with low vegetation cover are underrepresented.
However, compared to other reported studies with DOC and
cDOM in the same value range, acDOM350 is slightly de- pleted, which is visible in a lower cDOM-to-DOC ratio. This can be a result of stronger photodegradation compared to other sites with eventually more turbid water types, but in- formation on turbidity or suspended matter is frequently not provided in those studies focusing on DOM dynamics and properties.
Due to snowmelt dynamics and active layer development throughout the summer season in Arctic catchments, there is also a strong seasonal influence on the DOC-to-cDOM rela- tionship leading to variability throughout the season and re- gions (Mannino et al., 2008; Vantrepotte et al., 2015). Walker et al. (2013) report SUVA for three different flow regimes of the large Arctic rivers: peak flow (spring freshet), mid- flow (summer), and base flow (winter). The SUVA values reported in this study (2.9±0.4 L mg−1m−1for Herschel Is- land and 2.8±1.1 L mg−1m−1for Cape Bounty) are higher than the mean mid-flow SUVA for the five large Arctic rivers (2.4 L mg−1m−1), which ranges between 2.0 L mg−1m−1in the Mackenzie River and 2.7 L mg−1m−1 in the Ob’. This supports the model proposed by Vonk et al. (2015b), in which DOM exported from smaller rivers has a higher aromatic- ity, which suggests that the material is fresh and less altered by different degradation processes. However, our results also show that a broad range of SUVA as well as S275–295 can be found in small Arctic catchments. This highlights the im- portance of small rivers and streams for the magnitude of potential modification of DOM before waters are exported in the large rivers or directly to the Arctic Ocean. The ra- tio of SUVA versus S275–295 values from the large Arctic rivers (Fig. 4a) falls in the same value range as the ratio from the catchments of Cape Bounty and Herschel Island.
However, SUVA values of the large Arctic rivers are in the low range only, reflecting the higher degradation status of the transported DOM. The results of this study suggest that small Arctic catchments potentially deliver material that is fresher and more prone to degradation compared to DOM of the large Arctic rivers.
5.3 Limitations of cDOM measurements from terrestrial sources
There are some constraints to optical DOM measurements and the nature of the samples themselves that we encoun- tered in this study. As described in the methods section, some samples formed precipitates inside the bottles in the form of small thin flakes, which partly remained in suspen- sion or accumulated at the bottom. All samples were filtered in the field through 0.7 µm glass fibre filters, and the pre- cipitation occurred after filtration during storage. At Cape Bounty, these problematic samples had very highacDOM350 values of 13.9±13.8 m−1with a maximum of 75.8 m−1and SUVA values of 10.1±11.5 L mg−1m−1 with a maximum of 59.5 L mg−1m−1. Those values are significantly higher (p <0.05) than the mean values reported in Table 2 and
Table 3.Correlation matrix using the Spearman’sρcorrelation coefficient between latitude, dissolved organic carbon concentration (DOC), coloured dissolved organic carbon absorption at 350 nm (acDOM350), soil organic carbon content (SOCC) in 0–30 and 0–100 cm depth (Hugelius et al., 2014). Significance levels ofp <0.05 andp≤0.01 (in bold) are indicated.
Latitude acDOM350 DOC SOCC 0–30 cm SOCC 0–100 cm
Latitude 1.00 −0.22 −0.13 −0.19 −0.26
acDOM350 1.00 0.85 0.26 0.34
DOC 1.00 0.53 0.51
SOCC 30 cm 1.00 0.71
SOCC 100 cm 1.00
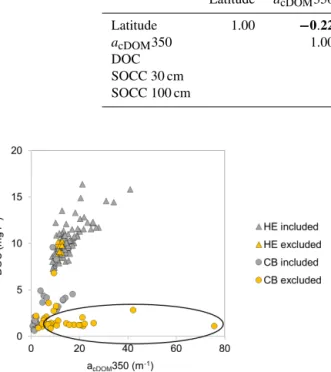
Figure 7.Relationship between coloured dissolved organic matter absorptionacDOM350 (m−1) and dissolved organic matter concen- tration DOC (mg L−1) at Herschel Island (HE) displayed as triangle and Cape Bounty (CB) shown as circle. Samples marked in orange were excluded from the study due to flocculation after filtration (Sect. 3.1). The samples circled in black show disproportionately high absorption values in relation to the DOC concentration.
are not realistic for natural surface waters. At Herschel Is- land,acDOM350 and SUVA did not differ significantly from the mean (11.8±0.8 m−1and 3.5±0.4 L mg−1m−1respec- tively).
As described in the methods section (Sect. 3.1), samples showing precipitates in the laboratory were excluded from the study, even if the absorption values were plausible when compared to the corresponding DOC concentration (Fig. 7).
At Cape Bounty, this was the case for 25 out of 55 sam- ples. We assume that absorbance measurements are high be- cause of scattering by newly formed colloid complexes and precipitates and absorbance from other absorbing dissolved constituents. Also, Hansen et al. (2016) and Weishaar et al. (2003) report that SUVA values above 6.0 L mg−1m−1 are indicative for an optical disturbance due to other con- stituents in the sample (Hansen et al., 2016; Weishaar et al., 2003).
We suggest that the optical interference could be due to polymeric iron (hydr)oxides or high concentrations of dis- solved iron and changing pH conditions of the sample. Dis- solved iron in terrestrially dominated waters is dominantly
complexed with humic and fulvic acids. With changing tem- perature and changing pH of the sample filtrates, redox re- action can result in colloid formation and phase changes, which then strongly affect the optical properties of the sam- ple filtrate by scattering. Poulin et al. (2014) describe how iron (Fe(II,III)) is known to interfere with the absorption of cDOM with a linear dependency of increasing acDOM
with increasing Fe(III) concentration in the water. Poulin et al. (2014) suggest correcting cDOM absorption coefficients according to the iron concentrations using correction coeffi- cients. Coch et al. (2018) report total aqueous dissolved iron concentrations from Herschel Island. High total iron con- centration is found to occur in high acDOM350 (Fig. S2), which indicates a potential influence of iron concentration on the absorption. Fraction of Fe(II) and Fe(III) on the to- tal iron concentration was not measured as a standard hy- drochemistry measurement; thus the correction could not be performed. However, Fig. 7 clearly shows that the samples that were removed fell into the problematic group (circled), where cDOM was overestimated compared to DOC concen- tration. This conservative approach also removed other sam- ples with reasonable cDOM-to-DOC ratios.
Poulin et al. (2014) also showed that in samples with low pH the dominant fraction of iron is Fe(II), which then po- tentially can precipitate as Fe(III) with increasing pH during transport and storage. The Cape Bounty samples that showed a substantially lower pH, likely caused by low vegetation, are therefore more prone to precipitate Fe(III) colloids that affect the optical absorption measurements and lead to the high ab- sorption values at 700 nm (Fig. S4). Herschel Island samples originally already had a higher pH compared to Cape Bounty.
Thus, we expect that the dominant fraction of iron on Her- schel Island was Fe(III), which leads to a lower potential of Fe(III) precipitation compared to Cape Bounty. Catchment properties that influence riverine pH such as the local lithol- ogy may play an important role. In the case of alpine and high Arctic catchments with thin or no soil cover, a bedrock com- position of acid rocks in the catchments will lead to lower pH values in surface waters as is the case for Cape Bounty.
Conversely, surface waters from Herschel Island catchments on glacial moraines and marine sediments are characterized by higher alkalinity.