https://doi.org/10.5194/bg-16-2033-2019
© Author(s) 2019. This work is distributed under the Creative Commons Attribution 4.0 License.
Diapycnal dissolved organic matter supply into the upper Peruvian oxycline
Alexandra N. Loginova1, Sören Thomsen1,2, Marcus Dengler1, Jan Lüdke1, and Anja Engel1
1GEOMAR Helmholtz-Centre for Ocean Research Kiel, Düsternbrooker Weg 20, Kiel 24105, Germany
2LOCEAN-IPSL, IRD/CNRS/Sorbonnes Universites (UPMC)/MNHN, Paris, UMR 7159, France Correspondence:Anja Engel (aengel@geomar.de)
Received: 12 June 2018 – Discussion started: 15 June 2018
Revised: 25 February 2019 – Accepted: 28 April 2019 – Published: 15 May 2019
Abstract. The eastern tropical South Pacific (ETSP) hosts the Peruvian upwelling system, which represents one of the most productive areas in the world ocean. High primary pro- duction followed by rapid heterotrophic utilization of or- ganic matter supports the formation of one of the most in- tense oxygen minimum zones (OMZs) in the world ocean, where dissolved oxygen (O2) concentrations reach less than 1 µmol kg−1. The high productivity leads to an accumulation of dissolved organic matter (DOM) in the surface layers that may serve as a substrate for heterotrophic respiration. How- ever, the importance of DOM utilization for O2 respiration in the Peruvian upwelling system in general and for shap- ing the upper oxycline in particular remains unclear so far.
This study reports the first estimates of diapycnal fluxes and supply of O2, dissolved organic carbon (DOC), dissolved or- ganic nitrogen, dissolved hydrolysable amino acids (DHAA) and dissolved combined carbohydrates (DCCHO) for the ETSP off Peru. Diapycnal flux and supply estimates were obtained by combining measured vertical diffusivities and solute concentration gradients. They were analysed together with the molecular composition of DCCHO and DHAA to infer the transport of labile DOM into the upper OMZ and the potential role of DOM utilization for the attenuation of the diapycnal O2flux that ventilates the OMZ. The observed diapycnal O2flux (50 mmol O2m−2d−1 at maximum) was limited to the upper 80 m of the water column; the O2sup- ply of∼1 µmol kg−1d−1was comparable to previously pub- lished O2 consumption rates for the North and South Pa- cific OMZs. The diapycnal DOM flux (31 mmol C m−2d−1 at maximum) was limited to ∼30 m water depth, suggest- ing that the labile DOM is extensively consumed within the upper part of the shallow oxycline off Peru. The analyses of
DCCHO and DHAA composition support this finding, sug- gesting that DOM undergoes comprehensive remineraliza- tion within the upper part of the oxycline, as the DOM within the core of the OMZ was found to be largely altered. Esti- mated by a simple equation for carbon combustion, aerobic respiration of DCCHO and DHAA, supplied by diapycnal mixing (0.46 µmol kg−1d−1at maximum), could account for up to 38 % of the diapycnal O2supply in the upper oxycline, which suggests that DOM utilization plays a significant role for shaping the upper oxycline in the ETSP.
1 Introduction
Dissolved oxygen (O2) plays a key role for biological pro- duction and cycling of elements in marine ecosystems as well as for the spatial distribution of marine organisms (Ekau et al., 2010; Gilly et al., 2013). The majority of catabolic processes in organisms are conducted by oxidation with O2
(e.g. Bender and Heggie, 1984). The eastern tropical South Pacific (ETSP) embodies one of the largest oxygen mini- mum zones (OMZs) in the world ocean (Karstensen et al., 2008; Paulmier and Ruiz-Pino, 2009). The core of the Peru- vian OMZ is considered to be fully anoxic (e.g. Ulloa et al., 2012), as O2concentrations below the detection limit (DL) of∼0.01 µmol kg−1 were observed between 20 and 400 m depth by high-precision STOX sensor measurements (Revs- bech et al., 2009; Kalvelage et al., 2013; Thomsen et al., 2016a). Those low-O2 concentrations are due to a sluggish ventilation by ocean currents, carrying low-O2waters to the ETSP, and microbial respiration attributed to utilization of or- ganic matter (OM) originating from the upper water column
(e.g. Czeschel et al., 2011; Brandt et al., 2015; Kalvelage et al., 2015).
Elevated primary production in the Peruvian upwelling region above the OMZ (Pennington et al., 2006) leads to an accumulation of both particulate (POM) (Franz et al., 2012a) and dissolved (DOM) organic matter (Romankevich and Ljutsarev, 1990; Franz et al., 2012a; Letscher et al., 2013;
Loginova et al., 2016) in the euphotic zone at the continental margin. POM was recognized to be an important source of carbon (C) for microbial OM mineralization (e.g. Dale et al., 2015), utilization of O2(Kalvelage et al., 2015), and anaer- obic processes, such as nitrogen (N) loss via denitrification (Chang et al., 2010; Kalvelage et al., 2013), in the area. How- ever, the cycling of DOM in the Peruvian upwelling system has been little studied.
DOM that originates in the euphotic zone, as a result of extracellular release by phytoplankton, cell lysis, particle degradation and sloppy zooplankton feeding (Benner, 2002), is commonly enriched in labile and semi-labile DOM. Those are mainly composed of carbohydrates (CHO) and amino acids (AA) (e.g. Ogawa and Tanoue, 2003). CHO and AA are preferentially utilized during microbial decomposition of OM as they serve as energy sources and “building blocks”
for microbes to respire and grow (Skoog and Benner, 1997;
Lee et al., 2000; Amon et al., 2001). Thus, the rapid micro- bial decomposition of labile organic matter in the euphotic zone is commonly followed by slower decomposition of less bioavailable semi-labile DOM and very slow decomposition of extensively reworked refractory DOM deeper in the water column (e.g. Hansell, 2013). Therefore, the composition of DOM reflects its diagenetic history, and the contribution of CHO and AA to DOM may be used as a measure of DOM bioavailability (Davis and Benner, 2007; Davis et al., 2009;
Kaiser and Benner, 2009).
Microbial decomposition of organic matter has previously been suggested to be limited under anoxia (Harvey et al., 1995; Nguyen and Harvey, 1997). Following this suggestion, one may assume that, if labile DOM is mixed into the OMZ, it would not be reworked as rapidly as in oxygenated wa- ters. Recent studies in the upwelling area and the correspond- ing OMZ off Chile found, however, that even under anoxia the ability of microbes to decompose labile DOM (leucine- incorporation rate) did not differ from the oxygenated waters (Sempéré et al., 2008; Pantoja et al., 2009). These studies suggest that slower remineralization of DOM in OMZ might rather be caused by lack of bioavailable organic matter sup- ply into the OMZ than by low-O2conditions. Herewith, mea- sured concentrations of bioavailable components of DOM over the water column in the ETSP are still controversial. For instance, Pantoja et al. (2009) reported relatively high con- centrations of free and combined AA in the OMZ off Chile.
Sempéré et al. (2008) reported low concentrations of neutral CHO in the corresponding upwelling area compared to the open Pacific Ocean.
In contrast to POM, DOM does not obtain its own buoy- ancy, and DOM’s transport is exclusively due to advective and diffusive physical transport processes (e.g. Löscher et al., 2016). In upwelling regimes, turbulent mixing processes are often enhanced at the continental margin, resulting in high di- apycnal fluxes of various solutes (e.g. Schafstall et al., 2010;
Kock et al., 2012; Brandt et al., 2015; Steinfeldt et al., 2015).
On the other hand, the downward fluxes of DOM, or other solutes, may be reduced or even predominated by upwelling fluxes due to Ekman divergence in the coastal upwelling re- gion (e.g. Steinfeldt et al., 2015). Mahadevan (2014) sug- gested that transport of OM (via eddy fluxes) into the OMZ should be accompanied by O2in an amount that is sufficient for full remineralization of the subducted OM. Therefore, this physical transport of OM and O2should stimulate het- erotrophic aerobic respiration in the OMZ that was suggested to be the main pathway of OM remineralization in the upper OMZs by Kalvelage et al. (2015). However, so far, no direct O2and DOM supply estimates exist for the Peruvian OMZ.
Here, we combined physical and biogeochemical obser- vational data that were collected during the R/VMETEOR
“M93” (M93) research cruise to the ETSP off Peru in February–March 2013. Specifically, we directly estimated the diapycnal O2 and DOM supply into the upper oxy- cline off Peru. Additionally, we analysed diapycnal fluxes and the composition of dissolved combined carbohydrates (DCCHO) and dissolved hydrolysable amino acids (DHAA) to learn whether DOM and its labile and semi-labile con- stituents may be supplied to the upper OMZ and the poten- tial contribution of DOM-based respiration to O2flux atten- uation.
2 Methods 2.1 Study area
The observational data were acquired during research cruise
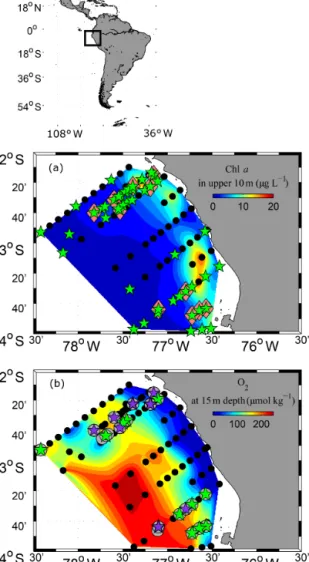
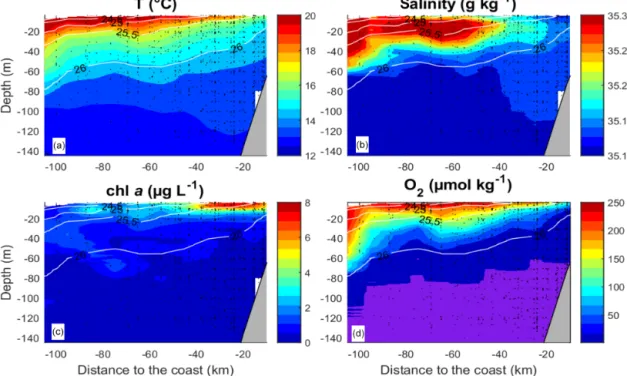
“M93” that took place from 7 February to 9 March 2013 be- tween 12 and 14◦S and 76 and 79◦W off Peru (Fig. 1). Dur- ing the measurement programme, the study area was affected by moderate south-easterly winds (1–9 m s−1) (Thomsen et al., 2016a). The water column was highly stratified during the cruise (Fig. 2a, b). High concentrations of inorganic nu- trients (∼30 µmol L−1NO−3, ∼3 µmol L−1PO3−4 ) just be- low the surface (Thomsen et al., 2016a) collocated with the highest chlorophylla(chla) concentrations near the surface (5–80 m depth; Fig. 2c) (Loginova et al., 2016). The oxy- cline was located at upper 5–80 m depth, where oxygen con- centrations dropped from>200 to<1 µmol kg−1(Fig. 2d) (Thomsen et al., 2016a). In summary, our observations were carried out during a period that corresponds to typical austral summer conditions off Peru.
Figure 1.Study area and station map. CTD stations where CTD- probe and fluorimeter measurements were performed are marked as black dots (a, b). PUMP-CTD stations are depicted in pink diamonds (a). CTD and PUMP-CTD stations where DOM sam- pling was performed are marked as green stars (a). Microstruc- ture measurements combined with oxygen profiles are marked as grey circles(b). Microstructure measurements, combined with dissolved organic matter (dissolved organic carbon (DOC), dis- solved hydrolysable amino acids (DHAA) and dissolved com- bined carbohydrates (DCCHO)) measurements, are marked as green pentagrams (b). Extra microstructure measurements, com- bined with DOC measurements, are marked with violet penta- grams(b). Shaded colours represent chlaconcentrations at upper 10 m depth(a)and oxygen concentrations at 15 m depth(b). Spaces between data points were interpolated by using the TriScatteredIn- terp function (MATLAB, MathWorks).
2.2 Discrete water sampling and analyses
Seawater was sampled with a rosette (GO; General Oceanics, USA) equipped with a conductivity, temperature and depth profiler (CTD; Sea-Bird (SBE) 9-plus, Sea-Bird Electron- ics Inc., USA), an O2optode (SBE43, Sea-Bird Electronics
Inc., USA), a WETStar chlafluorometer (WET Labs, USA) and 24×10 L Niskin bottles. Additional water samples were taken with a PUMP-CTD-System (an integrated measure- ment device, which was developed in collaboration between the Leibniz Institute for Baltic Research (IOW) and the Max Planck Institute for Marine Microbiology (MPI) Bremen:
PUMP-CTD; Strady et al., 2008). In general, samples were collected at three to eight sampling depths from 2 to 70 m at the onshore stations (∼10 km offshore) and from 2 to 200 m at stations offshore (∼100 km offshore). DOC/DON analy- ses were performed for 49 CTD stations and for 8 PUMP- CTD stations. DHAA and DCCHO analyses were performed only for samples from the GO rosette. CTD, O2 and chla recordings were taken at 172 profiles (Fig. 1a).
The CTD was calibrated with discrete seawater samples measured with a Guildline Autosal 8 model 8400B sali- nometer. The O2 optode was calibrated by Winkler titra- tion above the oxycline (Winkler, 1888; Hansen, 2007). The STOX sensor measurements, which revealed O2concentra- tions of 0.01–0.05 µmol kg−1within the OMZ (Revsbech et al., 2009; Thomsen et al., 2016a), were used for O2optode calibration at low-O2 levels. The salinity and O2 measure- ments had a precision of 0.002 g kg−1 and∼1 µmol kg−1, respectively. More details on the salinity and O2calibrations can be found in Thomsen et al. (2016a). Apparent oxygen utilization (AOU) was then calculated as a difference of mea- sured O2concentrations and its equilibrium saturation using the Gibbs-Sea Water Oceanographic Toolbox (McDougall and Barker, 2011) for MatLab (MathWorks, USA) for anal- yses of potential relationships between DOM reworking and the utilization of O2.
The original fluorometer calibration provided by the sen- sor manufacturer (WET Labs, USA) was used throughout the cruise, resulting in chlaconcentrations in µg L−1. More de- tails on the recalibration of the chlafluorimeter can be found in Loginova et al. (2016).
Net primary production (NPP) was estimated for the study area off Peru (12–14◦S and 76–79◦W) and the correspond- ing time period (February 2013) after the model of Behren- feld and Falkowski (1997a) with the Ocean Productivity tool- box (Oregon State University).
DOC/DON duplicate samples (20 mL) were collected into combusted glass ampoules (8 h, 450◦C) after filtration with combusted GF/F filters (5 h, 450◦C). Samples were acidi- fied (80 mL of 85 % H3PO4), sealed with flame and stored at 4◦C in the dark until analysis. DOC samples were analysed by the high-temperature catalytic oxidation method (TOC- VCSH, Shimadzu) using the protocol from Engel and Gal- gani (2016). The detection limit (DL) was 1 µmol L−1. Total dissolved nitrogen (TDN) was determined simultaneously to DOC with a DL of 2 µmol L−1 using the TNM-1 detector of a Shimadzu analyser (Dickson et al., 2007). DON con- centrations were calculated by subtracting inorganic nitrogen concentrations from concentrations of TDN. The description
Figure 2.Mean vertical distribution of the temperature(a), salinity(b),(c)chlorophylla(chla) and(d)O2. O2values below 1 µmol kg−1 are shaded in violet. The data from all transects and stations were averaged over intervals of 10 km on the “Distance from the coast” axis and over 1 m on the “Depth” axis. Isolines represent potential density.
of the instrument calibration and measurements may also be found in Loginova et al. (2015).
Duplicate samples (∼16 mL) for DCCHO were collected into combusted (8 h, 450◦C) 25 mL glass vials after passing through 0.45 µm syringe filters (GHP membrane, Acrodisk, Pall Corporation) and immediately frozen at −20◦C until analyses. Analyses were conducted by high-performance an- ion exchange chromatography (HPAEC) coupled with pulsed amperometric detection following Engel and Händel (2011).
Prior to analyses samples were thawed at room tempera- ture and desalinated by membrane dialysis (1 kDa MWCO, Spectra Por, 5 h at 1◦C). Desalinated duplicate subsamples (2 mL) were hydrolysed using 1.6 mL of 1 M HCl (for each) for 20 h at 100◦C. The hydrolysed samples were neutralized through acid evaporation under N2atmosphere and an addi- tion of miliQ water (20 mL). DCCHO monomers were de- termined from 17.5 mL subsamples on a Dionex ICS 3000 system. More detailed method and calibration descriptions are given in Engel and Händel (2011). The method preci- sion was 2 % with a DL ∼10 nmol L−1. During our study, three classes of polysaccharides were measured. Those were neutral sugars (fucose (Fuc), rhamnose (Rha), arabinose (Ara), galactose (Gal), glucose (Glc), mannose (Man) and xylose (Xyl)), amino sugars (glucosamine (GlcN) and galac- tosamine (GalN)), and acidic sugars including gluconic acid (GluA) and the uronic acids galacturonic acid (GalUA) and glucuronic acid (GlcUA). Man and Xyl were quantified as a mixture due to co-elution, and, therefore, reported together
(ManXyl). Concentrations of DCCHO after hydrolysis are given as monomer equivalents.
Duplicate samples (∼3 mL) for DHAA were filtered with 0.45 µm syringe filters (GHP membrane, Acrodisk, Pall Corporation) and stored frozen (−20◦C) in combusted (8 h, 450◦C) 4 mL glass vials until analyses. Samples were thawed and hydrolysed with 6 N HCl at 100◦C for 20 h prior to analysis. DHAA were determined by HPLC after ortho-phthaldialdehyde derivatization (Lindroth and Mop- per, 1979; Dittmar et al., 2009) with a DL of 2 nmol L−1and a precision of<5 %. The following amino acids were anal- ysed during the study:α-amino acids: aspartic acid (Asp), glutamic acid (Glu), serine (Ser), arginine (Arg), glycine (Gly), threonine (Thr), alanine (Ala), tyrosine (Tyr), valine (Val), phenylalanine (Phe), isoleucine (Ileu), leucine (Leu);
andγ-amino acid:γ-aminobutyric acid (GABA). The amino acids asparagine and glutamine likely contributed to the mea- sured Asp and Glu concentrations, respectively, due to deam- ination during hydrolysis. Alpha aminobutyric acid was used as an internal standard to account for losses during han- dling. Concentrations of DHAA after hydrolysis are given as monomer equivalents. A more detailed description of the method may be found in Engel and Galgani (2016).
2.3 Diapycnal flux calculations
To estimate the diapycnal fluxes of various solutes, CTD sen- sor (O2) and bottle data (DOC, DON, DCCHO and DHAA)
were combined with near-simultaneous measurements of turbulence in the water column. The turbulence measure- ments were performed with a microstructure profiling sys- tem (MSS) from the rear of the vessel. The loosely tethered profiler (MSS90-D, S/N 32, Sea & Sun Technology) was op- timized to sink at a rate of 0.55 m s−1and was equipped with three shear sensors and a fast-response temperature recorder, as well as an acceleration sensor, two tilt sensors and CTD, sampling with lower response time. At each CTD station, three to six microstructure profiles were collected. Standard processing procedures were used to determine the rate of ki- netic energy dissipation of turbulence in the water column (ε, m2s−3), as given in Schafstall et al. (2010).
Diapycnal diffusivities (Kρ, m2s−1)were determined at 14 m depth intervals, following Osborn (1980):
Kρ=0 ε
N2, (1)
whereN is stratification (in s−1) and 0is the mixing effi- ciency, for which a value of 0.2 was used. The diapycnal diffusivity of the solutes (O2, DOC, DON, DCCHO, and DHAA) –KS– was assumed to be equivalent to the diapy- cnal diffusivity of the massKρ (e.g. Schafstall et al., 2010;
Fischer et al., 2013).
The diapycnal fluxes (mmol m−2d−1)of the different so- lutes listed above were estimated using Eq. (2), implicitly assuming equivalency of vertical and diapycnal diffusivities (KS≈Kρ).
8S= −Kρ∇CS, (2)
where∇CSis the vertical gradient of the molar concentration of the solutes (mmol m−4).
The mean diapycnal supply (−∇8S, µmol kg−1d−1) of a solute was determined at 28 m depth intervals as an attenua- tion of the diapycnal solute flux profile over depth, according to Eq. (3):
−∇8S= −1 ρ
∂
∂z8S, (3)
whereρ is thein situdensity of the seawater (kg m−3),zis depth (m) and8S(mmol m−2d−1) is the estimated mean di- apycnal flux profile of a solute. The mean diapycnal solute supply was interpreted to balance the amount of a solute that is lost per unit of time over a specific depth interval of the water column due to the microbial utilization of the solute.
This interpretation assumes that sources other than turbulent mixing or sinks other than microbial consumption are negli- gible.
For DCCHO and DHAA the diapycnal flux estimates were based on 14 combined CTD/MSS stations, while for DOC and DON fluxes 22 stations were available (Fig. 1b). The di- apycnal O2flux was determined from 50 combined stations.
All combined data sets include stations from the continen- tal slope, as well as stations in deeper waters, where bottom depth was larger than 4000 m.
For each combined CTD/MSS station a meanKρwas es- timated based on aN2 profile (CTD) and mean dissipation profile (turbulence probe) averaged over all MSS profiles conducted at the CTD station. In combination with the verti- cal solute gradient, a mean flux profile for each station was estimated. Only measurements below the mixed layer, which was defined by a threshold criterion of a 0.2◦C temperature decrease below the maximum and a minimum depth of 10 m, were used. Measurements from different sensors and instru- ments were averaged in temperature space to reduce the im- pact of internal waves.
The mean diapycnal flux (8S) was determined by arith- metically averaging all fluxes from individual stations in 14 m depth intervals. The diapycnal solute supply was then determined from the divergence of the mean diapycnal flux (∇8S).
The 95 % confidence interval of the diapycnal flux was calculated following the procedure described by Schafstall et al. (2010). From this error estimate the uncertainty of the supply was derived by error propagation.
A simple equation of carbon combustion,
1C+1O2=1CO2, (R1)
was used for a rough estimation of the percentage of di- apycnal O2supply that may be consumed by heterotrophic communities, if they use all the C, supplied by the diapycnal fluxes of DOC, DCCHO and DHAA.
2.4 Statistical analyses of DOM composition
Principal component analysis (PCA) was performed us- ing environmental factors (temperature, salinity and AOU) and relative abundances of α-DHAA and neutral DCCHO (mol%) to examine “compositional trends” (i.e. changes in composition in response to an influence of an environmental parameter) in marine DOM in the studied area. The aim of the PCA was also to explore the potential interrelation be- tween low-O2and DOM composition. For this, temperature, salinity and AOU and relative abundances of labile organic matter from the open Atlantic and Pacific oceans (Kaiser and Benner, 2009) were included in the PCA for the representa- tion of a well-oxygenated water column. The covariance be- tween principle components and an individual parameter was considered significant when the module of the coordinate of the parameter exceeded 0.5 on the “variables factor map”.
The PCA was performed using the “FactorMineR” package (Husson et al., 2010) for “R” (R Core Team, 2013).
3 Results
3.1 Distribution of O2and DOM
In this section the horizontal and vertical distributions of O2 and the different DOM components including DOC, DON
and their labile and semi-labile constituents, DCCHO and DHAA, are described. The vertical gradients of the differ- ent solutes are crucial for estimating the associated diapyc- nal fluxes, as described in Sect. 3.2. Near-surface O2 con- centrations were observed, ranging between 100 µmol kg−1 at the coast and 240 µmol kg−1 further offshore (Fig. 2d).
These values dropped to less than 1 µmol kg−1 at <50 m depth near the coast (<40 km offshore) and ∼80 m depth offshore (>40 km) (Fig. 2d).
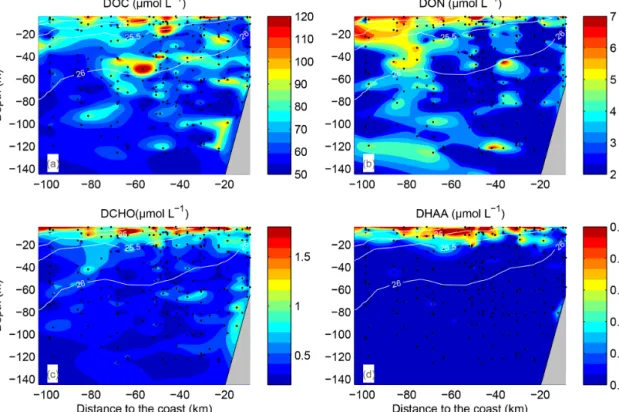
DOC concentrations ranged from more than 100 µmol L−1 near the surface to <50 µmol L−1 below 40 m depth (Fig. 3a). Patches of isolated DOC maxima (up to 120 µmol L−1) were measured at a depth range from 20 to 120 m (Fig. 3a). DOC concentrations of>100 µmol L−1had been reported previously for the water column off Peru (Ro- mankevich and Ljutsarev, 1990; Franz et al., 2012a). How- ever, since concentrations >100 µmol L−1 were observed only sporadically, we cannot exclude a possible contamina- tion of these samples. The main decrease in DOC occurred between 5 and 30 m. Thus, the main vertical DOC gradient was found at shallow depth compared to the oxycline. This becomes even more apparent when comparing the mean ver- tical profiles of O2and DOC (Fig. 4a, b).
DON concentrations were also highest (∼7–8 µmol L−1) near the surface (Fig. 3b) and varied from below detection to 4–5 µmol L−1at greater depth. The main decrease in DON concentrations occurred within the upper 10 m of the water column (Fig. 4c).
DCCHO concentrations varied from 0.2 to 4.2 µmol L−1 (Fig. 3c), with the highest concentrations near the surface. C contained in DCCHO represented 1 to a maximum of 25 % of DOC in the studied depth range. Amino sugars were rep- resented solely by GlcN, as GalN was below DL in most samples. Acidic sugars were mainly represented by uronic sugars, i.e. GluUA and GalUA (Table 1), while GlcA was detected only sporadically. Overall, amino sugars and acidic sugars comprised 0.04±0.03 and 0.02±0.02 µmol L−1, con- tributing 6±3 % and 3±2 % to DCCHO, respectively. Thus, the major part of DCCHO was represented by neutral sug- ars (Table 1). DHAA concentrations varied from 0.075 to 1.39 µmol L−1 (Fig. 3d). Like for DCCHO, the highest DHAA concentrations were found above the oxycline, where C contained in DHAA represented 2±1 % DOC (maxi- mum of 4 %) and nitrogen (N) contained in DHAA repre- sented 15±14 %DON. The lowest DHAA concentrations were mainly found below 80 m depth and were equivalent to∼1 %DOC and 6 %DON–8 %DON (Table 1). The major part of DHAA was represented byα-amino acids. The con- centrations of GABA, which is commonly used as a signature of microbial activity (Davis et al., 2009), was very low in all samples and represented generally<1 % of DHAA. In sum- mary, the concentrations of all the DOM compounds were highest above the oxycline and the mean concentration gra- dients of the DOM compounds were restricted to a shallower depth compared to the mean gradient of O2(Fig. 4).
3.2 Diapycnal fluxes and supply
As outlined in the previous section, vertical gradients of O2, DOC, DON and their constituents were observed at 10 to 80 m depth in the study area. In this section we combine these vertical gradients with turbulence measurements to estimate the associated diapycnal fluxes and supply, i.e. the diapycnal flux divergences.
For O2, the mean diapycnal flux (∇8O2) exhibited a max- imum of 50 mmol O2m−2d−1at∼20 m depth. It decreased deeper in the water column and vanished at 80 m depth due to a lack of vertical concentration gradients. Onshore (<40 km) and offshore (>40 km) O2fluxes did not differ statistically.
This likely was due to the fact that while vertical oxygen gradients were enhanced in the offshore region (Fig. 4a), the turbulence and, thus, eddy diffusivities were elevated in the onshore region. The mean diapycnal supply O2(∇8O2) ranged from 1.2 µmol kg−1d−1at 10–24 m depth to near zero at 80 m depth (Table 2). Again, onshore (<40 km) and off- shore (>40 km) the diapycnal O2supply was not statistically different.
In contrast, mean diapycnal fluxes of DOC (8DOC) were limited to shallower depth. Near the surface, 8DOC was 31 mmol C m−2d−1 and vanished already at ∼50 m depth (Table 2). The diapycnal supply of DOC (∇8DOC) exhibited a maximum of 1.8 µmol C kg−1d−1 at 10–38 m depth (1.5 times larger than∇8O2) (Table 2, Eq. 4). Compared to NPP, estimated to 3.9 (0.6–8.6) gC m−2d−1for our study area and period, the DOC flux represented a maximum of∼10 %NPP at∼20 m depth to near zero %NPP at∼50 m depth. As was mentioned in Sect. 3.1, we did not find a vertical DON gra- dient, resulting in very low diapycnal DON fluxes and sup- ply estimates (Table 2). However, N fluxes were obtained from DHAA transport. Mean C and N fluxes via DCCHO and DHAA ranged from near zero below 30–40 m depth to 6 mmol C m−2d−1 (8DCCHO(C)), 0.9 mmol C m−2d−1 (8DHAA(C)) and 0.3 mmol N m−2d−1 (8DHAA(N)) at 10–
20 m depth (Table 2). The diapycnal C and N supply via DC- CHO and DHAA ranged from near zero to a maximum of 0.4 µmol C kg−1d−1 (∇8DCCHO(C)), 0.06 µmol C kg−1d−1 (∇8DHAA(C)), and 0.02 µmol N kg−1d−1 (∇8DHAA(N)) at 10–38 m depth. The diapycnal C supply via DCCHO and DHAA at its maximum comprised∼38 % of∇8O2, when estimated by Eq. (4). In summary, our diapycnal flux and sup- ply calculation revealed that the diapycnal O2supply reaches deeper into the oxycline than the diapycnal DOM supply.
This is especially true for DCCHO and DHAA, representing the labile and semi-labile parts of DOM.
3.3 Linking the DOM composition and the utilization of O2
To understand whether low-O2conditions of the OMZ may cause changes in DOM composition, we complement our quantitative estimates of the DOM and O2 supply with the
Table1.Relativecomposition(mol%)ofdissolvedhydrolysableaminoacids(DHAA)anddissolvedcombinedcarbohydrates(DCCHO)inthewatercolumn.“n.d.”–notdetectable. Abbreviations“nS”,“SN”and“SA”standforneutralsugars,aminosugarsandacidicsugars,respectively.Thenumberofsamplesateachdepthinterval,usedforcalculationofthe averagevalue,isgivenasn.ThemeanvaluesforDHAAandDCCHOcompositionbelowthemixedlayer(10to122m)arereportedforsimilardepthintervals(14m)asdiapycnal DOMandO2fluxes.ThemeanvaluesforDHAAandDCHOwithinthemixedlayerarereportedfor∼5mdepthintervals. Depth(m)nDHAAmol%DHAA (µmolL−1)(%DOC)(%DON)GlyThrAlaAspGluSerArgLeuValIleuPheTyr 1–5300.6±0.32±115±1022±49±111±117±115±311±22.3±0.34±13.0±0.42.5±0.62.4±0.41.8±0.4 5–10250.5±0.32.3±0.915±923±49±211±117±115±410±12.2±0.44±12.9±0.62.1±0.52.1±0.41.7±0.3 10–24480.4±0.21.8±0.816±1425±49±211±117±113±29±12.1±0.63±12.8±0.72.2±0.72.1±0.61.9±0.5 24–38280.24±0.071.2±0.312±1428±310±112±117±111±29±11.9±0.43±12.4±0.61.9±0.61.8±0.42.0±0.7 38–52340.20±0.051.0±0.49±729±610±212±216±211±29±11.8±0.63±22.3±0.81.7±0.51.8±0.41.7±0.4 52–66350.17±0.030.9±0.313±1931±310±212±116±110±28±11.7±0.42±12.4±0.51.6±0.71.7±0.31.7±0.5 66–80270.16±0.050.9±0.39±832±410±112±115±210±28±11.7±0.52±12.5±0.61.7±0.81.7±0.41.8±0.5 80–94220.15±0.080.9±0.48±734±310±212±215±110±29±11.6±0.42±12.2±0.71.3±0.71.6±0.41.6±0.4 94–108140.13±0.030.7±0.29±834±310±213±215±29±28±21.6±0.52±12.3±0.72±11.7±0.41.7±0.9 108–122130.13±0.030.8±0.26±432±310±212±116±210±28±11.7±0.33±12.3±0.82±11.9±0.41.7±0.5 122–200180.12±0.030.7±0.38±635±310±112±215±29±18±21.5±0.72±12.5±0.61.7±0.71.5±0.41.5±0.5 Depth(m)nDCCHO(µmolL−1)mol%DOCmol%nSmol%SA nSSNSAnSSNSAGlcManXylGalRhmFucAraGluUAGalUAGlcA 1–5301.5±0.80.10±0.030.10±0.089±40.6±0.20.6±0.330±1332±617±611±88±22±148±2151±210.4±2 5–10251.1±0.60.08±0.030.07±0.058±40.5±0.10.5±0.333±1133±516±68±68±22±143±2655±242±10 10–24470.7±0.30.06±0.020.04±0.035±20.4±0.10.3±0.236±1337±812±55±47±22±132±2567±251±7 24–38280.4±0.10.04±0.010.02±0.024±10.3±0.10.2±0.143±1138±79±42±26±20.4±1.020±2080±20n.d. 38–52350.4±0.20.03±0.010.02±0.014±20.3±0.10.1±0.142±1041±99±32±25±20.3±0.828±3072±30n.d. 52–66340.5±0.20.03±0.010.02±0.024±20.2±0.10.2±0.245±941±97±42±25±20.2±0.621±2777±282±11 66–80270.4±0.20.02±0.010.01±0.014±20.2±0.10.1±0.147±1344±125±31±13±20.3±0.719±2881±28n.d. 80–94220.4±0.20.02±0.010.01±0.014±20.2±0.10.1±0.147±1145±104±30.1±0.62±20.7±1.332±3368±33n.d. 94–108150.3±0.10.02±0.010.01±0.013±10.2±0.10.1±0.153±1140±104±30.1±0.52±20.2±0.928±2972±29n.d. 108–122130.4±0.10.02±0.010.02±0.024±20.2±0.10.2±0.251±1643±143±30.2±0.72±20.3±1.044±4656±46n.d. 122–200180.4±0.20.02±0.010.01±0.024±10.2±0.10.1±0.252±1044±92±2n.d.1±20.7±2.322±3078±30n.d.
Figure 3.Dissolved organic carbon (DOC)(a), dissolved organic nitrogen (DON)(b), dissolved combined carbohydrates (DCCHO)(c)and dissolved hydrolysable amino acids (DHAA)(d)distributions over the water column. Data from all transects and stations were plotted against distance to coast (kilometres). Space between data points was interpolated by using the TriScatteredInterp function (MATLAB, MathWorks).
Isolines represent potential density, averaged over intervals of 10 km on the “Distance from the coast” axis and over 1 m on the “Depth” axis.
Figure 4.Vertical distribution of O2(a), DOC(b), DON(c), DCCHO(C)(d), DHAA(C)(e), and DHAA(N)(f). Black line and error bar represent mean distribution and standard deviations of the data points (grey circles), respectively. The blue and red lines and shaded areas represent the mean distributions and standard deviations of parameters onshore (<40 km) and offshore (>40 km), respectively.
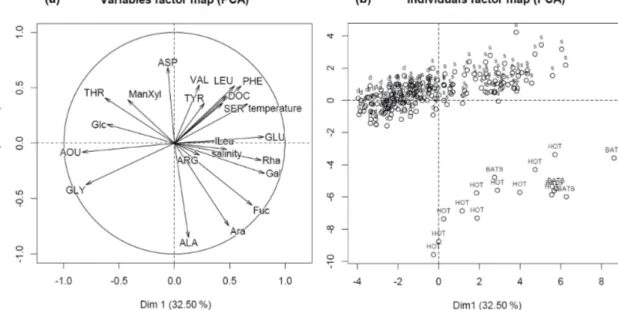
analyses of DOM quality. For this, the composition of neutral DCCHO and DHAA via PCA was compared to environmen- tal factors, i.e. temperature, AOU and salinity, and to organic matter composition from the well-oxygenated water column as described in Kaiser and Benner (2009). The first princi- ple component (Dim.1) (Fig. 5, “variables factor map”) of
the PCA was strongly influenced by AOU, indicating the in- terrelation of the DOM composition and removal of O2. The utilization of O2 was accompanied by selective removal of Glu, Phe, Leu, ILeu and Ser, and Rha, Gal, and Fuc (Fig. 5, Table 1). Gly, Thr and Glc mol% were increasing along with an increase in AOU (Fig. 5). In general, the composition of
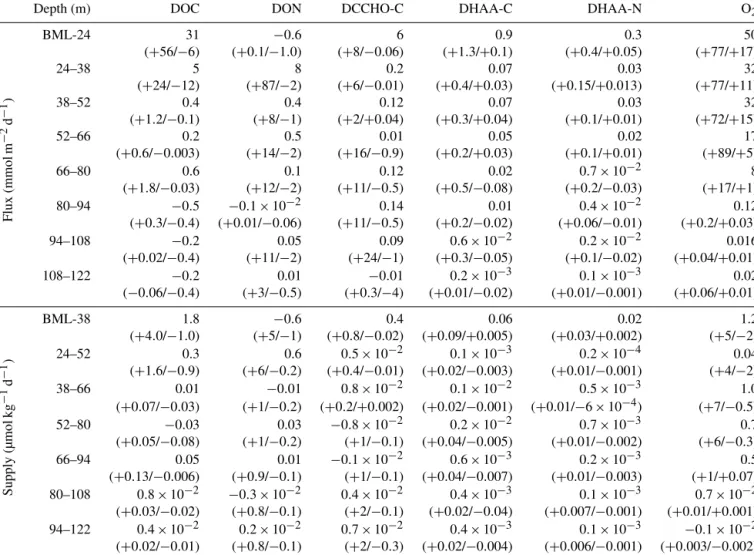
Table 2.Diapycnal fluxes and supplies of O2and DOM: DOC, DON, dissolved organic carbon in DCCHO and DHAA and dissolved organic nitrogen in DHAA; 95 % confidence intervals, calculated following Schafstall et al. (2010) for each parameter, are presented in brackets.
BLM – “below the mixed layer” – a depth, defined below 10 m of the water column, using a threshold criterion of 0.2◦C temperature decrease.
Depth (m) DOC DON DCCHO-C DHAA-C DHAA-N O2
Flux(mmolm−2d−1)
BML-24 31 −0.6 6 0.9 0.3 50
(+56/−6) (+0.1/−1.0) (+8/−0.06) (+1.3/+0.1) (+0.4/+0.05) (+77/+17)
24–38 5 8 0.2 0.07 0.03 32
(+24/−12) (+87/−2) (+6/−0.01) (+0.4/+0.03) (+0.15/+0.013) (+77/+11)
38–52 0.4 0.4 0.12 0.07 0.03 32
(+1.2/−0.1) (+8/−1) (+2/+0.04) (+0.3/+0.04) (+0.1/+0.01) (+72/+15)
52–66 0.2 0.5 0.01 0.05 0.02 17
(+0.6/−0.003) (+14/−2) (+16/−0.9) (+0.2/+0.03) (+0.1/+0.01) (+89/+5)
66–80 0.6 0.1 0.12 0.02 0.7×10⁻² 8
(+1.8/−0.03) (+12/−2) (+11/−0.5) (+0.5/−0.08) (+0.2/−0.03) (+17/+1)
80–94 −0.5 −0.1×10⁻² 0.14 0.01 0.4×10⁻² 0.12
(+0.3/−0.4) (+0.01/−0.06) (+11/−0.5) (+0.2/−0.02) (+0.06/−0.01) (+0.2/+0.03)
94–108 −0.2 0.05 0.09 0.6×10⁻² 0.2×10⁻² 0.016
(+0.02/−0.4) (+11/−2) (+24/−1) (+0.3/−0.05) (+0.1/−0.02) (+0.04/+0.01)
108–122 −0.2 0.01 −0.01 0.2×10⁻³ 0.1×10⁻³ 0.02
(−0.06/−0.4) (+3/−0.5) (+0.3/−4) (+0.01/−0.02) (+0.01/−0.001) (+0.06/+0.01)
Supply(µmolkg−1d−1)
BML-38 1.8 −0.6 0.4 0.06 0.02 1.2
(+4.0/−1.0) (+5/−1) (+0.8/−0.02) (+0.09/+0.005) (+0.03/+0.002) (+5/−2)
24–52 0.3 0.6 0.5×10⁻² 0.1×10⁻³ 0.2×10⁻⁴ 0.04
(+1.6/−0.9) (+6/−0.2) (+0.4/−0.01) (+0.02/−0.003) (+0.01/−0.001) (+4/−2)
38–66 0.01 −0.01 0.8×10⁻² 0.1×10⁻² 0.5×10⁻³ 1.0
(+0.07/−0.03) (+1/−0.2) (+0.2/+0.002) (+0.02/−0.001) (+0.01/−6×10−4) (+7/−0.5)
52–80 −0.03 0.03 −0.8×10⁻² 0.2×10⁻² 0.7×10⁻³ 0.7
(+0.05/−0.08) (+1/−0.2) (+1/−0.1) (+0.04/−0.005) (+0.01/−0.002) (+6/−0.3)
66–94 0.05 0.01 −0.1×10⁻² 0.6×10⁻³ 0.2×10⁻³ 0.5
(+0.13/−0.006) (+0.9/−0.1) (+1/−0.1) (+0.04/−0.007) (+0.01/−0.003) (+1/+0.07)
80–108 0.8×10⁻² −0.3×10⁻² 0.4×10⁻² 0.4×10⁻³ 0.1×10⁻³ 0.7×10⁻²
(+0.03/−0.02) (+0.8/−0.1) (+2/−0.1) (+0.02/−0.04) (+0.007/−0.001) (+0.01/+0.001)
94–122 0.4×10⁻² 0.2×10⁻² 0.7×10⁻² 0.4×10⁻³ 0.1×10⁻³ −0.1×10⁻²
(+0.02/−0.01) (+0.8/−0.1) (+2/−0.3) (+0.02/−0.004) (+0.006/−0.001) (+0.003/−0.002)
DOM from the surface samples from our study was simi- lar to the composition of DOM from the samples, collected from well-oxygenated open ocean sites by Kaiser and Ben- ner (2009), as the individual scores of the samples cluster together on Dim.1 of the PCA (Fig. 5, “individuals factor map”). The samples collected within the OMZ were much poorer in composition, even in comparison to the deepest open ocean samples (∼4000 m), as they grouped from the negative side of Dim.1.
The differences on the second dimension of PCA (Dim.2) were driven likely by regional differences in the DOM com- position, i.e. by mol% of Ala, Arb, and Fuc, and distributions of mol% Asp, Phe, Val and Leu over depth (Fig. 5, Table 1, Kaiser and Benner, 2009).
4 Discussion
The observed distributions of O2and of DOC and DON com- ponents are the result of sinks and sources in the water col- umn mainly due to microbial processes and isopycnal and diapycnal supply (i.e. flux divergences) controlled by phys- ical processes. A quantification of each of those individual processes is essential for understanding of important mech- anisms controlling O2 and organic matter cycling off Peru and, therefore, the formation and maintenance of the Peru- vian OMZ.
Previous studies have shown that turbulent mixing pro- cesses in the eastern boundary upwelling systems (EBUS) are strongly enhanced and that the resulting diapycnal sup- ply is often a leading term in the flux divergence balances of O2, nutrients and other solutes in the upper ocean (e.g.
Schafstall et al., 2010; Kock et al., 2012; Brandt et al., 2015;
Steinfeldt et al., 2015).
Figure 5.The PCA output: variables(a)and individual scores of samples(b). The samples, collected above 50 m depth, are marked with abbreviation “s”, the ones below 50 m depth with abbreviation “d”. The samples, which are used for comparison, are marked with acronyms
“HOT” and “BATS”, and represented well-oxygenated samples collected from the open Pacific and open Atlantic oceans, respectively (Kaiser and Benner, 2009).
The diapycnal O2and DOM fluxes and supply determined in this study represent average values for the continental margin ranging from the shelf to about 100 km offshore.
This spatial averaging is likely responsible for a lower near- surface diapycnal O2flux (50 mmol O2m−2d−1) compared to other EBUS. For example, Brandt et al. (2015) determined a near-surface diapycnal O2flux of 73 mmol O2m−2d−1in the Mauritanian upwelling during the high-productivity sea- son in boreal winter. In their study, the diapycnal O2 flux was able to sustain benthic respiration on the continental shelf down to a bottom depth of 100 m. Herewith, the diapy- cnal O2supply found in our study was of similar magnitude to the rates of O2 consumption (∼1 µmol kg−1d−1) deter- mined byin situincubations at 50–80 m water depth during the austral summer season in the ETSP off Peru (Kalvelage et al., 2015) and similar estimates for North and South Pacific OMZs (Revsbech et al., 2009; Tiano et al., 2014).
Other terms of the O2transport budget such as isopycnal supply by mesoscale (Thomsen et al., 2016a) and subme- soscale (Thomsen et al., 2016b) dynamics or fluxes due to upwelling (e.g. Steinfeldt et al., 2015) might play an impor- tant role for the distribution of O2in the upper ocean, par- ticularly in the region of the continental slope and the shelf.
In turn, the deep chl amaximum formed by photosynthetic cyanobacteria, i.e.Prochlorococcus, that have been found in the ETSP (Lavin et al, 2010; Ulloa et al., 2012; Meyer et al., 2017) may provide an additional O2source at depth. Fur- thermore, the presented diapycnal fluxes and supply of O2 were determined from the data collected during ocean set- tings typical of the austral summer season of non-El Niño/La Niña years. In the water column, O2concentrations and back-
ground settings for the production of turbulence were shown to vary substantially on seasonal and interannual timescales (e.g. Graco et al., 2017). Thus, the diapycnal fluxes and sup- ply of O2shall vary on the same timescales. Therefore, our results should be considered the first estimates of diapycnal O2fluxes and supply in the ETSP off Peru during the austral summer season during non-El Niño/La Niña regime.
Like for O2, the transport of DOM through the water col- umn is achieved by advective and diffusive transport pro- cesses. Therefore, along with turbulent mixing, other trans- port terms will also take their turn in shaping the DOM dis- tribution off Peru. For instance, vertical advection (i.e. up- welling) transports deep water, which is characterized by highly altered DOM and low DOC concentrations, into the upper ocean near the continental margins. The upwelling may counteract the turbulent downward flux of DOC and, therefore, contribute to a “compression” or sharpening of the vertical DOM concentration and composition profiles.
This is unique to upwelling systems and different to the open ocean regions where low-DOC concentration gradi- ents and smaller changes in the DOM composition were ob- served at similar depth (Kaiser and Benner, 2009). Addition- ally, mesoscale (Thomsen et al., 2016a) and submesoscale (Thomsen et al., 2016b) dynamics have been observed in the studied area. They were shown to modify nutrient and O2dis- tributions by stirring the water across the continental slope, and likely influence the DOM distribution off Peru too. How- ever, no quantitative information on DOM fluxes associated with upwelling, mesoscale or submesoscale dynamics off Peru is available to date. Seasonal and interannual variations in physical dynamics may also affect DOM distribution off