www.giga-hamburg.de/workingpapers
GIGA Working Papers serve to disseminate the research results of work in progress prior to publicaton to encourage the exchange of ideas and academic debate. Inclusion of a paper in the Working Papers series does not constitute publication and should not limit publication in any other venue. Copyright remains with the authors.
GIGA Research Programme 3:
Socio-Economic Challenges in the Context of Globalisation
___________________________
Technological Readiness in the Middle East and North Africa –
Implications for Egypt Juliane Brach
No 155 December 2010
GIGA Working Papers
Edited by the
GIGA German Institute of Global and Area Studies Leibniz‐Institut für Globale und Regionale Studien
The GIGA Working Papers series serves to disseminate the research results of work in pro‐
gress prior to publication in order to encourage the exchange of ideas and academic debate.
An objective of the series is to get the findings out quickly, even if the presentations are less than fully polished. Inclusion of a paper in the GIGA Working Papers series does not consti‐
tute publication and should not limit publication in any other venue. Copyright remains with the authors. When working papers are eventually accepted by or published in a journal or book, the correct citation reference and, if possible, the corresponding link will then be included on the GIGA Working Papers website at <www.giga‐hamburg.de/workingpapers>.
GIGA research unit responsible for this issue:
GIGA Research Programme 3: “Socio‐Economic Challenges in the Context of Globalisation”
Editor of the GIGA Working Papers series: Bert Hoffmann
<workingpapers@giga‐hamburg.de>
Copyright for this issue: © Juliane Brach English copy editor: Meenakshi Preisser
Editorial assistant and production: Silvia Bücke
All GIGA Working Papers are available online and free of charge on the website
<www.giga‐hamburg.de/workingpapers>.
For any requests please contact:
E‐mail: workingpapers@giga‐hamburg.de Phone: ++49 (0)40 ‐ 4 28 25 ‐ 548
The GIGA German Institute of Global and Area Studies cannot be held responsible for errors or any consequences arising from the use of information contained in this Working Paper;
the views and opinions expressed are solely those of the author or authors and do not neces‐
sarily reflect those of the Institute.
GIGA German Institute of Global and Area Studies Leibniz‐Institut für Globale und Regionale Studien Neuer Jungfernstieg 21
20354 Hamburg Germany
E‐mail: info@giga‐hamburg.de Website: www.giga‐hamburg.de
GIGA WP 155/2010
Technological Readiness in the Middle East and North Africa – Implications for Egypt
Abstract
Innovation is widely recognized as a key driver of sustainable economic development. Gov‐
ernments, international organizations, donors and investors are increasingly interested in evaluating the technological capabilities and innovative capacities in developing countries, but often lack appropriate approaches for such measurement. This paper focuses on innova‐
tion and technological progress in the MENA region and discusses the challenges of under‐
standing, expanding and fostering innovative potential in Egypt.
Keywords: Egypt, Middle East, North Africa, Technology, Developing countries
J‐Prof. Dr. Juliane Brach
is assistant research professor at the Department of Economics, University of Copenhagen;
a research fellow at the GIGA Institute of Middle East Studies
Contact: brach@giga‐hamburg.de
Website: http://staff.en.giga‐hamburg.de/brach
Contact: juliane.brach@econ.ku.dk Website: http:/www./econ.ku.dk
Zusammenfassung
Technologische Anpassungsfähigkeit im Nahen Osten und Nordafrika – Auswirkungen auf Ägypten
Innovation wird weithin als eine treibende Kraft von nachhaltiger wirtschaftlicher Entwick‐
lung angesehen. Regierungen, internationale Organisationen, Geber von Entwicklungshilfe und Investoren haben ein zunehmendes Interesse daran, die technologischen Fertigkeiten und die innovative Leistungsfähigkeit von Entwicklungsländern zu beurteilen, häufig mangelt es jedoch an geeigneten Ansätzen für eine solche Untersuchung. Dieses Paper untersucht den Fortschritt in den Bereichen Innovation und Technologie in der MENA‐Region und diskutiert die Herausforderungen, die das Verstehen, Ausweiten und Fördern des innovativen Potenzials in Ägypten darstellen.
Technological Readiness in the Middle East and North Africa – Implications for Egypt*
Juliane Brach
Article Outline 1 Introduction
2 Related Literature: An Overview 3 Methodology and Data
4 Empirical Results 5 Discussion
6 Implications for Egypt 7 Conclusion
1 Introduction
In an international comparison with peer economies, the economy of the Arab Re‐
public of Egypt displays relatively low growth rates. These are coupled with high rates of population growth and a very tight labor market. One of the major challenges in the near future, for Egypt as much as for the other Arab countries in the Middle East and North Africa (MENA), is sustainable job creation (Nabli 2007).
There is ample economic literature on the existing growth deficit and weak eco‐
nomic performance of Arab MENA countries. However, little research has investi‐
gated the constraints on economic development in the Arab MENA countries that
might explain why they perform below their potential. Understanding the most binding constraints to economic development and growth is a prerequisite for identi‐
fying effective structural adjustment measures, both nationally and internationally.
National governments, as well as international organizations, have only limited fi‐
nancial and administrative resources to dedicate to structural adjustment and devel‐
opment support. Rarely, if ever, is it possible to tackle all constraints. Policymakers have to make choices and set priorities to ensure that their efforts and the available resources are directed toward alleviating the most binding constraints.
The central aim of this paper is to take a closer look at the technological progress and innovative activities in the MENA region in order to understand the challenges and limitations of sustainable economic performance and job creation as well as to best possibly support policymakers’ decision‐making processes in this context.
The remainder of the paper is organized as follows: Section 2 provides an over‐
view of the related literatures. Sections 3 and 4 present the methodology and the re‐
sults of the empirical analysis, respectively. Section 5 discusses the more general im‐
plications of the empirical results, while Section 6 concentrates on the implications for the case of Egypt. Section 7 concludes.
2 Related Literature: An Overview
Traditionally, growth theory focused on physical and human capital accumulation as the ultimate sources of growth. Today, economists and policymakers alike recognize innovation as a key driver of economic growth and development (OECD 2009). The body of literature on innovation is vast and covers an extensive variety of subjects.
Drawing on Schumpeter’s seminal contribution from 1950, theoretical advances were made in the 1990s (by Romer, Aghion and Howitt, and by Grossman and Helpman, among others) and were followed by a substantial increase in empirical studies.
These studies center almost exclusively on the analysis of research and development (R&D)‐intensive activities and sectors in OECD countries, where over 90 percent of recent technologies have been developed. Innovation in developing countries has only rarely been an explicit research subject.
Early exceptions are Basu and Weil (1998) and Hausman and Rodrik (2003), who have argued that developing countries face a technology bias and need to appropri‐
ate existing technologies, and that this process of technology adoption is not cost‐free but rather as uncertain as the innovation process in the OECD countries. In general, the bulk of the literature on economic development in developing countries has con‐
centrated on these countries’ access to international technologies through interna‐
tional trade rather than on their innovative and creative capacities (e.g. Sachs and Warner 1999; Dollar and Kraay 2004). More recently, the interest in “incremental” or
Juliane Brach: Technological Readiness in the Middle East and North Africa – Implications for Egypt 7
“inside‐frontier” innovation and technological capacity as important drivers of de‐
velopment in developing countries has been increasing. The need for further theo‐
retical and empirical research in this direction has been underscored and encouraged by leading researchers (e.g. Fagerberg et al. 2009; Freeman and Soete 2009) and re‐
search institutions (e.g. OECD–UNESCO 2009).
Despite the plethora of scholarly articles and international organizations’ publica‐
tions on economic growth in various countries and regions of the world, the contribu‐
tions on economic growth performance in MENA countries remain limited. Important components of the existing literature on MENA growth use the aggregate “MENA region” (Sala‐I‐Martin and Artadi 2003; Aubert 2004; Dasgupta 2003). The definition of the region varies significantly from study to study but generally covers around twenty countries, including Iran, Turkey and Israel. Consequently, these studies yield only very general and generic observations. Only few papers investigate MENA eco‐
nomic growth at a more disaggregated level. Bisat et al. (1997) provide a detailed analysis of the economic growth rates of ten Arab MENA countries based on a growth accounting exercise (for the years 1971–96). They find that the investment process that took place over those years was not accompanied by sufficient im‐
provement in total factor productivity (TFP). In fact, the average annual TFP growth was negative over the whole period. More recently, Abu‐Qarn and Abu‐Bader (2007) have revisited the sources of MENA growth and have attempted to determine the key factors that led to economic growth in MENA countries over the period 1960–98.
They found that MENA growth performance was essentially determined by physical capital accumulation and, to a lesser extent, by the accumulation of human capital.
The contribution of TFP to economic growth was negligible; all six Arab MENA countries exhibit negative TFP growth. Nabli and Véganzonès‐Varoudakis (2007) address the empirical link between economic reform, human capital, and physical infrastructure and MENA economic growth. They find a strong positive impact from advances in physical infrastructure and human capital, and a negative impact from structural reform on growth in six MENA countries over the period from 1970 to 1999. A very recent study also points to a severe lack of technological capacities and innovative activities in the MENA region and shows that region‐specific features such as rent‐ and continuity‐oriented political economy structures are simultane‐
ously important determinants and hampering factors to economic development in the MENA region that can partially explain an economically inefficient allocation of resources (Brach 2009).
3 Methodology and Data
Equation (1) yields the extended core specification and baseline models in subse‐
quent OLS and panel data regression analysis.
ECDEVi = β1 + β2 EconInsti + β3 Techreadi + β4 Opennessi + + β5 Marketsizei + β6 Oildependencei + β7 Conflicti +
+ β8 Geographyi + β9 Regioni + β10 MENA*Technology + ε (1)
β1 is the intercept and ε the random error term. Throughout the paper I will be inter‐
ested in the sign, magnitude, and significance of the coefficients. The interaction terms allow me to explore and control for the special impact of these variables in MENA countries.
The dependent variable “economic development” (ECDEV) of country i, is writ‐
ten on the right‐hand side of the equation and is measured as the logarithm of per capita GDP. The independent variables that are presented on the left‐hand side of the equation can be sorted into four groups:
1) science and technology indicators (STI) (including human capital), 2) macroeconomic indicators,
3) political economy indicators, 4) context and control variables.
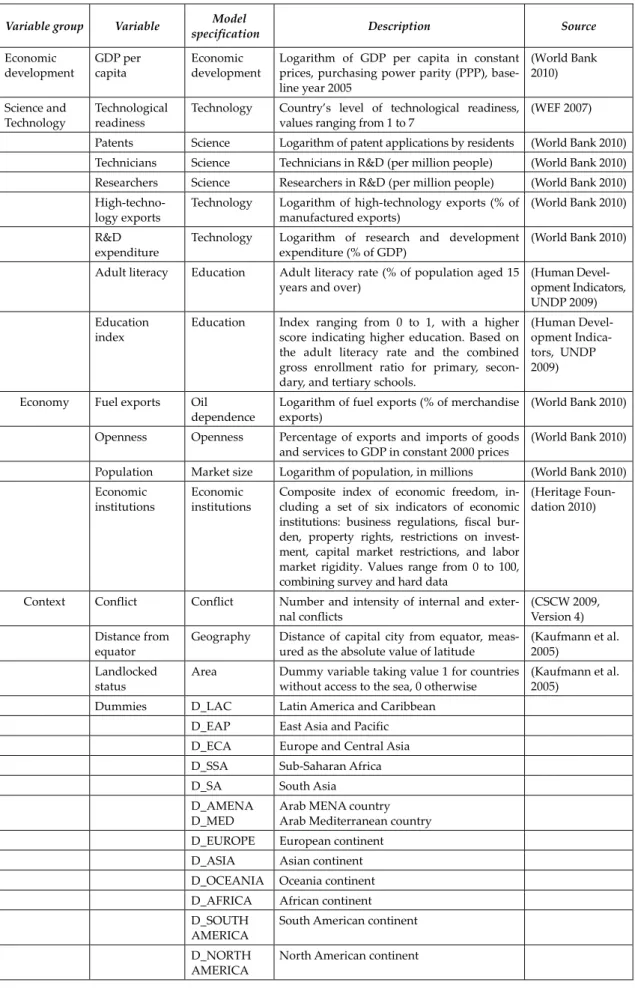
Table 1 provides a list of the variables and data sources. A more detailed description and motivation of variables and indicators is provided by Brach (2009).
In total, data have been collected for 189 countries for which the variables and their sources are described in the attached table.
The biggest obstacle throughout the sample remains the availability of data from the Arab Middle Eastern and North African (AMENA) countries as well as ready and applicable data including S&T indicators across all countries, which are documented in Table A.1 in the appendix.
Juliane Brach: Technological Readiness in the Middle East and North Africa – Implications for Egypt 9
Table 1: Variables and Sources
Variable group Variable Model
specification Description Source
Economic development
GDP per capita
Economic development
Logarithm of GDP per capita in constant prices, purchasing power parity (PPP), base‐
line year 2005
(World Bank 2010)
Science and Technology
Technological readiness
Technology Country’s level of technological readiness, values ranging from 1 to 7
(WEF 2007)
Patents Science Logarithm of patent applications by residents (World Bank 2010) Technicians Science Technicians in R&D (per million people) (World Bank 2010) Researchers Science Researchers in R&D (per million people) (World Bank 2010)
High‐techno‐
logy exports
Technology Logarithm of high‐technology exports (% of manufactured exports)
(World Bank 2010)
R&D
expenditure
Technology Logarithm of research and development expenditure (% of GDP)
(World Bank 2010)
Adult literacy Education Adult literacy rate (% of population aged 15 years and over)
(Human Devel‐
opment Indicators, UNDP 2009) Education
index
Education Index ranging from 0 to 1, with a higher score indicating higher education. Based on the adult literacy rate and the combined gross enrollment ratio for primary, secon‐
dary, and tertiary schools.
(Human Devel‐
opment Indica‐
tors, UNDP 2009)
Economy Fuel exports Oil dependence
Logarithm of fuel exports (% of merchandise exports)
(World Bank 2010)
Openness Openness Percentage of exports and imports of goods and services to GDP in constant 2000 prices
(World Bank 2010)
Population Market size Logarithm of population, in millions (World Bank 2010)
Economic
institutions
Economic institutions
Composite index of economic freedom, in‐
cluding a set of six indicators of economic institutions: business regulations, fiscal bur‐
den, property rights, restrictions on invest‐
ment, capital market restrictions, and labor market rigidity. Values range from 0 to 100, combining survey and hard data
(Heritage Foun‐
dation 2010)
Context Conflict Conflict Number and intensity of internal and exter‐
nal conflicts
(CSCW 2009, Version 4) Distance from
equator
Geography Distance of capital city from equator, meas‐
ured as the absolute value of latitude
(Kaufmann et al.
2005) Landlocked
status
Area Dummy variable taking value 1 for countries without access to the sea, 0 otherwise
(Kaufmann et al.
2005)
Dummies D_LAC Latin America and Caribbean
D_EAP East Asia and Pacific
D_ECA Europe and Central Asia
D_SSA Sub‐Saharan Africa
D_SA South Asia
D_AMENA
D_MED
Arab MENA country Arab Mediterranean country
D_EUROPE European continent
D_ASIA Asian continent
D_OCEANIA Oceania continent
D_AFRICA African continent
D_SOUTH
AMERICA
South American continent
D_NORTH
AMERICA
North American continent
Source: Author’s compilation
The data used originate from a wide range of different sources of internationally recognized data and are as follows: The World Bank’s World Development Indicators comprise the backbone of the performed analysis, including reliable and comprehen‐
sive data for the AMENA region. Nevertheless, data relating to S&T indicators, such as patents, R&D expenditure and employed technicians and researchers for the AMENA countries are severely lacking in the WDI database. As a result, the World Economic Forum’s Global Competitiveness Index is also included as a measure of technology in the performed analysis. The data are based on an executive opinion survey (Global Opinion Survey, GOS) of over 10,000 enterprises worldwide, one of the few sources that allow for cross‐country comparison.
The data for ”economic institutions” are taken from the Heritage Foundation’s In‐
dex of Economic Freedom and are based on a non‐weighted average of the measures of business, fiscal, investment, financial, and labor freedoms, along with property rights.
The Centre for the Study of Civil War (CSCW) of the Peace Research Institute in Oslo provides data on armed conflicts. The conflict measure in the current sample is based on CSCW’s Armed Conflicts Version 4‐2009 and measures the cumulative amount of armed conflict since 1970. Incidents are measured by intensity with inci‐
dents resulting in between 25 and 999 battle‐related deaths in a given year catego‐
rized as “minor” and given the value 1, and incidents with at least 1,000 battle‐
related deaths in a given year considered “war” and given the value 2.
Finally, literacy rate and education index data are provided by the United Na‐
tions Development Programs Human Development Indicators, and geographical data of each country are based on the findings of Kaufmann et al. (2005).
The sample covers 77 countries and unless reported otherwise, all data are taken from the year 2005. The base year for constant U.S. dollar prices in PPP is 2000. The quantitative data analysis is based on cross‐country regressions. As a result of con‐
straints on data availability, only 5 out of a total of 19 AMENA countries are being included in the 2005 regression analysis.
Table 2 summarizes the descriptive statistics for the key variables of interest.
Table 2: Descriptive Statistics
Mean Std. Deviation N
LGGDP 3.9000 0.44946 77
ECONINST 65.6802 9.28532 77
TECHREAD 4.065 1.1905 77
OPENNESS 87.868 43.5229 77
MARKET 48.2295 153.39450 77
FUELEX 15.55 24.524 77
LGCONFL 0.5849 0.71410 77
DISTEQ 32.81 17.515 77
Source: Author’s calculations
Juliane Brach: Technological Readiness in the Middle East and North Africa – Implications for Egypt 11
A combination of exploratory data analysis (EDA) and more rigorous testing was performed separately for each variable and bivariate relationship prior to the multi‐
variate analysis.
4 Empirical Results
All but one explanatory variable show the expected signs consistently throughout the different models.
Technological readiness has a highly significant, positive impact and a large eco‐
nomic importance. The coefficients suggest that two‐thirds of the variation in economic development can actually be explained by a country’s technological readiness. Even after the inclusion of all dummy variables, the importance remains above 50 percent.
Table 3: OLS 77 Countries—Economic Development (lgGDPPC)
Economic Development (lgGDPPC)
1 2 3 4 5 6 7 8
ECONINST 0.23*** 0.21** 0.26*** 0.19* 0.05 0.01 ‐0.03 ‐0.04 (2.62) (2.23) (2.65) (1.91) (0.58) (0.11) (‐0.30) (‐0.52) TECHREAD 0.65*** 0.65*** 0.63*** 0.65*** 0.62*** 0.63*** 0.67*** 0.53***
(7.37) (7.24) (7.12) (7.53) (8.50) (8.65) (8.96) (6.57)
OPENNESS 0.08 0.10 0.06 0.03 0.03 0.02 0.02
(1.17) (1.43) (0.87) (0.43) (0.46) (0.42) (0.30) MARKET 0.03 0.05 0.07 ‐0.01 ‐0.02 ‐0.02 ‐0.01 (0.42) (0.65) (0.97) (‐0.12) (‐0.32) (‐0.35) (‐0.24)
OILDEP 0.12* 0.10*’ 0.06 0.06 0.02 0.00
(1.79) (1.52) (0.98) (1.05) (0.30) (‐0.03)
LGCONFL ‐0.17** ‐0.04 ‐0.03 ‐0.06 ‐0.09
(‐2.32) (‐0.59) (‐0.46) (‐0.96) (‐1.41)
DISTEQ 0.38*** 0.40*** 0.39*** 0.24**
(5.56) (5.75) (5.63) (2.26)
MED ‐0.08 0.43*’ 0.39*’
(‐1.34) (1.51) (1.50)
MED*TECH ‐0.52* ‐0.46*
(‐1.81) (‐1.72)
Regional no no no no no no no yes
Dummies
Adjusted R2 0.67 0.67 0.67 0.70 0.78 0.79 0.80 0.84
N 77 77 77 77 77 77 77 77
Note: ***, **, and * denote a significance at the 1, 5, and 10 percent level, respectively.
Source: Author’s calculations
When first introduced in Model 6, the dummy for Arab Mediterranean countries (MED) displays a negative sign, but is positive thereafter. The explanation is rea‐
sonably straightforward: Model 6 points out that the generally positive impact of
economic institutions, technological readiness, and the control variables might not hold true when analyzing economic development in AMCs when compared to other regions of the world, without being able to explain why. Models 7 and 8 are able to specify this finding: the negative impact of the MED dummy on economic develop‐
ment stems from the negative impact of lacking technological readiness. While the MED dummy now has a positive sign, the interaction term of technological readiness and MED (TECH*MED) has a negative sign, and both significant economic and sig‐
nificant statistical relevance (‐0.52** and ‐0.46**, in columns 7 and 8, respectively).
In contrast, the impact of economic institutions (ECONINST) changes from posi‐
tive (columns 1‐6) to negative (columns 7 and 8). These institutions also lose signifi‐
cance and magnitude with the successive inclusion of more variables. This may be puzzling at first, but it supports the hypothesis that economic institutions matter and that they are endogenously dependent on several determinants, the impact of which can be either in support of or an obstacle to economic development. This initial in‐
dicative finding needs further investigation and interpretation, which will be pro‐
vided in the next section.
With respect to identifying the most binding constraints to the economic devel‐
opment of the AMCs, the magnitude of the coefficients yields a sense of the potential impact. Model 8, which includes both the regional dummies and the interaction term, is a specification with a solid explanatory power of 84 percent (adjusted R2) and re‐
veals that technological readiness and distance from the equator in general have re‐
spectively a 53 percent and 24 percent return on economic development. Both find‐
ings are in line with the importance of these two variables, as noted in the theoretical section. With respect to the AMCs, the positive impact of technological readiness almost diminishes. Adding the interaction term to the TECHREAD coefficient gives the more precise estimate of as little as 0.07, or 7 percent.
5 Discussion
The empirical results provide strong evidence that one of the major constraints to an improved economic performance and sustainable job creation is the general lack of MENA countries’ technological capacities. Since innovation in these countries is closely linked to the adoption, refinement, and modification of existing technologies (also dubbed “inside‐frontier” or “diffusion‐based” innovation), innovation and productivity are negatively impacted by the low level of technological readiness.
These results have three important implications for both policymakers and research‐
ers, as I will discuss below.
First, developing countries such as MENA countries that are not, or only to a very low extent, capable of using and appropriating existing technologies efficiently, are
Juliane Brach: Technological Readiness in the Middle East and North Africa – Implications for Egypt 13
not able to fully internalize the positive effects of technology transfer and technology spill‐over effects that relate to international trade and trade openness. Trade liberali‐
zation is thus not very likely to have a “natural” positive effect. Rather, there has to be an explicit focus on the transfer of both technology and knowledge in order to ensure and facilitate a positive impact.
Second, although there is now strong evidence for the fact that technological readiness is a major constraint, the reason for this remains only speculated upon.
What exactly makes MENA economies less productive than economies in other re‐
gions? Brach (2009) provides some fresh insights into economic institutions, yet there is still no explanation that is based on the ultimate unit of productivity and competi‐
tiveness: the firm.
Third, more research is needed in order for us to be able to understand the tech‐
nological and innovative capacities at the level of the firm. This would require 1) the availability of relevant, recent, and reliable firm‐level data and 2) new indicators and approaches to complement standard (OECD‐inspired) innovation surveys.
Economic performance will only gain momentum if it is possible to close the productivity and technology gap between the AMENA countries and the rest of the world, which will continue to widen unless urgent measures are taken. Thus, more research and political effort need to be directed towards not only understanding and fostering technology diffusion within and into these countries but also conducting in‐depth investigations of their technological capacities.
6 Implications for Egypt
Egypt is at a crossroads of economic development. Despite an overall favorable set‐
ting, such as a relatively high degree of economic diversification, good educational attainment and human capital, a large domestic market and a relatively low degree of social inequality, it faces a high burden of subsidies, and large‐scale unemployment, especially among the youth and increasingly also among university graduates. The informal sector of the economy is already considerably large and is constantly grow‐
ing. Innovation and improvisation are taking place on a daily basis in various indus‐
tries. Egypt has a lot to offer, and there does not seem to be a general lack of entrepre‐
neurial competence, talent, or innovative capacity. However, Egypt seems to be unable to systematically transform innovative activities into knowledge and products, and that inability is hampering its productivity and economic performance.
Egypt is an economic hub in the region, especially for intra‐regional trade and factor movements, not only because of its large domestic market, but also because of its status as a political actor and benchmark. However, in terms of technological and innovative capacities, Egypt does not rank among the top performers. MENA coun‐
tries face very different stages with respect to access to and mastering of recent tech‐
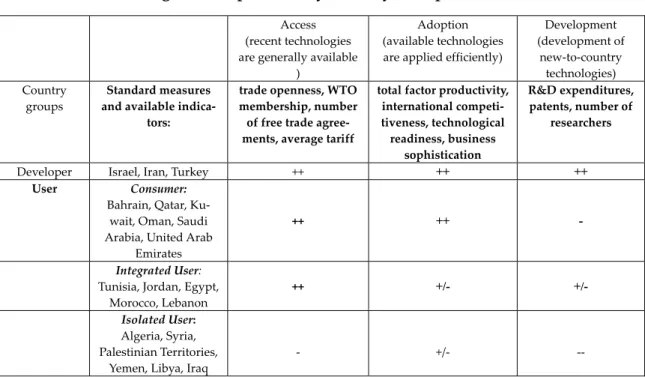
nologies and can be broadly categorized – as the following table shows – into two groups: technology developer and technology user. Within the group of technology users, we identify three sub‐groups of countries: technology consumers, integrated tech‐
nology users, and isolated technology users. Out of the 20 countries in the MENA region, only the three non‐Arab countries are classified as technology developers.
Table 4: Technological Competences by Country Groups
Author‘s own compilation
Technology developers are technologically well advanced and are characterized by excellent access to, and mastering and development of, new technologies through both research and technology adoption. Countries within this group in the MENA region are Israel, Turkey and, to some degree, Iran. All three have invested early and systematically into education and the development of national innovative, science, and research capacities. They also profit from well‐educated nationals returning to their home country. All other countries in the region generally depend on foreign technologies, because they do not – or, if they do, then only to a very limited extent – develop or improve technologies according to their needs. Among the technology users, the technology consumers are highly integrated into the global market and thus have access to international, state‐of‐the‐art technologies. In contrast to the users, especially the more advanced users like those in Tunisia or Jordan, Gulf countries do not possess the necessary skills, but they do have the funds to equip themselves with both the technologies and the experts to manage them. The integrated technology users have (through systematic trade opening) improved their access to international tech‐
Access
(recent technologies are generally available
)
Adoption (available technologies are applied efficiently)
Development (development of
new‐to‐country technologies) Country
groups
Standard measures and available indica‐
tors:
trade openness, WTO membership, number of free trade agree‐
ments, average tariff
total factor productivity, international competi‐
tiveness, technological readiness, business
sophistication
R&D expenditures, patents, number of
researchers
Developer Israel, Iran, Turkey ++ ++ ++
User Consumer:
Bahrain, Qatar, Ku‐
wait, Oman, Saudi Arabia, United Arab
Emirates
++ ++ -
Integrated User:
Tunisia, Jordan, Egypt, Morocco, Lebanon
++ +/- +/-
Isolated User:
Algeria, Syria, Palestinian Territories,
Yemen, Libya, Iraq
‐
+/‐
‐‐
Juliane Brach: Technological Readiness in the Middle East and North Africa – Implications for Egypt 15
nologies; however, neither the more advanced users like those in Tunisia and Jordan nor users in Egypt and Morocco have in the past ten years experienced the significant productivity improvement that was anticipated. This anticipation was based on analogies to other developing regions, but, as recent studies show, many MENA countries lack the necessary capacities to exploit the new (technological) opportuni‐
ties to which they have now access (Brach 2009). Finally, the isolated technology users face the most difficult situation. Their integration into the world market is fairly re‐
cent and rather selective (Syria, Algeria, and especially Libya), or has been delayed or harmed because of ongoing war and conflict (Iraq and the Palestinian territories).
Countries in this group lack capacities, funds, and most of the basic infrastructure.
Egypt is an integrated technology user and displays only a limited ability to suffi‐
ciently use and apply existing technologies to spur sustainable economic develop‐
ment, as is depicted in Graph 1. The access to recent technologies is still the necessary condition to economic growth, but it is not sufficient if the capacities to use, refine, and apply these technologies are limited and not well established.
Graph 1: Economic Performance and Technological Capacities
ALG
EGY JOR MOR
OMA
TUN
33.544.5log per-capita gdp
2 3 4 5 6 7
level of technological readiness
Source: Own calculations based on World Bank 2008 and World Economic Forum 2008
The relatively low impact of the current economic crisis on Egypt gives its govern‐
ment room to maneuver and the opportunity to adjust to and develop sustainable and innovation‐based sources of growth (Brach and Loewe 2009). Understanding innovative activities and the potential of firms and industries is the crucial link here to an improved economic performance. As mentioned in Section 5, the availability of suitable tools such as appropriate models and data is also of high importance.
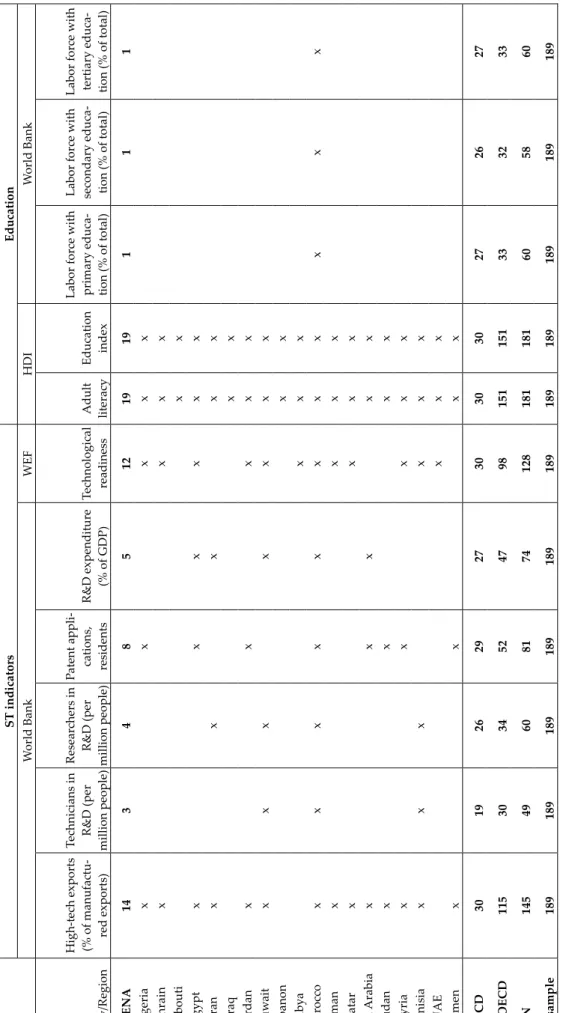
The MENA region in general is, in comparison to the rest of the world’s regions, the one whose data are most incomprehensive and most difficult to access. An over‐
view of the availability of science, technology, and innovation (STI), as well as educa‐
tion indicators, is provided in Table 1 in the appendix. These data constraints lead to a lack of international economic research on the MENA region, which as a conse‐
quence yields only very little relevant scientific output.
Egypt is no exception here. For example, there is no representative innovation survey that is conducted at regular intervals. There is also a considerable time lag, sometimes several years, before data are published. In general, the access to (firm‐
level) data is very restricted. Rules and registration procedures are very non‐
transparent. Requests, if at all successful, can be subject to delays of several months.
In turn, the lack of data limits the understanding and insight of national authorities and policymakers in key questions such as
— What are the determinants of technology‐upgrading in Egypt? and
— How do we make use of standard economic modeling of the innovation process in order to improve the empirically observed process of technology adoption?
Policymakers should consider the comprehension of innovation at a firm level across economic industries a high priority because this is where a large number of sustain‐
able jobs will be created in the future. Complementing standard innovation surveys, a suitable approach will, however, explicitly focus on both research‐based and diffu‐
sion‐based innovation and cover a variety of different aspects relevant for techno‐
logical competences and upgrading possibilities at the firm level, such as
— the stock of technologies (e.g. the type, age, or cost of current production tech‐
nologies and machinery),
— the development of technologies that are new to the world, e.g. the number of patents and amount of expenditure for R&D and other standard indicators that are implemented in OECD and/or UN S&T surveys,
— the channels of technology transfer that specify how technologies that are not developed in the firm have been acquired (e.g. arms’ length trade, value chain in‐
tegration, or labor migration),
— the adoption of technologies, i.e. activities that are related to the development of technologies that are new to the firm and/or to the country and that are based on the adoption and modification of pre‐existing technologies rather than original R&D, and
— the diffusion of technologies that have been developed or modified within and across industries at the country level.
Juliane Brach: Technological Readiness in the Middle East and North Africa – Implications for Egypt 17
7 Conclusion
Economic research on technological progress and growth has in the past two decades very much focused on innovations in high‐technology sectors. Economic modeling and empirical analyses have centered on the question of how to spur innovation in an OECD context. Therefore, policymakers and researchers are able today to draw on an established research setup, (standard) science and technology indicators that sup‐
port informed decisions.
However, domestic high‐technology industries and sectors are virtually nonexis‐
tent in the context of developing countries. Despite the sharp increase in demand for policymakers in developing countries to create sound innovation and productivity‐
enhancing policies, the available toolkit is still only partially available to them.
Necessary economic growth, accelerated economic development, and sustainable job creation crucially depend on the performance of, and the sound cooperation be‐
tween, three very country‐specific features: firms, government(s), and (economic) institutions. Therefore, panacea or “one‐size‐fits‐all” approaches are not suitable. As in the case of Egypt, national and international structural adjustment programs over the past two decades have shown only limited results. What is urgently needed are innovation and diffusion‐based development strategies that are tailored specifically to the country.
Bibliography
Abu‐Qarn, A. S., and S. Abu‐Bader (2007), Sources of Growth revisited: Evidence from Selected MENA Countries, in: World Development, 35, 5, 752‐771.
Aubert, J. E. (2004), The Challenge: Changing the Growth Model, in: Aubert, J. E., and J.‐L. Reiffers (eds.), Knowledge Economies in the Middle East and North Africa: To‐
wards New Development Strategies, Washington D. C., 5‐9.
Basu, S., and D. N. Weil (1998), Appropriate Technology and Growth, in: Quarterly Journal of Economics, 113, 4, 1025‐1054.
Bisat, A., M. El‐Erian, and T. Helbling (1997),Growth, Investment, and Saving in the Arab Economies, in: IMF Working Papers, 85.
Brach, J. (2009), Technology, Political Economy, and Economic Development in the Middle East and North Africa, in: Review of Middle East Economics and Finance, 5, 1, 1‐23.
Brach, J., and M. Loewe (2010), The Global Financial Crisis and the Arab World: Im‐
pact, Reactions and Consequences, in: Mediterranean Politics, 15, 1, 45‐73.
Center for the Study of Civil War (CSCW) (2005), Dataset on Armed Conflict, <www.
prio.no/cscw/datasets>.
Dasgupta, D. (2003), Shifting to new Sources of Growth, in: Dasgupta, D., and M. K. Nabli, Trade, Investment, and Development in the Middle East and North Africa:
Engaging with the World, Washington D. C., 19‐25.
Dollar, D., and A. Kraay (2004), Trade, Growth, and Poverty, in: The Economic Journal, 114, 493, 22‐49.
Fagerberg, J., Srholec, M., and Verspagen, B. (2010), Innovation and Economic Devel‐
opment, in: Hall, B., and N. Rosenberg, Handbook of the Economics of Innovation, North Holland: Elsevier, 2010, 833‐872.
Freeman, C., and L. Soete (2009), Developing Science, Technology and Innovation Indicators: What We Can Learn From the Past, Research Policy, 2009, 38, 4, 583‐589.
Hausmann, R., and D. Rodrik (2003), Economic Development as a self‐discovery, in:
Journal of Development Economics, 72, 2, 603‐633.
Heritage Foundation (2007), Economic Freedom, Washington D. C.
Kaufmann, D., A. Kraay, and M. Mastruzzi (2005), Governance Matters IV: Govern‐
ance Indicators for 1994‐2004, in: World Bank Policy Research Working Paper, 3630, associated online data set: <www.worldbank.org/wbi/governance/govdata/>.
Juliane Brach: Technological Readiness in the Middle East and North Africa – Implications for Egypt 19
Nabli, M.K. (ed.) (2007), Breaking the Barriers to Higher Economic Growth: Better Govern‐
ance and Deeper Reforms in Middle East and North Africa, The World Bank: Washing‐
ton D.C.
Nabli, M. K., and M.‐A. Véganzonès‐Varoundakis (2007), Reform Complementarities and Economic Growth in the Middle East and North Africa, in: Journal of Interna‐
tional Development, 19, 1, 17‐54.
OECD (2009), Innovation for Development: Converting Knowledge to Value. OECD—
UNESCO International Workshop Summary Report, Paris.
Sachs, J., and A. Warner (1999), The big Push, Natural Resource Booms and Growth, in: Journal of Development Economics, 59, 43‐76.
Sala‐I‐Martin, X., and E. V. Artadi (2003), Economic Growth and Investment in the Arab World, in: World Economic Forum (eds.), The Arab World Competitiveness Re‐
port, Oxford, 22‐33.
Summers, R., A. Heston, and B. Aten (2006), Penn World Table Version 6.2, Centre for International Comparisons of Production, Income and Prices at the University of Pennsylvania, data set: <http://pwt.econ.upenn.edu/php_site/pwt_index.php>
(February, 2, 2008).
World Bank (2007), Economic growth in the 1990s: Learning from a Decade of Reform, Washington D.C.
World Bank (2010), World Development Indicators, Washington D.C.
World Economic Forum (2010), Global Competitiveness Report, Davos.
Table A.1: STI & Education Data Availability ST indicators Education World Bank WEF HDI World Bank Country/Region High‐tech exports (% of manufactu‐ red exports) Technicians in R&D (per million people) Researchers in R&D (per million people) Patent appli‐ cations, residents R&D expenditure (% of GDP) Technological readiness Adult literacyEducation index Labor force with primary educa‐ tion (% of total) Labor force with secondary educa‐ tion (% of total)
Labor forc tertiary educa tion (% of AMENA 14 3 4 8 5 12 19 19 1 1 1 Algeria x x x x x Bahrain x x x x Djibouti x x Egypt x x x x x x Iran x x x x x Iraq x x Jordan x x x x x Kuwait x x x x x x x Lebanon x x Libya x x x Morocco x x x x x x x x x x x Oman x x x x Qatar x x x x Saudi Arabia x x x x x Sudan x x x x Syria x x x x x Tunisia x x x x x x UAE x x x Yemen x x x x OECD 30 19 26 29 27 30 30 30 27 26 27 Non‐OECD 115 30 34 52 47 98 151 151 33 32 33 N 145 49 60 81 74 128 181 181 60 58 60 Total sample 189 189 189 189 189 189 189 189 189 189 189 Source: Author’s own compilation, World Bank (2010), World Economic Forum (2010).