www.giga-hamburg.de/workingpapers
___________________________
Constraints to Economic Development and Growth in the Middle East and North Africa
Juliane Brach
N° 85 September 2008
GIGA Working Papers
Edited by the
GIGA German Institute of Global and Area Studies / Leibniz-Institut für Globale und Regionale Studien.
The Working Paper Series serves to disseminate the research results of work in progress prior to publication in order to encourage the exchange of ideas and academic debate. An objective of the series is to get the findings out quickly, even if the presentations are less than fully polished. Inclusion of a paper in the Working Paper Series does not constitute publication and should not limit publication in any other venue. Copyright remains with the authors. When Working Papers are eventually accepted by or published in a journal or book, the correct citation reference and, if possible, the corresponding link will then be included in the Working Papers website at <www.giga-hamburg.de/workingpapers>.
GIGA research unit responsible for this issue: Institute of Middle East Studies Editor of the GIGA Working Paper Series: Martin Beck <beck@giga-hamburg.de>
Copyright for this issue: © Juliane Brach English copy editor: Melissa Nelson
Editorial assistant and production: Vera Rathje
All GIGA Working Papers are available online and free of charge on the website <www.
giga-hamburg.de/workingpapers>. Working Papers can also be ordered in print. For pro- duction and mailing a cover fee of € 5 is charged. For orders or any requests please contact:
E-mail: workingpapers@giga-hamburg.de Phone: ++49 (0)40 - 428 25 548
The GIGA German Institute of Global and Area Studies cannot be held responsible for errors or any consequences arising from the use of information contained in this Working Paper; the views and opinions expressed are solely those of the author or authors and do not necessarily reflect those of the Institute.
GIGA German Institute of Global and Area Studies / Leibniz-Institut für Globale und Regionale Studien Neuer Jungfernstieg 21
20354 Hamburg Germany
E-mail: info@giga-hamburg.de Website: www.giga-hamburg.de
Constraints to Economic Development and Growth in the Middle East and North Africa
Abstract
When comparing the speed and extent of economic development in different geographic regions of the world over the past 20 years, the under-average performance of Arab coun- tries in general and Arab Mediterranean countries in particular is striking. This is despite an overall favorable geo-strategic situation at the crossroads of three continents, with ex- cellent connections to sea and waterways and in direct proximity to the European Union, one of the world’s economic hubs. It is also despite the minor importance of negative fac- tors such as a high-burden diseases or high levels of ethnic fractionalization.
In this paper, I focus on identifying the most important constraints on Arab Mediterranean economic development. I use state-of-the-art econometric tools to quantify constraints that have been identified through economic theory and studies of the political economy charac- teristics of the region. The empirical results offer support for the central hypothesis that limited technological capacities and political economy structures are the primary con- straints on economic development. With a view to international structural adjustment ef- forts, my findings imply that the limited success of the Euro-Mediterranean policy to stimulate the economic development of the Arab Mediterranean countries might be be- cause structural adjustment efforts do not tackle—or at least do not sufficiently tackle—
these constraints.
Keywords: economic development, quantitative analysis, political economy, Arab countries
JEL Codes: F50, O10, O53, C30
Dr. Juliane Brach
is an economist and a research fellow at the GIGA Institute of Middle East Studies.
Contact: brach@giga-hamburg.de
Website: http://staff.giga-hamburg.de/brach
Hemmnisse wirtschaftlicher Entwicklung im Nahen Osten und in Nordafrika
Vergleicht man Geschwindigkeit und Umfang der wirtschaftlichen Entwicklung der ver- schiedenen Weltregionen in den vergangenen zwanzig Jahren, so fällt insbesondere das unterdurchschnittliche Abschneiden der arabischen Länder im Allgemeinen und der ara- bischen Mittlemeerländer im Besonderen ins Auge, und dies trotz einer insgesamt vorteil- haften geographischen Lage im Schnittpunkt dreier Kontinente mit exzellenten An- schlussmöglichkeiten an See- und Wasserwege, trotz der direkten Nachbarschaft zum Weltwirtschaftsdrehkreuz Europäische Union und trotz der relativ geringen Bedeutung wichtiger entwicklungshemmender Faktoren, beispielsweise ethnische Zersplitterung o- der massive Ausbreitung von Krankheiten wie AIDS oder Malaria.
In diesem Aufsatz wird versucht, von den unterschiedlichen Hemmfaktoren wirtschaftli- cher Entwicklung, die in der wirtschaftstheoretischen Literatur und/oder in MENA- Regionalstudien diskutiert werden, diejenigen herauszuarbeiten, die wirtschaftliche Ent- wicklung am stärksten behindern oder möglicherweise stärker als andere. Dabei benutze ich modernste ökonometrische Verfahren, um den Einfluss der verschiedenen erklärenden Variablen zu quantifizieren. Die Ergebnisse stützen die Eingangshypothese, dass insbe- sondere mangelnde technologische Kapazitäten und Fähigkeiten sowie regionalspezifi- sche politökonomische Strukturen die wirtschaftliche Entwicklung in den arabischen Mit- telmeerländern behindern.
Juliane Brach
Article Outline 1 Introduction 2 Related Literature 3 Methodology 4 Empirical Results 5 Conclusion
1 Introduction
During the past 20 years, the Arab countries of the Middle East and North Africa have dis- played weak overall economic performance and have been less economically attractive in comparison to other developing regions.
Despite the plethora of scholarly articles and publications by international organizations on economic development and growth, the contributions on the economic performance of the Middle East and North Africa (MENA) in general and the Arab MENA (AMENA) countries in particular remain limited. Much of the literature uses the aggregate “MENA region,”
which comprises both Arab and non-Arab economies, such as the EU member and candi- date countries Malta and Turkey and the highly developed countries Israel and Iran (Sala-I- Martin/Artadi 2003; Aubert 2004). This article concentrates on the Arab countries of the Middle East and North Africa (AMENA) and further differentiates between Arab Mediter- ranean countries (AMCs) and Arab Gulf countries. The final sample comprises 77 countries, including the five AMCs: Algeria, Egypt, Jordan, Morocco, and Tunisia.1
1 I collected data for a total of 173 countries. A detailed list of countries is provided in annex A.1.
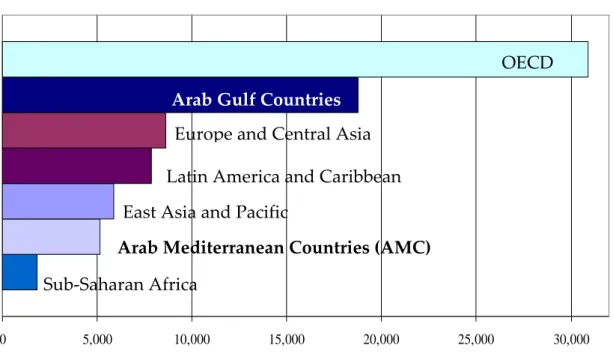
Figure 1 shows the per capita income of AMENA countries in an international comparison and indicates a huge income gap between AMCs and Arab Gulf states that is hidden in the MENA aggregate. The countries of the Gulf Council (GCC) have the second-highest per capita income in the world, topped only by the high-income OECD countries. In contrast, Arab Mediterranean countries have the second-lowest per capita income; only sub-Saharan Africa performs worse.
Figure 1: GDP per Capita (PPP, USD)
0 5,000 10,000 15,000 20,000 25,000 30,000
OECD Arab Gulf Countries
Europe and Central Asia Latin America and Caribbean East Asia and Pacific
Arab Mediterranean Countries (AMC) Sub-Saharan Africa
Source: Brach 2007, calculations are based on WDI 2007
In a regional comparison, AMENA countries show relatively low rates of economic growth, coupled with high rates of population growth, as depicted in Figure 2. Tight labor markets in the region face major challenges because average population growth between 2000 and 2010 is estimated to be more than double that in all other regions (Dasgupta 2003).
Figure 2: GDP Growth by Regions
0.0 1.0 2.0 3.0 4.0 5.0 6.0 7.0 8.0 9.0
East Asia and Pacific
Europe and Central Asia
OECD Latin America Caribbean
MENA Sub-Saharan Africa
AMC GCC
GDP per capita growth (annual %) Population growth (annual %)
0.0 1.0 2.0 3.0 4.0 5.0 6.0 7.0 8.0 9.0
East Asia and Pacific
Europe and Central Asia
OECD Latin America Caribbean
MENA Sub-Saharan Africa
AMC GCC
GDP per capita growth (annual %) Population growth (annual %)
Source: Brach 2007, calculations are based on WDI 2007.
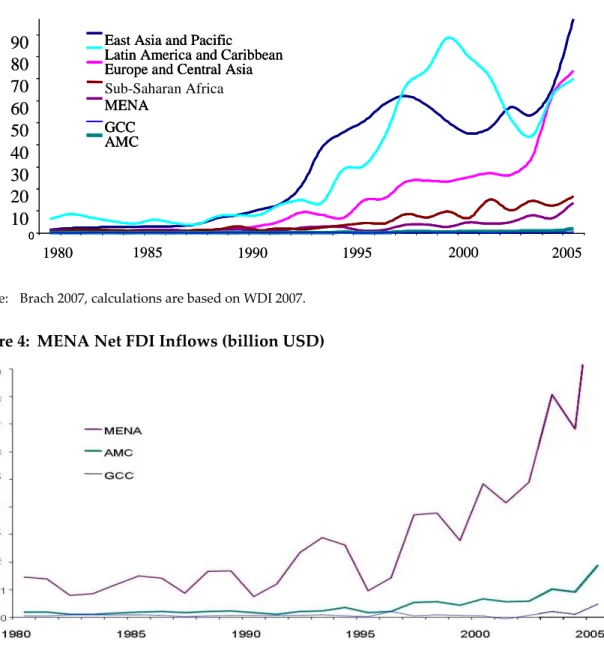
Figures 3 and 4 depict the low attractiveness of AMENA countries in a regional comparison:
These countries profit the least from net inflows of foreign direct investment (FDI). Less than 5 percent of worldwide FDI is directed toward this region. Despite a gradual increase in net FDI inflows, the level is significantly below other developing regions. Even sub-Saharan Af- rica performs better. As for the GCC countries, it must be noted that they are massively ex- porting FDI. This is, however, not true for AMCs.
Figure 3: FDI Net Inflows by Regions (billion USD)
0
10 20 30 40 50 60 70 80 90
1980 1985 1990 1995 2005
East Asia and Pacific Europe and Central Asia Latin America and Caribbean
MENA
Sub-Saharan Africa
AMC GCC
2000
0
10 20 30 40 50 60 70 80 90
1980 1985 1990 1995 2005
East Asia and Pacific Europe and Central Asia Latin America and Caribbean
MENA
Sub-Saharan Africa
AMC GCC
2000
0
10 20 30 40 50 60 70 80 90
1980 1985 1990 1995 2005
East Asia and Pacific East Asia and Pacific Europe and Central Asia Europe and Central Asia Latin America and Caribbean Latin America and Caribbean
MENA MENA
Sub-Saharan Africa Sub-Saharan Africa
AMC AMC GCC GCC
2000
Source: Brach 2007, calculations are based on WDI 2007.
Figure 4: MENA Net FDI Inflows (billion USD)
Source: Brach 2007, calculations are based on WDI 2007.
The oil-dependent Gulf monarchies are an important example of countries in which the high income level is not an adequate gauge of technological progress and sustainable intensive growth. Despite the large discrepancy in per capita income in Arab Mediterranean and Arab Gulf countries, all Arab countries face similar problems, though at different levels of urgency.
There is ample economic literature which recognizes the existing growth deficit and weak economic performance of MENA countries. However, little research investigates the con- straints on economic development in the AMENA countries that might explain why they perform below their potential. Understanding the most binding constraints to economic de- velopment and growth is a prerequisite for identifying effective structural adjustment measures, both nationally and internationally. National governments, as well as interna- tional organizations, have only limited financial and administrative resources dedicated to structural adjustment and development support. And rarely, if ever, is it possible to tackle all possible constraints. Policy makers have to make choices and set priorities to ensure that efforts and available resources are directed toward alleviating the most binding constraints.
This paper aims to partially fill this void. Two-stage cross-country regression models are used to identify the importance of different theoretical economic and political economy explanatory variables. The discussion then also draws on regional political economy literature and insights from MENA regional studies in order to contextualize and interpret the empirical results.
Two main hypotheses guide the analysis: i) MENA economic development is significantly constrained by a lack of technological capacity and a highly inefficient allocation of re- sources. ii) The inefficient allocation of resources in MENA countries is based on the domes- tic political economy in each country and results in part from the prevalent socioeconomic and political systems of the region.
The relatively limited body of available literature stresses the poor economic performance and development of the Arab world, especially in comparison to other developing regions.
Despite high oil prices and worldwide increases in energy demand, Arab Gulf countries have not been able to channel capital accumulation into intensive sources of growth. Productivity remains low and total factor productivity (TFP) hampers rather than advances economic growth and development in these countries (Bisat et al. 1997; Abu-Qarn/Abu-Bader 2007).
There is, however, little agreement as to why Arab countries have mastered globalization so poorly. Why are there some highly competitive sectors such as the oil industry, with hardly any positive effects on local businesses and social structures, as in the Arab Gulf States, and why does the “formal” private sector remain limited despite an active and successful “in- formal” sector in the MENA region?
To date, international structural adjustment programs and recommendations to support Arab Mediterranean economic development have been primarily inspired by the Washing- ton Consensus. In principle, the IMF, the World Bank, the United States (Broader Middle East and North Africa Initiative), and the European Union (Euro-Mediterranean Partnership or European Neighborhood Policy) have championed programs to increase competition from within and outside national borders through privatization and trade openness, respec- tively. What we know today is that neither national nor international structural adjustment measures and programs in the Middle East and North Africa have rendered satisfactory re- sults: AMENA countries have witnessed a de facto decline in GDP over the past 20 years. In order to develop suitable and appropriate strategies for economic development and growth from an international as well as a national perspective, it is necessary to specifically target those constraints that are most hampering economic development. Unfortunately, it seems
that the constraints to economic development in the MENA region have yet to be better identified, and support and reform efforts may therefore be targeted in the wrong direction.
To provide a comprehensive and fresh look at MENA economic development, this paper draws on different disciplines and integrates insights from economics, political science, and regional studies into a broader analytical framework. The aim of this paper is to test whether and to what extent the technological capacities and characteristics of MENA political econo- mies have explanatory power with respect to economic development and income levels.
The next section introduces the relevant literature from both economic and regional studies perspectives and summarizes the explanatory variables championed in the different strands of literature. Section 3 discusses the indicators used for measuring the dependent and inde- pendent variables, the model specifications, and the data. Ordinary least squares (OLS) re- gressions yield a sense of the magnitude of the estimated coefficients. In addition, two-stage least squares (2SLS) based on instrumental variables (IV) are used to address reverse causal- ity, omitted variable bias, possible endogeneity, and measurement problems that restrain the accurate interpretation of relationships identified by the OLS regressions. The two stages of the estimation procedure will be elaborated in different subsections. Section 4 presents the empirical results as well as their interpretation and discussion. Special emphasis is given to the Arab countries of the Middle East and North Africa. Section 5 provides a conclusion and outlines implications for further research.
2 Related Literature 2.1 Economic Theory Innovation and Growth
Neoclassical growth theory focuses on physical and human capital accumulation as the ultimate sources of growth. In contrast, endogenous growth theorists champion technological progress and factor productivity. As a result, growth research has a stronghold on technological innova- tions and high-technology research and development. However, domestic high-technology in- dustries and sectors are virtually nonexistent in the context of developing countries. Eighty-five percent of innovations have been developed in OECD countries. Even in the USA, high- technology manufacturing accounts for merely 5 percent of the GDP. The question of how to op- timize the innovation process in high-technology sectors is subordinate to the more fundamental questions of how to trigger and how to accelerate growth in a sustained manner. Due to the lack of domestic high-technology sectors in developing countries, the priority of research has shifted from generating technology to accessing foreign technology, in particular technology from the highly industrialized OECD countries. This is demonstrated by trade economists’ concentration on the importance of economic integration and free trade (Frankel/Romer 1999). Some authors, such as Sachs and Warner (1999) or Dollar and Kraay (2004), argue that trade integration is the major determinant of growth in poor countries because there are no domestic sources of tech- nology. This view has been challenged by a relatively new strand of literature originally trig- gered by the seminal paper of Basu and Weil (1998).
Technology Adoption and Growth
Basu and Weil (1998) point to the technological bias towards the needs and framework con- ditions in highly developed countries where these technologies have been developed. They argue that the capacity of developing countries to adapt and adopt foreign technologies is as important as access to technologies, since existing technologies are not appropriate for use in developing countries. Recent studies empirically validate this model and further emphasize the importance of this concept (Acemoglu/Zilibotti 2001; Los/Timmer 2006).
Hausmann and Rodrik (2003) compare the process of technology adoption in developing countries to the innovation process in industrialized countries. They show that there is no
“off-the-shelf technology” available to developing countries and that learning about tech- nology and problem solving using the knowledge acquired in mastering technology is not without cost.
Efficient Allocation of Resources and Growth
Traditionally, inefficient allocation of resources has been identified as a lack of competition caused by monopolistic market structures, high protection against foreign competitors, and state domination of sectors or industries. The structural adjustment championed by the Bret- ton Woods organizations was and still is, despite certain limitations of this approach (cf. e.g.
Kappel 2003), principally based on the exposure of formally closed economies to international competition through trade openness and widespread privatization in to increase competition and, concomitantly, the competitiveness of developing economies (World Bank 2006).
However, a rapidly growing strand of literature supports the view that differences in growth and prosperity originate from differences in institutions. Institutions are generally described in this paper as the rules and norms of human behavior, following the definition provided by North (1989 and 1990).
Acemoglu et al. (2004) focus on the importance of economic institutions for economic growth. They argue that economic institutions that facilitate and encourage factor accumula- tion, innovation, and the efficient allocation of resources are necessary for societies to be able to prosper. Easterly et al. (1997) and more recently Alesina et al. (2003) point to cultural and ethic fractionalization as further external sources of differences in economic growth, in addi- tion to geography and climate. In a widely cited paper Rodrik et al. (2004) integrate these diverse arguments into an integrated model and conclude that “institutions rule” over geog- raphy and trade integration for economic development.
Political Economy and Growth
Krueger (1974) was the first to theoretically and empirically outline the economic phenome- non of rent seeking and its negative consequences. Her findings point to: 1) high deadweight loss, 2) a negative perception of the economic system and market mechanism as rewarding the rich and well-connected, 3) economic activity that is increasingly devoted to capturing gains from rents rather than adopting new technologies and taking entrepreneurial risks.
Olson (1982) identifies vested interests among individuals specialized in the old technolo- gies as a major cause of the slowdown in technological progress. He argues that these indi-
viduals are tempted to collude and exert political pressure in order to delay or prevent in- novations that might erode their rents.
Inefficient bureaucratic organizations are also regarded as an important factor retarding eco- nomic development. In a recent paper, Acemoglu et al. (2006) present an economic theory to explain why certain societies end up with such structures. Their findings suggest that an ineffi- cient state structure 1) allows the rich to use patronage, 2) creates more rents for bureaucrats than an efficient state would, and 3) creates its own constituency and tends to persist over time.
Economic theory identifies certain political economy structures that are more likely to ham- per economic development than others. It is important to note that rent seeking in this con- text describes the behavior of individual economic and political actors, not the behavior of the state. In functioning market structures, individuals direct their efforts to creating and ex- panding individual profit margins. This can be done in both economic and political spheres.
Merits and economic profit increase individual prosperity, political influence, and responsi- bility. In contrast, rent-seeking activities have the same intention, increasing individual profit and/or political influence, but draw on a completely different mechanism. Instead of profit- ability and innovativeness, rent seeking requires long-standing personal relationships. Rent seeking is thus not a productive activity—no “value added” is created—but rather a form of redistribution. The efforts of individuals are thus channeled to activities such as establishing and maintaining complex sociopolitical networks (Buchanan et al. 1980).
Economies with a high degree of rent seeking are sometimes described as rentier economies.
As such, the latter concept is directly linked to the neopatrimonial-state literature of political science (Lewis 1994; Schlumberger 2005; Erdmann/Engel 2007) but is not identical to this rentier-state approach, as will be discussed in the next section.
2.2 MENA Regional Studies
In this paper, rent seeking is defined as the individual effort to personally appropriate funds, for example, state subsidies, transfer payments, or economic rents generated through state intervention and/or monopolistic market structures. I have also presented the negative consequences of such a “rent-seeking culture” (Erdmann/Engel 2007). Recent country stud- ies, based on field research by their authors, have once again stressed that the rent-seeking structures outlined in the theoretical framework above exist in all AMCs.2
MENA Polity, Politics, and Political Economy Structures
Political economy structures in AMENA countries are characteristically different from Euro- pean or “Northern” economies and political systems, which are generally based on competi- tion, equality of chances, market mechanisms, and representation. MENA economies are better described as rentier economies, where individual economic success depends on per- sonal networks and successful rent seeking. A large body of MENA regional studies on po-
2 Algeria (Nili and Rastad 2007, Lowi 2004), Egypt (Schlumberger 2004, Dobronogov and Iqbal 2005), Jordan (Schlumberger 2004, Loewe et al. 2006), Morocco (Cherouki and Ben Ali 2007, Cammett 2007) Syria (Bolbol 2002, Zorob 2006), and Tunisia (Bechri and Naccache 2007, Bellin 1994, Cammett 2007)
litical and economic structures has investigated 1) where these funds/rents stem from and 2) why they are widely available. This strand of literature has established that the AMENA countries also display a rent dependency at the state level.
Beblawi and Luciani (1987) developed the concept of the rentier state, in which the nature of the state and the legitimation of the government is essentially determined by the nature and sources of the state’s revenues. The originally narrow definition of oil rents3 has since been broadened. Different rents or nonproductive revenues play an important role in the region.
The AMCs, which are scarcely endowed with oil and gas resources, in contrast to the Arab Gulf countries, depend on official development aid (ODA) and transfer payments at the level of the state and on workers’ remittances. Some might argue that FDI is also a form of external revenues. However, FDI is an investment, whereas ODA and transfer payments are grants. While FDI is allocated to potentially profitable markets and segments, ODA is granted for humanitarian or, in the case of the AMCs, geopolitical and conflict situations.
While the AMCs are underachievers with respect to FDI, more ODA is allocated to the MENA region than to any other region in the world (World Bank 2007).
The remittances that workers who live and work abroad send home to their (extended) families directly increase the purchasing power of these individuals, independent of their actual labor income. These personal transfers constitute rents, but these have little or no ef- fect on government revenues because this money is difficult to tax. This is different for rent revenues (such as the monopolistic and oil rents of state-owned companies) or external reve- nues and transfer payments (such as ODA). Since these funds make up an important part of their revenues, MENA governments are endowed with significantly more revenues that are neither extracted from their societies by taxation nor through economic productivity than governments in other developing regions. Governments do not need to justify the consump- tion or use of their revenues vis-à-vis the taxpayer, nor do they need to reinvest in produc- tion and economic processes to guarantee high revenues in future. This characteristic is very different from the obligations of and constraints on democratic European governments in re- lation to their tax-paying constituencies with respect to their use of tax-based revenues.
The polity and politics of the AMENA countries are described as being neopatrimonial po- litical rule by authoritarian regimes based on a patron-client relationship and an informal exercise of power (Pawelka 1993). Recent research confirms the actuality of this political characterization as well as the importance of the special link between economic and political decision making in MENA countries, stating that the perpetuation of regime stability is pos- sibly the superordinate objective of political and economic policies in these countries (Beck 2003). The specific ways in which politics and institutions have interacted with rents are shaping the patterns of economic performance in the region (Esfahani 2007; Beck 2007).
3 Understood as the revenues above the opportunity costs in the oil sector.
Empirical Studies on MENA Growth
Despite the plethora of scholarly articles and international organizations' publications on economic growth in various countries and regions of the world, the contributions on eco- nomic growth performance in MENA countries remain limited. Important components of the existing literature on MENA growth use the aggregate “MENA region” (Sala-I-Martin/Artadi 2003; Aubert 2004; Dasgupta 2003). The definition of the region varies significantly from study to study but generally covers around twenty countries, including Iran, Turkey and Is- rael. Consequently, these studies yield only very general and generic observations.
A few papers investigate MENA economic growth at a more disaggregated level. Bisat et al.
(1997) provide a detailed analysis of the economic growth rates of ten AMENA countries based on a growth accounting exercise (for the years 1971–96). They find that the investment process which took place over these years was not accompanied by sufficient improvement in total factor productivity (TFP). In fact, the average annual TFP growth was negative over the whole period.
Recently, Abu-Qarn and Abu-Bader (2007) have revisited the sources of MENA growth and have attempted to determine the key factors that lead to economic growth in MENA coun- tries over the period 1960–1998. They found that MENA growth performance was essen- tially determined by physical capital accumulation and, to a lesser extent, by the accumula- tion of human capital. The contribution of TFP to economic growth was negligible; all six AMENA countries exhibit negative TFP growth.
Nabli and Véganzonès-Varoudakis (2007) address the empirical link between economic re- form, human capital, and physical infrastructure and MENA economic growth. They find a strong positive impact from advances in physical infrastructure and human capital and a negative impact from structural reform on growth in six MENA countries over the period from 1970 to 1999.
2.3 The Value Added of Quantitative Analysis
The two disciplines of economics and regional studies on the Middle East have coexisted thus far with very little interaction. This paper attempts to bridge these disciplines and com- bine insights for a more comprehensive understanding of possible constraints and other fac- tors hampering economic development in Arab countries.
Although economists have recognized the difficult economic situation in these countries, it seems that they have not been able to sufficiently explain it.
Economists point to the inefficient allocation of resources as a major clue. Despite consider- able wealth and capital accumulation in the region, this potential has not been sufficiently directed to creating intensive sources of growth and has proved insufficient for supporting sustainable development. The answer was formerly (and partially still is) increased competi- tion among domestic economic actors through privatization and increased openness and exposure to international competition through trade and integration into the world market.
In brief, this mechanism describes the logic behind the structural adjustment measures, pro- grams, and recommendations introduced by international actors such as the Bretton Woods
organizations, that is, the International Monetary Fund and the World Bank, as well as those championed by the European Union in the course of the Euro-Mediterranean Partnership or European Neighborhood Policy. However, the past 20 years have shown that the situation in the AMCs has not changed significantly.
The value added of this paper is the combination of MENA regional studies and economics in order to better explain these countries’ development difficulties. The cross-country re- gression analyses are an important complementary tool for quantifying and weighing the importance of several explanatory variables from regional science and economics.
3 Methodology
The two hypotheses are tested with two-stage cross-country regressions, based on a sample of 173 countries. Unless reported otherwise, all data are from the year 2005. The base year for constant US dollar prices in purchasing power parity is 2000. The quantitative data analysis is based on cross-country regressions and benchmark comparisons.
Cross-country Regressions
The cross-country regressions use the correlation between dependent and independent vari- ables. In my analysis, log GDP per capita is confronted with different variables identified as important for economic development from an economic theory perspective. The aim is to analyze their general relationship and find out whether these factors have a positive or negative influence on long-term economic development. In addition, the regressions help to quantify the degree to which the respective variables matter and to understand the explana- tory power of the variables (R2).
Benchmark Comparison
A benchmark comparison allows for inter- and intraregional country-by-country compari- son, based on country rankings and regional comparisons. This is an important step in iden- tifying the level to which MENA growth is affected by constraints.
3.1 Instrumental Variables Estimation and Two-stage Least Squares
The reason I do not apply panel data analysis is twofold. The most important constraint is the availability of data concerning the key variables, such as quality of economic institutions and technological readiness. On the one hand, neither time series nor panel data analysis is possible, because important indicators such as the technology or institutional parameters are only available for the years after 1995 and 2003, respectively. On the other hand, MENA countries have not shown significant changes in the institutional variables over the past ten years (Heritage Foundation 2007; CIDCM 2006), which renders both techniques less attrac- tive. I thus rely on multiple regression analysis.
Standard Ordinary Least Squares (OLS) regression, as described above, gives us an idea of the fit and the degree of explanatory power of the variables concerned. However, due to endoge-
neity, multicollinearity,4 and heteroscedasticity5 concerns, possible measurement and omitted variables bias the coefficients and are therefore not entirely accurate. I use instrumental vari- able methods such as Two-stage Least Squares (2SLS) regressions to provide better estimates.
In this section I outline the concept of Instrumental Variables (IV) and 2SLS regressions, which will be employed in the next section. 2SLS is a state-of-the-art instrumental variable method for solving the problem of endogeneity of one or more explanatory variables, that is, for mul- tiple regression models with single or multiple endogenous explanatory variables. In applied econometrics, the method of 2SLS is currently the second most popular after OLS estimations.
When dealing with omitted variable bias, that is, a bias due to unobserved variables that are not included, the least satisfactory option is to ignore the problem and accept biased and in- consistent estimators. In some cases the problem can be solved by using suitable proxy vari- ables for the unobserved variables. However, in many cases it is not possible to find a suit- able and good proxy. IV offers a different approach to solving this problem: the unobserved variable is left in the error term, but at the same time the presence of the omitted variable is recognized. For illustration, consider a linear model with four explanatory variables:
y = β0 + β1 x1 + β2 x2 + β3 x3 + γ (1) This equation describes a simple regression model which regresses the dependent variable y on the independent variables xi, i = 1,2,3, with β0 being the intercept and γ the random error term. In this straightforward case, the coefficients β1, β2, and β3 can be estimated with an OLS regression.
Often when dealing with empirical problems such as the identification of determinants of long-term economic development, we find that one or more identified explanatory variables are in fact endogenous rather than exogenous. Rather than using x to describe explanatory variables in general, I rewrite equation (1) where z and y represent exogenous and endoge- nous variables, respectively.
y1 = β0 + β1 y2 + β2 z1 + β3 z2 + u1 (2) Testing for Endogeneity
For those cases where all explanatory variables are exogenous, OLS regressions provide the most efficient estimates. If, however, this assumption is violated, we need to apply 2SLS, since the OLS coefficient will not be accurate in this case. The test for endogeneity shows whether 2SLS is necessary and appropriate. Thus, we need to test whether or not the en- dogenous explanatory variable y2 correlates with the error term u1. In the case that y2 is un- correlated (Cov(y2,u1) = 0), OLS estimation is appropriate. If y2 and u1 are correlated (Cov(y2,u1) ≠ 0), we need to estimate by 2SLS.
The Hausman Test directly compares OLS and 2SLS estimates and determines whether these differences are statistically significant. If all explanatory variables are exogenous, OLS and 2SLS estimates are consistent. The test determines whether the hypothesis that they are correlated is
4 Multicollinearity generally refers to the correlation among the regressors. In the 2SLS context, a special form of multicollinearity might arise. Correlations between ŷ2 and the exogenous variables are often higher than the correlation between y2 and these variables.
5 In contrast, for homoscedasticity variance of u1 cannot depend on any of the exogenous variables, i.e., (Cov(z1, ..., zn, u1) = 0.
rejected at a low significance level. In this case we conclude that y2 is endogenous. If an en- dogenous explanatory variable is identified, the next step is to find an instrumental variable.
Instrumental Variable
Since y2 and u are correlated, we need additional information in order to obtain consistent β estimators. This information is provided through additional exogenous, observable variables z. z is called an instrumental variable for y2 if two assumptions are satisfied: First, z is uncor- related with u (Cov(z,u) = 0). Rather than through rigorous testing, this assumption must in the majority of cases be maintained by appealing to economic behavior.6 Second, the as- sumption that z is correlated with y2 (Cov(z, y2) ≠ 0) needs to be satisfied. This correlation can be tested easily with a simple regression. Because the correlation is complicated by the pres- ence of the exogenous explanatory variables, partial correlation is tested (π2 ≠ 0 or π3 ≠ 0).
Both assumptions serve to better identify the regression coefficients β. To obtain the parame- ters π, the reduced form (3) is estimated by OLS and yields the fitted values.
y2 = π0 + π1 z1 + π2 z2 + π3 z3 + π4 z4 + v2 (3) IV estimators with multiple instruments are called two-stage least squares. At the first stage, the regression is run to obtain the fitted values ŷ2 of y2.
1 2 3 1 2 2 1 0
2 ˆ ˆ ˆ ˆ
ˆ y z z u
y =
π
+π
+π
+π
+ (4) The following second stage is an OLS regression which uses the fitted values ŷ2 in place of y2.y1 = β0 + β1 ŷ2 + β2 z1 + β3 z2 + u1 (5) The simple model presented here can easily be extended to a multiple case by adding either more exogenous explanatory or endogenous explanatory variables. Consider equations (6) and (7), respectively.
y1 = β0 + β1 y2 + β2 z1 + ... + βk zk-1 + u1 (6) y1 = β0 + β1 y2 + β2 y3 + β3 z1 + β4 z2 + u1 (7) In order to estimate a case with the two endogenous explanatory variables y2 and y3, we would need at least two additional exogenous variables, possibly z3 and z4.
6 In cases with more than one instrumental variable, overidentification tests provided by some statistical pro- grams such as STATA can effectively test the correlation with the structural error. Unfortunately, SPSS does not offer this feature and other programs such as STATA were not available. Tests will be performed as soon as possible.
3.2 Model Specifications
The challenge in every empirical or quantitative paper is multifaceted. Empirical economet- ric analysis is a very dynamic discipline and, from a regional studies perspective, the state- of-the-art analytical tool for supporting and complementing qualitative and theoretical re- search. The aim of this cross- or interdisciplinary paper is to combine state-of-the-art meth- odology, presented in the previous section, with insights and evidence from MENA regional studies, and especially from political science.
So far, I have (in section 2) described the implications of economic theory literature on de- velopment and economic growth. I have discussed the limits of these conceptualizations against the background and situation in developing versus highly industrialized countries (cf. subsection 2.2). I have then identified political economic characteristics that hamper eco- nomic development and growth in general and I have outlined their importance and preva- lence in MENA countries in particular.
The remainder of this paper is dedicated to systematically combining these insights and shedding light on the constraints to economic development in the AMENA countries. Prior to presenting the empirical results in the next section, I will use this section to comment briefly on the individual methodological steps of the empirical analysis: model specification, choice of variables, and robustness check.
The specification of the regression model is an important step, critical to the quality and consistency of the empirical results. The challenge of model specification is twofold: first, confronting theory with data; second, learning from data, within the boundaries of the cho- sen model. The theoretical background outlined in section 2 sets the general analytical framework. The variables were chosen on the grounds of a solid and well established theo- retical framework. Economic development in developing country i depends on the quality of its economic institutions, its technological capacities, the degree of integration with the world economy, the size of the domestic market, and its endowment with natural resources such as oil and gas. In addition, economic development in country i is affected by war, in- ternal as well as cross-border armed conflicts, and finally by its geographic location.
Generally speaking, the present paper attempts to estimate the following equation, which formally presents and summarizes the arguments of the theoretical discussion:
ECDEVi = β1 + β2 EconInsti + β3 Technologyi + β4 Opennessi + + β5 Marketsizei + β6 Oildependence + β7 Conflicti +
+ β8 Geographyi + β9 Region1 + γi (8) The economic development (ECDEV) of country i is the dependent variable and thus is writ- ten on the left side of the equation. The idea is to find out if (statistical significance), how (positive or negative sign), and to what extent (magnitude of coefficient) variations of inde- pendent variables are able to explain cross-country differences in economic development. β1 is the intercept and γi the random error term.
The important independent variables with a potential positive effect, as identified through theoretical and empirical contributions are: the quality of economic institutions (ECONINST), technological progress (technology), trade integration (Openness), and market
size (Market). In contrast, war and conflict (conflict) as well as geography are, particularly in developing countries located close to the equator, to have a negative impact. In order to con- trol for regional differences, a set of regional dummy variables is also included.
The key variables of interest are economic institutions and technology. Therefore, summa- rizing a set of control variables in Zi yields the core or benchmark specification, equation (9), which stresses that the analysis focuses on our independent variables of particular interest:
economic institutions, technology, and regional characteristics.
logGDPi = β1 + β2 Zi + β3 EconInsti + β4 Technologyi +
+ β5 Regioni + γi (9) To estimate the coefficients, we first need to find out how to actually measure the variables.
In some cases this is straightforward. Variables such as regional identification are directly observable. In other cases well-established proxy variables exist. Economic development is, by and large, proxied by the per capita GDP. While the GDP per capita is not just an indica- tor for the level of economic development, under the assumption that per capita income lev- els were more or less similar in the very distant past, differences in current income levels re- flect the diverging growth performance in the long run (Bormann et al. 2006).
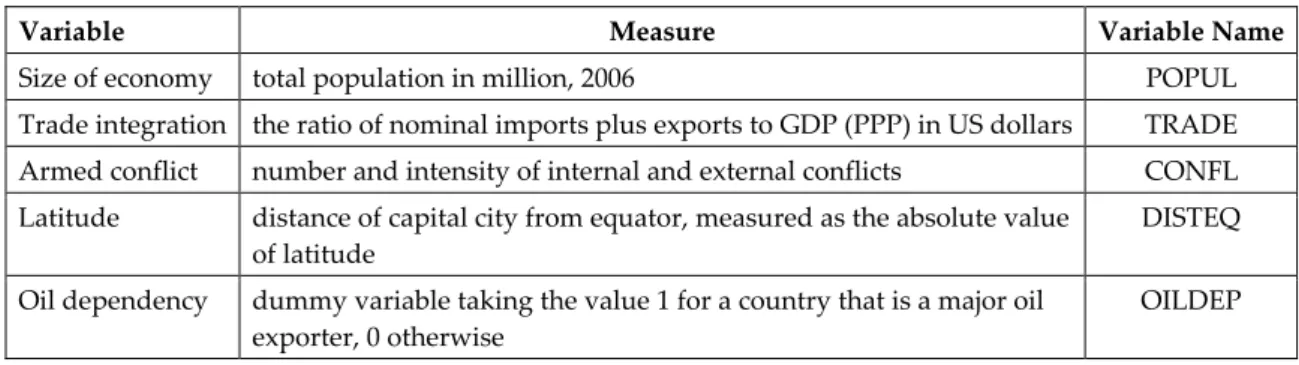
Throughout the literature, there are widely accepted proxy variables for all chosen control variables, which are summarized in Table 1. The first variable relates to the mere size of a national economy, measured as the total population. Since a larger domestic market is gen- erally associated with increased business opportunities and a broader basis of human capi- tal, I expect a positive sign. The next two variables introduce an international dimension of economic development. The integration into the global economy as an important determi- nant of development, both because it enlarges markets and because it is an important chan- nel for technology transfer, has been discussed in section 2. Here I use the real openness of a country as calculated by Summers et al. (2006) as the proxy.7 The internal and external con- flicts of a country increase the uncertainty for investors and restrict living conditions, and this variable is therefore expected to have a negative sign (Collier/Hoffler 2004).
Table 1: Control Variables and Their Measures
Variable Measure Variable Name
Size of economy total population in million, 2006 POPUL Trade integration the ratio of nominal imports plus exports to GDP (PPP) in US dollars TRADE Armed conflict number and intensity of internal and external conflicts CONFL Latitude distance of capital city from equator, measured as the absolute value
of latitude
DISTEQ
Oil dependency dummy variable taking the value 1 for a country that is a major oil exporter, 0 otherwise
OILDEP
The last two variables control for the impact of geographic location on development. Dis- tance from the equator is a proxy for climate. Economic development in a country with a tropical climate is, on the one hand, likely to be constrained due to the high burden of tropi-
7 (EX + IM)/GDP per capita (PPP).
cal diseases and high morbidity rates (Diamond 1999; Sachs 2001). On the other hand, ex- treme hot or cold temperatures, temperature changes (such as the night/day change in de- serts), and high humidity are challenging conditions for specialized machinery, sensitive technologies, and research, and thus seem to hamper technological progress. Finally, oil de- pendency relates to the discussion on rent –seeking; rentier states; Dutch disease; and, last but not least, the resource curse literature.
Key Variables
For both key variables, economic institutions and technology, there are no established prox- ies. Nevertheless, there are some suitable possibilities. The most common approach is to measure the quality of economic institutions by the extent of existing property rights, as these are generally viewed as an important indicator of a reliable and stable economic situation, where investors are protected against arbitrariness and expropriation. However, this indica- tor yields a very narrow definition of economic institutions. In a widely cited contribution, North (1990) provides a much broader interpretation of economic institutions, describing them as “humanly devised constraints that shape human interaction” and which “as a conse- quence structure incentives in human exchange whether political, social, or economic.”
Following this approach, I use a set of indicators to measure economic institutions. Rather than developing my own index, I draw partially on the Index of Economic Freedom (IEF) provided by the Heritage Foundation, which will be briefly introduced in section 3.3. The quality of economic institutions is presented as a set of eight indicators which are summa- rized as a simple average.8
ECONINSTi = 1/8 Σ (Property rights + Business Regulation + + Tariff Openness + Fiscal burden +
+ Monetary Regime + Capital Markets Restrictions + + Goods Markets Restrictions +
+ Labor Market Rigidity) (10) Technology is often used as a synonym for innovativeness, and therefore, standard meas- ures are the number of patents filed by residents, the number of scholarly articles, the num- ber of scientists per 10,000 inhabitants, and expenditures for research and development (R&D). While these measures may be appropriate in the context of highly industrialized countries, I have already discussed why they are not appropriate when dealing with devel- oping economies (cf. section 2). Therefore, there is little sense in applying these indicators.
Instead, I use technological readiness rather than innovative capacity as a proxy. This choice reflects the fact that technological progress in developing countries does not stem a priori from technological advances, but rather from the efficient use and adaptation of already ex- isting technologies. The Global Opinion Survey (GOS) published by the World Economic Forum is one of the few sources that allow for a cross-country comparison of international competitiveness. Even if technological readiness is not directly observable, the GOS question
8 Originally, the IEF encompasses ten freedoms. However, in this paper I will use similar indicators, corruption and the allocative nature of government, as instrumental variables.
5.7 “Your country’s level of technological readiness (1 = generally lags behind most other countries, 7 = is among the world leaders)” is a valuable proxy.
Table 2 briefly summarizes how the key variables are measured in the first step of the em- pirical analysis of this paper.
Table 2: Key Variables
Variable Measure Variable Name
Economic institutions quality of economic institutions is measured as an index of the degree of freedom of eight indicators
ECONINST
Technological readiness country average of executive opinion survey TECHREAD
OLS regressions with the above variables will yield important insights on the relationship between these and the dependent variable, economic development.
We know from economic and political economy literature that economic institutions matter.
In contrast to geography or market size, which are clearly exogenous variables, economic in- stitutions themselves depend on different factors, and are therefore endogenous rather than exogenous variables. Particularly since they are man-made and, to a large extent, chosen by the ruling elites. In order to specify economic institutions, I again draw on several important determinants that potentially shape national economic institutions, as identified in political economy and MENA regional studies literature.
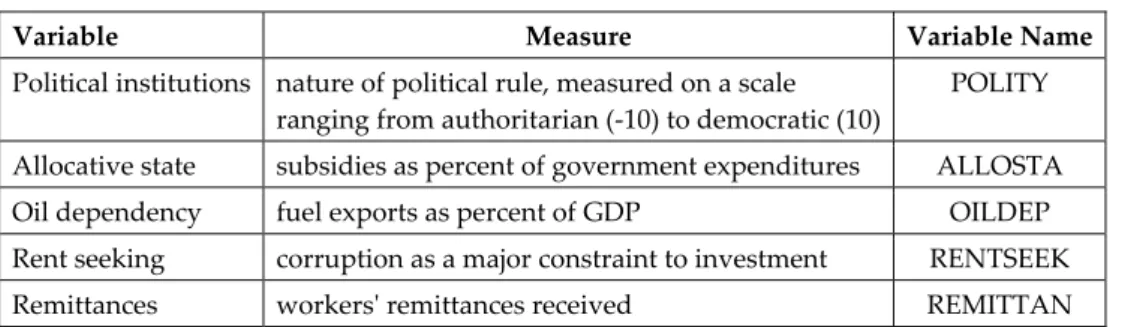
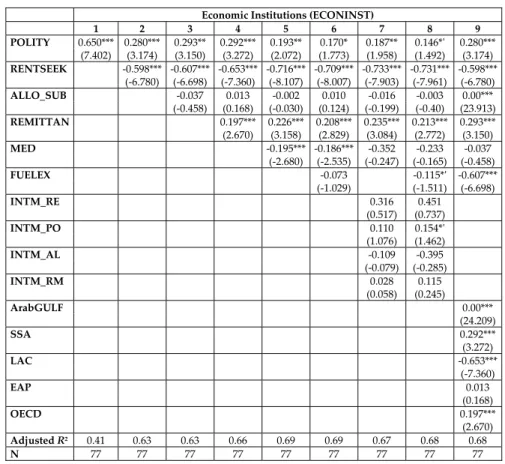
The economic institutions (ECONINST) of country i depend on the nature of its political in- stitutions and political rule (Polity), the extent of rent-seeking behavior (RENTSEEK), the al- locative nature of the state (ALLOSTA), the workers’ remittances received (REMITTAN), the endowment with natural resources (OILDEP), and possibly the regional context. Equation (11) yields the benchmark specification for the analysis of economic institutions. The proxy variables that I use for the chosen independent variables are summarized in Table 3.
ECONINSTi = π1 + π2 Polityi + π3 Rentseeki + + π4 Allostai + π5 Remittani +
+ π5 Oildepi + π5 Regioni + γi (11) Table 3: Economic Institutions: Instrumental Variables
Variable Measure Variable Name
Political institutions nature of political rule, measured on a scale ranging from authoritarian (-10) to democratic (10)
POLITY
Allocative state subsidies as percent of government expenditures ALLOSTA Oil dependency fuel exports as percent of GDP OILDEP
Rent seeking corruption as a major constraint to investment RENTSEEK Remittances workers' remittances received REMITTAN
Some might argue that none of these explanatory variables, except the endowment with natu- ral resources, are exogenous, especially from a political science perspective. This is true; how- ever, all of these variables tend to only change very slowly and with respect to the AMENA
countries have not changed significantly over recent decades. According to the short- to me- dium-term perspective, the assumption that these factors are exogenous holds true.
The first two variables relate to the rentier-state debate and literature. Both authoritarian rule and the large-scale allocation of resources to subsidies are expected to hamper the effec- tiveness and quality of economic institutions. The next two variables introduce the rentier- economy aspect. Whether individuals’ economic effort is directed toward productive or nonproductive activities is highly effected by the amount of remittance inflows and the ex- tent to which personal networks matter in economic and business life. The dependence-on oil variable controls for the source of rents, which has received the most attention. But this variable is expected to have a small or minimum impact since the AMCs at the center of the analysis in this paper are for the most part scarcely endowed with oil and gas resources.
In line with the methodology discussed above, for the empirical analysis, economic institu- tions need to be viewed as part of the residual. The specification equation (9) needs to be rewritten as:
logGDPi = β1 + β2 Zi + β3 Technologyi +
+ β4 Regioni + ui (12) Where, ceteris paribus, Zi is the set of control variables and ui is the residual error term.
Rather than being able to estimate the endogenous variable ECONINST directly, we need to use the above-presented instrumental variables to obtain further information.
Introducing the relevant interaction terms yields the following extended core specification which will be the two-baseline model in subsequent OLS regression analysis, combined in the 2SLS analysis: where β1 is the intercept and γi the random error term.
Throughout the paper I will be interested in the sign, magnitude, and significance of the co- efficients βj, j = 2, ..., 7.
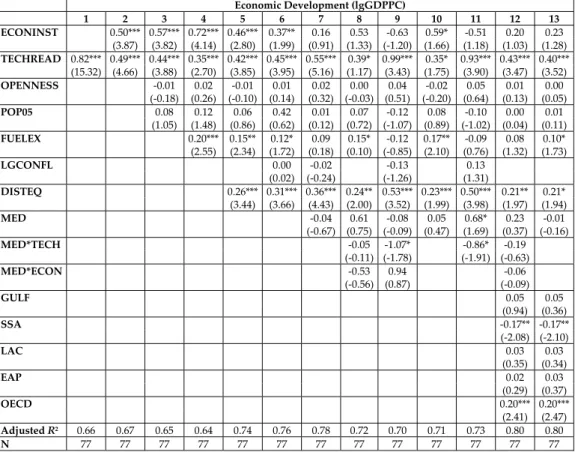
logGDPi = β1 + β2 Zi + β3 EconInsti + β4 Technologyi + + β5 Opennessi + β6 MEDi +
+ β7 EconInsti*Technologyi + γi (13) ECONINSTi = π1 + π2 Polityi + π3 Rentseeki +
+ π4 Allostai + π5 Remitani + + π6 Oildepi + π7 Regioni + + π8 MED*Allosta + + π9 MED*Rentseek + + π10 MED*Polity +
+ π11 MED*Remittances + γi (14) A positive (negative) sign identifies a positive (negative) impact of the respective variable on economic development. A negative sign is thus an important indicator of a constraining fac- tor, a constraint to economic development or the quality of economic institutions, respec- tively. The magnitude of the coefficient hints at the economic or practical importance of the variable and is interpreted as the percentage to which it is able to explain differences in eco- nomic development across countries. Finally, the significance level is important to achieve the correct idea of the explanatory power of the variable. The standard significance levels at
the 1, 5 and 10 percent mark are reported. The lower the significance level, the higher the chance that the coefficient is not robust against sample changes.9 The aim is to identify whether a variable has a positive or negative impact and to weigh the impact and effect of the determinants relative to each other (see Table 4).
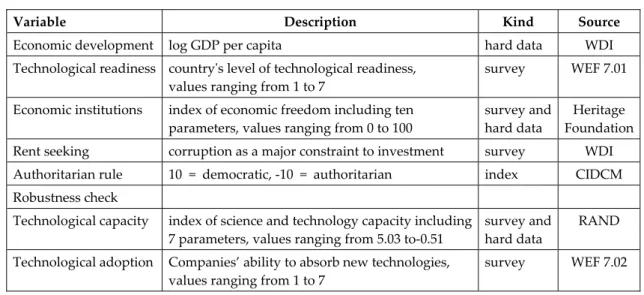
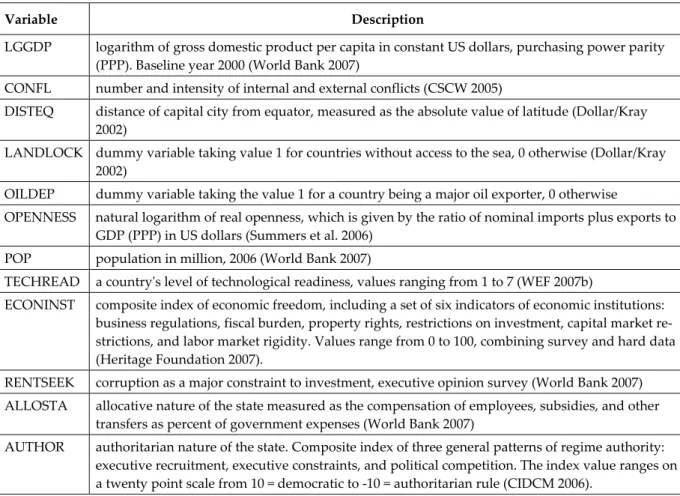
Table 4: Variable Description
Variable Description Kind Source
Economic development log GDP per capita hard data WDI Technological readiness country's level of technological readiness,
values ranging from 1 to 7
survey WEF 7.01
Economic institutions index of economic freedom including ten parameters, values ranging from 0 to 100
survey and hard data
Heritage Foundation Rent seeking corruption as a major constraint to investment survey WDI Authoritarian rule 10 = democratic, -10 = authoritarian index CIDCM Robustness check
Technological capacity index of science and technology capacity including 7 parameters, values ranging from 5.03 to-0.51
survey and hard data
RAND
Technological adoption Companies’ ability to absorb new technologies, values ranging from 1 to 7
survey WEF 7.02
3.3 Data
Despite substantial improvements, the quality and quantity of data from the Arab countries pose important obstacles to advances in research, and this partially explains why this region remains marginalized in academic literature. For this reason, I have chosen to use only dis- closed sources and reports that have been internationally recognized for their reliability.
The World Bank’s (2007) World Development Indicators (WDIs) provide the most reliable and comprehensive set of hard data on the MENA countries. They document the problem of in- sufficient and unsustained MENA economic growth performance over the past twenty years.
All of the indices presented below draw on WDIs hard data to complement their survey data.
The Global Competitiveness Index, published by the World Economic Forum (2007) is based on an executive opinion survey (Global Opinion Survey, GOS) of over 10,000 enterprises worldwide. In 2003, the GCI, for the first time, covered five AMENA countries. The most re- cent edition includes 12 AMENA countries. Rather than using the whole index, I draw on individual indicators which are undisclosed but which were provided to me by the WEF.
These comprise the categories technological readiness, process sophistication, innovative capacity, quality of education, and quality of universities. These are used mainly as alterna- tive measures for technological readiness. The subindex technological readiness is also used as a measure of robustness. The GOS is one of the most comprehensive and detailed sources providing insight into national competitiveness as it is viewed from inside the country. The
9 For my analyses, I operate at the standard 1 to 10 percent level of significance; however, in cases where the coefficient shows a large economic importance, I also check the significance at a 15 percent level, as suggested by Wooldrige (2003).
attractiveness of these data sets is uncontested. However, interpretations of the results need to take some important methodological shortcomings into account: The country averages are calculated on the basis of the answers from executive officers of firms with more than 100 employees only (World Economic Forum 2007b). This limits the representativeness of the re- sults, especially in the case of the Arab countries, where the vast majority of firms are small and medium enterprises (SMEs) with less than ten employees. Keeping this in mind, the WEF data are nevertheless valuable because, in contrast to other sources, the definition of technological readiness directly reflects the theoretical discussion on the importance of tech- nology adoption rather than innovation. WEF data is an important complement to WDI data, which focuses on indicators such as R&D expenditure, patents filed, and scientists em- ployed to reflect the technological dimension of development. These indicators are often not applicable in the case of developing countries and are either insignificant or not available, as described in the section on technological adoption above.10
In the Index of Economic Freedom (Heritage Foundation 2007) looks at property rights, which are widely used as an indicator of economic institutions. However, this definition is not ap- propriate for two reasons: international experience from Latin American and East Asian countries, respectively, shows that, on the one hand, advances in property rights are no guarantee of economic success and that, on the other hand, economic success is not condi- tional on property rights. For the analysis of the quality of economic institutions in MENA countries, I therefore draw on the Index of Economic Freedom (IEF), which is based on ten areas of economic freedom (government, fiscal, finance, monetary, trade, property rights, investment, labor, business, and corruption) compiled from 90 indicators. The index is a nonweighted average which draws on the Transparency International Corruption Percep- tion Index to measure the freedom from corruption. The IEF claims to be the first compre- hensive study of economic freedom. Its first volume was published in 1995. Despite some criticism, mainly due to its simple average nature, the IEF provides a unique tool for com- paring economic institutions across countries. Some of its shortcomings can be countered by not relying on the aggregate index itself but using the individual subindices instead, which I do in the analysis presented here.
The Polity IV Database by the Center for International Development and Conflict Management contains semiannually coded information on regime and authority characteristics for all in- dependent states (with total population greater than 500,000) in the global state system and covers the years 1800–2004. Polity IV codes regime characteristics as the authority patterns of effective polity in the arena of conventional politics. Along the 20-point polity scale, which ranges from authoritarian (-10) to democratic (10), polity scores are reliable and accurate to within one or two points. The Polity IV database provides a classification of regimes and fa- cilitates the study of regime persistence. Polity IV classification is based on the three general categories of authority patterns: executive recruitment, executive constraints, and political competition. All variables are explained in detail in the Polity Users' Manual (CIDCM 2006).
10 For an elaborate discussion of the explanation power of GCI for competitiveness, especially in the AMCss, see Brach (2007).