Demographic and Human Development in the Middle East and North Africa
Henriette Engelhardt, Florian Schulz & Zafer Büyükkeçeci
Population and Family Studies
2
Population and Family Studies
2
Band 2
hg. von Henriette Engelhardt-Wölfl er
2018
Demographic and Human Development in the Middle East and North Africa
von Henriette Engelhardt, Florian Schulz und Zafer Büyükkeçeci
2018
Die Deutsche Nationalbibliothek verzeichnet diese Publikation in der Deutschen Nationalbibliographie; detaillierte bibliographische Informationen sind im Inter- net über http://dnb.ddb.de/ abrufbar.
Dieses Werk ist als freie Onlineversion über den Hochschulschriften-Server (OPUS; http://www.opus-bayern.de/uni-bamberg/) der Universitätsbibliothek Bamberg erreichbar. Kopien und Ausdrucke dürfen nur zum privaten und sons- tigen eigenen Gebrauch angefertigt werden.
Herstellung und Druck: docupoint, Magdeburg
Umschlaggestaltung: University of Bamberg Press, Larissa Günther
© University of Bamberg Press Bamberg, 2018 http://www.uni-bamberg.de/ubp/
ISSN: 2566-7289
ISBN: 978-3-86309-547-5 (Druckausgabe) eISBN: 978-3-86309-548-2 (Online-Ausgabe) URN: urn:nbn:de:bvb:473-opus4-509934 DOI: http://dx.doi.org/10.20378/irbo-50993
Contents
Preface 15
1 Demographic Developments 17
1.1 Introduction . . . . 17
1.2 The region . . . . 19
1.3 Demographic transition . . . . 22
1.4 Population growth and international migration . . . . 23
1.5 Fertility . . . . 26
1.6 Mortality . . . . 28
1.7 Age structure and demographic dividend/potential . . . . 30
1.8 Discussion . . . . 34
Appendix to Chapter 1 . . . . 39
2 Fertility and Human Development 51 2.1 Introduction . . . . 51
2.2 Progress in human development . . . . 54
2.3 Economic progress . . . . 57
2.4 Progress in health . . . . 59
2.5 Progress in human capital . . . . 61
2.6 Gender Inequality . . . . 67
2.7 Controlling for country heterogeneity and time trends . . . . 70
2.8 Discussion . . . . 76
References 79
List of Figures
1.1 Demographic weight of the MENA countries in 1950 and 2015. . . . . 20 1.2 GDP per capita at current prices in US Dollars and share of urban
population, 1950–2014. . . . 21 1.3 Crude death and birth rates and rates of natural increase (per 1,000
population), 1950-55 to 2010-15. . . . 22 1.4 Annual growth rate and net migration rate (per 1,000 population),
1950-55 to 2010-15. . . . 24 1.5 International migrant stock as a percentage of the total population
and refugees as percentage of international migrant stock, 1990 to 2015. 25 1.6 Total fertility and mean age at birth, 1950-55 to 2010-15. . . . 27 1.7 Age-specific fertility rates (births per 1,000 women), 1950-55 to 2010-15. 28 1.8 Life expectancy at birth and infant mortality rate (both sexes
combined per 1,000 live births), 1950-55 to 2010-15. . . . 29 1.9 Male and female life expectancy at birth, 1950-55 to 2010-15. . . . 30 1.10 Median age, share of population age 15 to 24 and 65+, 1950 to 2015. . 31 1.11 Share of population under age 15 and 15 to 64, 1950 to 2015. . . . 32 1.12 Child dependency and total dependency ratio and Billeter’s J, 1950 to
2015. . . . 34 A1 Demographic weight of the MENA regions, Western Europe and the
USA in 2015. . . . 39 A2 GDP per capita at current prices in US Dollars and share of urban
population of the MENA regions, Western Europe and the USA,
1950-2014. . . . 40 A3 Crude death and birth rates and rates of natural increase (per 1,000
population) of the MENA regions, Western Europe and the USA,
1950-55 to 2010-15. . . . 41 A4 Annual growth rate and net migration rate (per 1,000 population) of
the MENA regions, Western Europe and the USA, 1950-55 to 2010-15. 42
A5 International migrant stock as percentage of total population and refugees as percentage of international migrant stock of the MENA
regions, Western Europe and the USA, 1990 to 2015. . . . 43 A6 Total fertility and mean age at birth of the MENA regions, Western
Europe and the USA, 1950-55 to 2010-15. . . . 44 A7 Age-specific fertility rates (births per 1,000 women) of the MENA
regions, Western Europe and the USA, by selected years, 1950-55 to
2010-15. . . . 45 A8 Life expectancy at birth and infant mortality rate (both sexes
combined per 1,000 live births) of the MENA regions, Western
Europe and the USA, 1950-55 to 2010-15. . . . 46 A9 Male and female life expectancy at birth of the MENA regions,
Western Europe and the USA, 1950-55 to 2010-15. . . . 47 A10 Median age, share of population age 15 to 24 and 65+ of the MENA
regions, Western Europe and the USA, 1950 to 2015. . . . 48 A11 Share of population under age 15 and 15 to 64 of the MENA regions,
Western Europe and the USA, 1950 to 2015. . . . 49 A12 Child dependency and total dependency ratio and Billeter’s J of the
MENA regions, Western Europe and the USA, 1950 to 2015. . . . 50 2.1 Relationship between total fertility rate and human development,
1990, 2000, 2010, and 2015. . . . 56 2.2 Time series association of total fertility and human development,
1990-2015. . . . 57 2.3 Relationship between total fertility and GDP per capita, 1975, 1990,
2000, and 2015. . . . 58 2.4 Time series association of total fertility and GDP per capita, 1980-2015. 59 2.5 Relationship between total fertility and life expectancy at birth, 1960,
1975, 2000, and 2015. . . . 60 2.6 Time series association of total fertility and life expectancy at birth,
1960-2015. . . . 61 2.7 Relationship between total fertility and average years of schooling
among females aged 15+, 1970, 1985, 2000, and 2010. . . . 62 2.8 Time series association of total fertility and average years of
schooling among females aged 15+, 1970-2010. . . . 63 2.9 Relationship between total fertility and percentage female population
age 15+ with no education, 1970, 1985, 2000, and 2010. . . . 64
2.10 Time series association of total fertility and percentage female
population age 15+ with no education, 1970-2010. . . . 65 2.11 Relationship between total fertility and percentage of female
population age 15+ with tertiary schooling; 1970, 1985, 2000, and 2010. 66 2.12 Time series association of total fertility and percentage tertiary
education, females aged 15+, 1970-2010. . . . 67 2.13 Total fertility and gender inequality, 1995, 2000, 2010, and 2015. . . . . 68 2.14 Time series association of total fertility and gender inequality,
1995-2015. . . . 69 2.15 Actual and predicted fertility rates based on human development. . . . 75
List of Tables
2.1 Fixed country- and year-effects panel regression of fertility on human
and economic development, progress in health and gender inequality. 71 2.2 Fixed country- and year-effects panel regression of total fertility rate
on human capital. . . . 73
Preface
It is with great that we present the second volume of the series “Population and Family Studies”. In this book, we study demographic developments in the Mid- dle East and North Africa (MENA). In the past, the demographic developments in the Middle East and North Africa have been described as “peculiar” and “unique”.
In particular, the development of fertility got attention from a western point of view because it did not show the sharp decline with increasing development as the western countries did. Moreover, the growing population size and the bulk of young people caused worries, particularly in Europe, where a discussion about
“the death of the West” has started. Thus, the demographic processes in the Mid- dle East and North Africa call for a closer inspection of the recent levels and tends.
Surprisingly, there is not much literature on these countries, leading us to compile essential descriptive findings.
In the present book, we evaluate the current state and recent demographic de- velopments in the MENA countries by presenting comparable and recent data on changes since 1950 and on the current characteristics of the population in the 22 countries of the Arab League (Algeria, Bahrain, the Comoros, Djibouti, Egypt, Iraq, Jordan, Kuwait, Lebanon, Libya, Mauritania, Morocco, Oman, State of Pales- tine, Qatar, Saudi Arabia, Somalia, Sudan, Syrian Arab Republic, Tunisia, United Arab Emirates, Yemen) plus three neighboring countries (Israel, Turkey, and Iran) using databases of various United Nations agencies and the World Bank. We de- liberately refrain from discussing population forecasts which, due to assumptions underlying to them, would be worth to be discussed separately.
In the first chapter, we provide a comprehensive demographic picture of the region by discussing various indicators jointly which yield additional insights in the demographic processes of the individual countries. In particular, we take the level and trends of fertility, mortality and natural increase into account. We ana- lyze how migration processes contribute to annual population growth and investi- gate age structures as well as demographic dividends and demographic potentials.
Our main findings are: (a) a natural increase in population in all countries; (b) an increase in fertility in three countries; (c) changing age structures that do not sup-
port the notions of a ‘youth bulk’ or population aging; (d) substantial migration but diverging patterns of refugee migration; (e) no guarantee of a demographic dividend; and (f) a heterogeneous picture in terms of the country-specific phases of demographic transition. Our findings underline that the MENA countries have to respond to demographic developments to benefit from both the demographic dividend and the population momentum by adapting their economic, social and political institutions.
In the second chapter, we take a closer look on the association of fertility and human development by analyzing various dimensions of development including wealth, health, education and gender equity. We present both cross-level asso- ciations for different points in time and time-series associations for the individ- ual countries. We also apply fixed-effects models to investigate to what extent fertility can be explained net of unobserved country and time effects by various components of development. The results show that education, especially aver- age years of female schooling and share of females with no education, and other non-economic components of development (i.e., health and gender equity) have a greater impact on fertility than economic progress. The negative association be- tween the Human Development Index and fertility becomes J-shaped at higher levels of Human Development and reverses to positive. In the same way, the neg- ative relationship between gender equity and fertility turns positive above a certain threshold. Similar to Western countries, some MENA countries with higher levels of development experienced a reversal on the fertility-development link, suggest- ing that other countries in the region will experience an increase in fertility, if the social and economic development continues. On the other hand, fertility declines in countries where the share of females with no education are relatively high may continue until reaching a certain level of development.
With this volume, we also aim at stimulating further research on the MENA countries. While we concentrated here on aggregated macro data from various international agencies, there is also – at least for some MENA countries – ex- cellent micro data available both for cross-sectional and for longitudinal analysis.
These data are not sufficiently known by the scientific community and thus under- analyzed. We hope for more research in the near future on the world’s probably fastest growing region.
Bamberg, January 2018
Henriette Engelhardt
Chapter 1
Demographic Developments
1.1 Introduction
The demographic developments in the Middle East and North Africa (MENA) have previously been described as “peculiar” (Obermeyer 1992: 33) and “unique” (Om- ran 1980: 97). This is due to its differing nature with the concept of demographic transition which suggests a transition from high birth and death rates to lower birth and death rates leading to an accelerating population growth (Thompson 1929). This transition is expected to occur in every society experiencing modern- ization including educational, economic and social progress (Kirk 1996: 365).
There have basically been two succeeding streams of literature on the demo- graphics in MENA countries. First, in the 1980s, demographers described the Arab Middle East as a region with poor demographic performance (Cleland and Wilson 1987; Fargues 1989). Unlike the negative relationship between fertility and development in Western countries, which has also been discussed within the framework of the “death of the West” (Coleman and Basten 2015), the association was weak and sometimes positive in the Arab region (Omran 1980: 97). Moreover, the overall declines in mortality lagged behind expectations based on levels of eco- nomic development (Caldwell 1986; Courbage 1999). Obermeyer (1992) counter- argued that mortality fit well with models of demographic transition, although regional trends in fertility rates lagged behind economic development. Thus, de- mographers have disagreed on the timing of mortality decline, with some even suggesting that fertility declines have lagged behind improvements in the econ- omy. In the last two decades, others claimed that birth and death rates declined, while educational facilities increased (Rashad 2000; Eltigani 2009; Casterline 2009;
Courbage 2015; Loichinger et al. 2016); whereas, more recently, Courbage (2015) and Samari (2017) have documented increased fertility in Egypt and Algeria. Us-
ing comparative, as well as country-specific analysis, Groth and Souza-Poza (2012:
9) even summarized “that few stylized observations apply uniformly to Muslim countries, whose heterogeneity is enormous” and that the demographic develop- ments resemble a jigsaw puzzle.
A second stream of literature has stressed the effect of declining fertility and mortality levels on the age-structure resulting in a youth bulk (Roudi-Fahimi and Kent 2007; Courbage 2015; Courbage and Puschmann 2015), population ageing (Rashad and Khadr 2002; Yount and Sibai 2009; Hussein and Ismail 2016), eco- nomic growth (Jones 2012; Loichinger et al. 2016), and migration (Fargues 2006, 2008). According to economic literature, the demographic transition can boost economic growth by increasing the size of the labor force (Bloom and Williamson 1998; Birdsall et al. 2001; Bloom et al. 2003). The positive effect the country- specific age structure has on economic performance should occur during the in- termediate phase of the demographic transition. This “demographic dividend”
or “bonus” has been assessed using age dependency ratios, as well as growth rates of working-age population (Jones 2012; Loichinger et al. 2016). Decreasing demographic support ratios and growth of the working-age population between 1990 and 2010 point to a demographic dividend in the MENA region (Jones 2012, Loichinger et al. 2016). Furthermore, age-structure not only affects economic growth, but also the future demographic potential of a country (Billeter 1954). Al- though this relation seems obvious, there is – according to our knowledge – no empirical evidence on this issue for the MENA countries.
Several years have passed since these two debates about the demographic tran- sition (for an overview see Tabutin and Schoumaker 2005, 2012), and the de- mographic profiles of many Arab countries have changed. Previous findings, of which some are surprising from a western perspective, call for a closer inspec- tion of the actual levels and trends of demographic processes, as well as of the demographic dividend and potential in the region. To evaluate the current state and recent demographic development in the MENA countries, we present com- parable and recent data on changes since 1950, and on the current characteristics of the population in 25 countries using the databases of various United Nations agencies (Population Division, Statistics Division). We consciously resign from discussing forecasts due to the strong underlying assumptions (United Nations 2015b; Loichinger et al. 2016), but provide a comprehensive demographic picture of the region.
We discuss various indicators jointly which yield additional insights in the de- mographic processes and present self-calculated indicators to assess the demo- graphic potential. In doing so, we add to the literature in five ways: first, we de- scribe the socioeconomic and geographical context with indicators of gross domes- tic product, urbanization, and population density. Second, we consider the level and trends of crude fertility and mortality, and natural increase. Third, against this background, we analyze how migration processes have contributed to annual population growth since 1950. Fourth, we inspect fertility and mortality processes using more specific demographic indicators. Fifth, we discuss the level and trends of the resulting age structures, demographic dividends, and demographic poten- tials. We close with a discussion of the observed processes and identify issues that call for closer inspection in the near future.
1.2 The region
There have been several approaches to choose the countries for MENA region analyses (Tabutin and Schoumaker 2005, 2012; Casterline 2009; Crane et al. 2011;
Courbage 2015; Loichinger et al. 2016). We use a broad definition of the MENA region and consider the 22 members of the “Arab League”, plus three neigh- boring countries (Israel, Turkey, and Iran). We analyze each of these 25 coun- tries separately. Additionally, we perform regional comparisons considering (1) the Arab least developed countries (Comoros, Djibouti, Mauritania, Somalia, Su- dan, Yemen); (2) the countries of the Gulf Cooperation Council (Bahrain, Kuwait, Oman, Qatar, Saudi Arabia, United Arab Emirates); (3) the Mashreq countries (Egypt, Iraq, Jordan, Lebanon, Palestine, Syria); and (4) the Maghreb countries (Algeria, Libya, Morocco, Tunisia) (Loichinger et al. 2016: 1). As the neighboring countries Israel, Turkey, and Iran did not clearly fit into any of these groups, we dropped these three countries from the regional comparison. The regional demo- graphic profiles are displayed in the Appendix.
Except for Israel, Islam is the dominant religion throughout the region. The 25 countries strongly differ regarding their economic and social conditions and are, moreover, culturally diverse, particularly because of numerous religious and ethnic minorities (Tabutin and Schoumaker 2005: 505). The demographic weight of these countries varies substantially (Figure 1.1, cf. Tabutin and Schoumaker 2005: 511). The region includes three countries with large populations, each with more than 70 million inhabitants (Egypt, Iran, Turkey). The region also includes
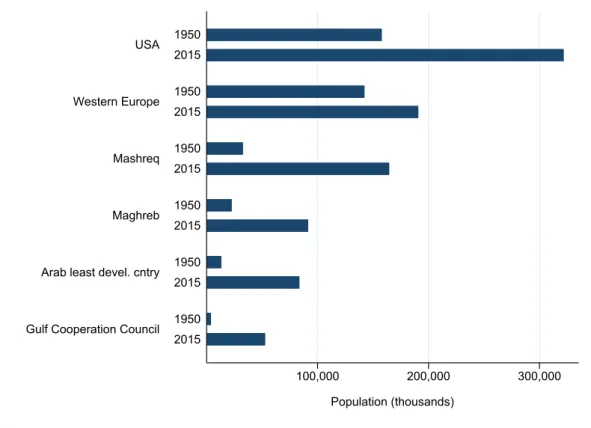
Figure 1.1: Demographic weight of the MENA countries in 1950 and 2015.
20,000 40,000 60,000 80,000 100,000
Population (thousands) Comoros
Djibouti BahrainKuwaitQatar MauritaniaPalestineLebanonJordanOmanLibya United Arab EmiratesIsrael SomaliaTunisiaYemenSyria Saudi ArabiaMoroccoAlgeriaTurkeySudanIraqIran Egypt
20151950 20151950 20151950 20151950 20151950 20151950 20151950 20151950 20151950 20151950 20151950 20151950 20151950 20151950 20151950 20151950 20151950 20151950 20151950 20151950 20151950 20151950 20151950 20151950 20151950
Data: United Nations (2015a).
two countries with less than one million inhabitants (Comoros, Djibouti), and two countries with less than two million inhabitants (Bahrain, Qatar). In sum, the MENA region was home to 1,279 million people, with a population of 224 million in North Africa. For comparison, in 2015 the United States had 322 million and Western Europe 445 million inhabitants (Figure A1). However, the Arab world has grown rapidly over the past decades. In 1950, only 66 million people were living in the region, whereas by 2015, the population was nearly twenty times that size.
On the level of single countries, Qatar and the United Arab Emirates experienced huge increases of their population over the last 60 years. In Tunisia, Turkey, and Morocco, the population increased by factors between 3 and 4 over this period.
This makes the region the second-fastest growing in the world over that period, lagging only behind Sub-Saharan Africa.
The 25 countries of the MENA region have also extremely contrasting geo- graphical features in terms of surface areas and population densities (Tabutin and Schoumaker 2005: 510). Their land areas range from 6,220 square kilometers in Palestine to almost 2.4 million square kilometers in Algeria. In many coun-
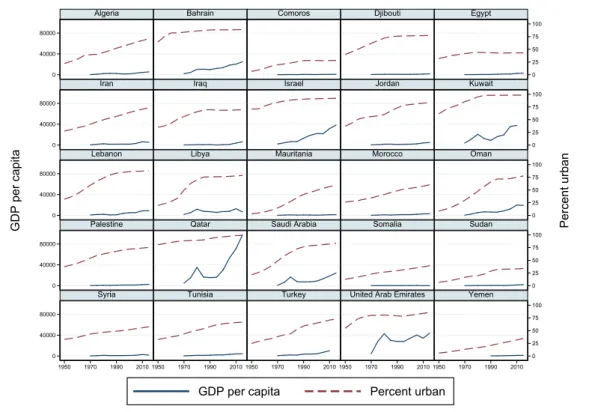
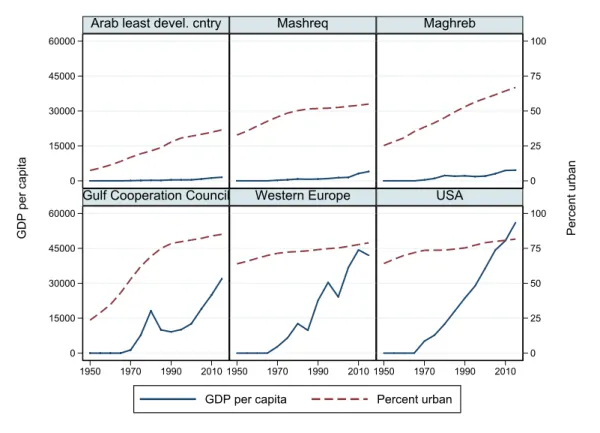
Figure 1.2: GDP per capita at current prices in US Dollars and share of urban population, 1950–2014.
0 25 50 75 100
0 25 50 75 100
0 25 50 75 100
0 25 50 75 100
0 25 50 75 100 0
40000 80000
0 40000 80000
0 40000 80000
0 40000 80000
0 40000 80000
1950 1970 1990 2010 1950 1970 1990 2010 1950 1970 1990 2010 1950 1970 1990 2010 1950 1970 1990 2010
Algeria Bahrain Comoros Djibouti Egypt
Iran Iraq Israel Jordan Kuwait
Lebanon Libya Mauritania Morocco Oman
Palestine Qatar Saudi Arabia Somalia Sudan
Syria Tunisia Turkey United Arab Emirates Yemen
GDP per capita Percent urban
Percent urban
GDP per capita
Data: United Nations (2014, 2016).
tries, vast regions are covered by deserts and steppes, and population is mainly distributed in the coastal zones (Mediterranean, Red Sea, Persian Gulf), or along rivers (e.g., Nile, Tigrus, Euphrates). Thus, crude densities of population (inhab- itants per square kilometers) as reported by the United Nations Population Divi- sion (2015a) – ranging from 3.6, 14.5 and 14.7 inhabitants per square kilometer in Libya, Oman, and Algeria, respectively, to 373 in Israel 572 in Lebanon, 765 in Palestine and 1,812 in Bahrain – may not elicit the real crowding of the popula- tion. Moreover, they are poor indicators of the relationship between agricultural resources and population (Mathieu and Tabutin 1996). Very different pictures emerge when looking at the population densities based on arable and permanent crop land areas (Tabutin and Schoumaker 2005: 511).
Alternatively, the share of urban population as reported by the United Nations Population Division can be considered. Note that these numbers are based on country-specific definitions of cities. Bahrain, for instance, defines agglomera- tions with more than 2,500 inhabitations as cities, whereas Lebanon takes 5,000
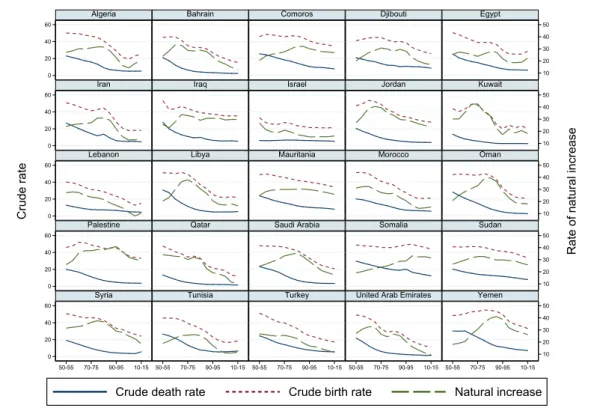
Figure 1.3: Crude death and birth rates and rates of natural increase (per 1,000 population), 1950-55 to 2010-15.
10 20 30 40 50
10 20 30 40 50
10 20 30 40 50
10 20 30 40 50
10 20 30 40 50 0
20 40 60
0 20 40 60
0 20 40 60
0 20 40 60
0 20 40 60
50-55 70-75 90-95 10-15 50-55 70-75 90-95 10-15 50-55 70-75 90-95 10-15 50-55 70-75 90-95 10-15 50-55 70-75 90-95 10-15
Algeria Bahrain Comoros Djibouti Egypt
Iran Iraq Israel Jordan Kuwait
Lebanon Libya Mauritania Morocco Oman
Palestine Qatar Saudi Arabia Somalia Sudan
Syria Tunisia Turkey United Arab Emirates Yemen
Crude death rate Crude birth rate Natural increase
Rate of natural increase
Crude rate
Data: United Nations (2015a).
inhabitants as a threshold for urban population (UN 2014: Sources for Urban Population). As shown in Figure 1.2, the share of urban population increased re- markably in all MENA countries. In 2014, the majority of the population in many of these countries lived in cities. In Lebanon, Jordan, Bahrain, and in the United Arab Emirates, up to 80% of inhabitants lived in cities. In Qatar, Kuwait, and Is- rael, only 10% of the population was residing in rural areas. In Western Europe and in the United States, about 80% of the population were living in urban areas in 2014 (Figure A2).
1.3 Demographic transition
Figure 1.3 shows the mortality and fertility patterns for the 25 countries from 1950-55 to 2010-15 based on crude death rates and crude birth rates per 1,000 inhabitants. As the model of demographic transition suggests, the entire region experienced a decline in mortality in the 1950s and 1960s. The initially very high
mortality, ranking between 30,592 in Libya and 6,261 in Israel, fell to values rang- ing from 12,386 in Somalia to 1,489 in Qatar. In 2015, the crude death rates of Western Europe and the United States were 9,699 and 8,238, respectively.
Birth rates, also initially very high, ranging between 53,321 in Iraq and 32,976 in Israel, decreased much more slowly until the 1980s. The birth rate then started to fall more quickly, while mortality levelled off. In the period 2010-15, crude birth rates varied between 43,912 in Somalia and 11,199 in the United Arab Emi- rates. Most interestingly, crude birth rates suggest an increase in fertility in Alge- ria, Egypt, and the Lebanon since 2010, when the “Arab Spring” occurred in these countries. In 2015, the crude birth rates of Western Europe and the United States were 10,218 and 12,601, respectively (Figure A3).
Although reported regularly in studies on the demographic transition, the cru- de birth rate, as well as the crude death rate, gives only a vague hint on the pace of fertility and mortality in a country. This is because it depends strongly on the country-specific age structure, as well as on the country- and age-specific mortality rates. Therefore, we inspect the fertility and mortality per country in more detail based on more specific demographic indicators.
The different patterns of onset and speed of decline in mortality and fertil- ity yield differences in the shape of the demographic transition. Tabutin and Schoumaker (2005: 521f., 2012: 2) have grouped countries according to their lat- est birth and growth rates and labeled these patterns as ‘traditional’, ‘classical’, or ‘advanced’. However, the heterogeneous patterns found in Figure 1.3 do not support such classifications in a longitudinal perspective and only a few countries indeed show similar patterns (e.g., Mauretania and Sudan, or Libya and Oman).
1.4 Population growth and international migration
The annual rate of population growth between two points in time – conventionally expressed in percentage units per year (United Nations 1983) – is calculated as an exponential rate of growth. Obviously, in almost all countries the annual growth rate does not follow the shape of the natural population growth. As Figure 1.4 shows, the shape of annual population growth is closely linked to the rate of net migration (defined as difference between in and out migration per 1,000 popula- tion). The estimates of net international migration are calculated as the difference between overall population growth and natural increase (United Nations 2015b);
Figure 1.4: Annual growth rate and net migration rate (per 1,000 population), 1950-55 to 2010-15.
-50 0 50 100 150
-50 0 50 100 150
-50 0 50 100 150
-50 0 50 100 150
-50 0 50 100 150 -5
0 5 10 15
-5 0 5 10 15
-5 0 5 10 15
-5 0 5 10 15
-5 0 5 10 15
50-55 70-75 90-95 10-15 50-55 70-75 90-95 10-15 50-55 70-75 90-95 10-15 50-55 70-75 90-95 10-15 50-55 70-75 90-95 10-15
Algeria Bahrain Comoros Djibouti Egypt
Iran Iraq Israel Jordan Kuwait
Lebanon Libya Mauritania Morocco Oman
Palestine Qatar Saudi Arabia Somalia Sudan
Syria Tunisia Turkey United Arab Emirates Yemen
Annual growth rate Net migration rate
Net migration rate
Annual growth rate
Data: United Nations (2015a).
it is not possible to calculate net migration from counts of in- and out-migration with the existing country-specific data.
Compared to Western Europe and the US, the annual growth rate in all four MENA regions is considerably higher (Figure A4). In the region of the Gulf Coop- eration Council, the annual growth rate declined sharply from 1970-75 to 1990-95, increased till 2005-10 and decreased sharply thereafter. This increase and decline is closely linked to the flow of migrants, in particular labor migrants, generated by a strong demand for labor due to the oil boom in the 1970s. The increase of the annual growth rate in the least developed Arab countries is driven by the influx of refugees at the beginning of the 1970s.
In the literature, the Maghreb- and Mashreq-countries apart from Jordan are re- garded as sending areas, the Gulf States are looked upon as net-receivers (Puschmann and Matthijs 2015: 130). Thus, in Jordan, Kuwait, Oman, Saudi Arabia, Qatar, and the United Arab Emirates, immigration would reinforce annual population growth, while in Algeria, Morocco, Tunisia, Libya, Egypt, Syria, Lebanon, Pales-
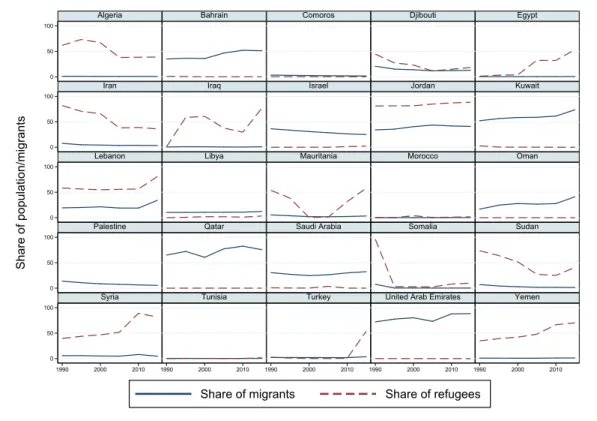
Figure 1.5: International migrant stock as a percentage of the total population and refugees as percentage of international migrant stock, 1990 to 2015.
0 50 100
0 50 100
0 50 100
0 50 100
0 50 100
1990 2000 2010 1990 2000 2010 1990 2000 2010 1990 2000 2010 1990 2000 2010
Algeria Bahrain Comoros Djibouti Egypt
Iran Iraq Israel Jordan Kuwait
Lebanon Libya Mauritania Morocco Oman
Palestine Qatar Saudi Arabia Somalia Sudan
Syria Tunisia Turkey United Arab Emirates Yemen
Share of migrants Share of refugees
Share of population/migrants
Data: United Nations (2015c).
tine, and Iraq, emigration would temper annual population growth. However, this assessment in the literature is not supported by Figure 1.4.
Economic and political situations strongly shape country-specific net migration rates. For example, the Lebanese Civil War (1975-90) produced a high increase in the annual flow of Lebanese emigrants; the Iranian Revolution in 1979 resulted in a large wave of emigration; and the Iraqi invasion of Kuwait and the ensuing first Gulf War (1980-88) were responsible for the expulsion of temporary migrants working in Iraq and the Gulf States. In the end, net migration in the MENA region is similar to net migration in the US and Western Europe, while annual growth is considerably higher.
Figure 1.5 shows data on international migrant stock as a percentage of the to- tal population (measuring the number of foreign-born population in a country at a particular point in time) and refugees as a percentage of international migrant stock. In 2015, 34.5 million international migrants, including refugees, were re-
siding in the MENA region (International Organization for Migration 2016). The destinations with most international migrants in the MENA region are Saudi Ara- bia, the United Arab Emirates, Jordan, Kuwait, and Lebanon in descending order.
Nearly three quarters (74%) of international migrants reside in the countries of the Gulf Cooperation Council. This includes over 10 million in Saudi Arabia and 8 million in the United Arab Emirates, which together host over 50% of all inter- national migrants in the MENA region.
Compared to Western Europe and the US, the stock of international migrants in the Gulf Cooperation countries is considerably higher (Figure A5). The highest share of migrants is in the United Arab Emirates with 88.4% of all inhabitants be- ing migrants in 2015 (Figure 1.5). Despite the sizeable share of migrants, the share of refugees as a percentage of international migrant stock in the individual coun- tries of the Gulf Cooperation countries amounts to zero (Figure 1.5). The MENA countries with lower stocks of international migrants obviously have a higher per- centage of refugees. In particular Lebanon, with a share of international migrants among a total population of 34.1 percent, has a particularly high percentage of refugees (80.1 percent).
1.5 Fertility
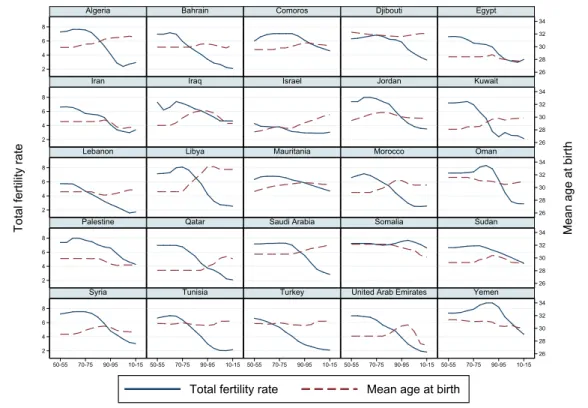
In the Arab League, the average number of children per woman has declined markedly since 1950. For example, total fertility in Northern Africa declined by 3.47 children per women (from 6.74 in 1950-55 to 3.27 in 2010-15). However, fer- tility across the region is considerably heterogeneous. The United Arab Emirates experienced the sharpest decline: fertility fell by 5.15 children, from 6.97 in 1960- 55 to 1.82 children per woman in 2010-15 (Figure 1.6). Kuwait’s fertility decline was similar, falling from 7.20 children in 1950-55 to 2.15 children in 2010-15. As in the United Arab Emirates and Kuwait, fertility declined by more than 50% in Algeria, Bahrain, Jordan, Lebanon, Libya, Morocco, Oman, Qatar, Saudi Arabia, Syria, Tunisia, and Turkey during this period.
In some of these countries, however, the pace of fertility decline has stag- nated. In three countries, Egypt, Syria, and Jordan, fertility remains at three or four children per women. In four countries, fertility is already close to replace- ment (Bahrain, Kuwait, Tunisia, Turkey) and in two countries below replacement level (Lebanon, United Arab Emirates). Not all the countries have experienced sharp declines in fertility. In seven countries, fertility remains above 4 children
Figure 1.6: Total fertility and mean age at birth, 1950-55 to 2010-15.
26 28 30 32 34
26 28 30 32 34
26 28 30 32 34
26 28 30 32 34
26 28 30 32 34 2
4 6 8
2 4 6 8
2 4 6 8
2 4 6 8
2 4 6 8
50-55 70-75 90-95 10-15 50-55 70-75 90-95 10-15 50-55 70-75 90-95 10-15 50-55 70-75 90-95 10-15 50-55 70-75 90-95 10-15
Algeria Bahrain Comoros Djibouti Egypt
Iran Iraq Israel Jordan Kuwait
Lebanon Libya Mauritania Morocco Oman
Palestine Qatar Saudi Arabia Somalia Sudan
Syria Tunisia Turkey United Arab Emirates Yemen
Total fertility rate Mean age at birth
Mean age at birth
Total fertility rate
Data: United Nations (2015a).
per women. Somalia, with a total fertility of 6.61 children, has the highest total fertility in the region. On average, the total fertility rates of the MENA region are still higher than in Western Europe (1.66) and in the US (1.89).
The sharp decline in fertility in many of the MENA countries has been at- tributed to several factors, including the rising age at marriage for women and men, delayed childbearing (see Figure 1.6), increased availability and use of mod- ern contraceptive methods, higher levels of female education, increased female labor force participation, improved status of women, and urbanization (Mirkin 2010: 13f.).
However, the trend of the age-specific fertility rates shows that the decline in total fertility is caused mainly by a change in the quantum of fertility at all ages, rather than a change in the tempo of fertility (Figure 1.7). Delayed child-bearing is only the case for selected countries during the years 2010-15 (e.g., Algeria, Saudi Arabia, Tunisia, Turkey, and the United Arab Emirates). Thus, a change of fertil- ity in MENA countries is very different from the patterns of change in Western Europe and in the US (Figure A7), which show quantum and tempo effects of fer-
Figure 1.7: Age-specific fertility rates (births per 1,000 women), 1950-55 to 2010-15.
0 150 300 450
0 150 300 450
0 150 300 450
0 150 300 450
0 150 300 450
15-19 25-29 35-39 45-49 15-19 25-29 35-39 45-49 15-19 25-29 35-39 45-49 15-19 25-29 35-39 45-49 15-19 25-29 35-39 45-49
Algeria Bahrain Comoros Djibouti Egypt
Iran Iraq Israel Jordan Kuwait
Lebanon Libya Mauritania Morocco Oman
Palestine Qatar Saudi Arabia Somalia Sudan
Syria Tunisia Turkey United Arab Emirates Yemen
1950-55 1970-75 1990-95 2010-15
Age specific fertility rates
Data: United Nations (2015a).
tility similar to Libya: a decline in the level of fertility at all ages and postponed childbearing to higher ages.
1.6 Mortality
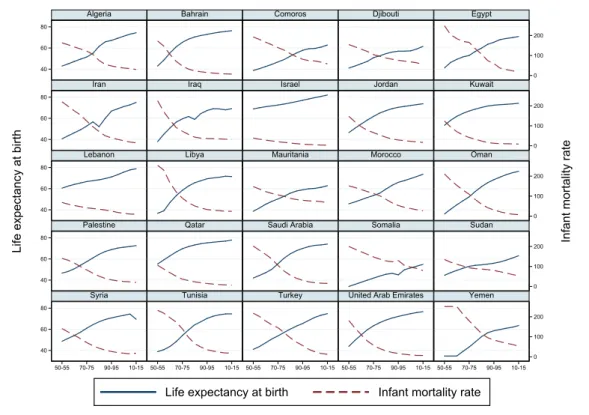
Throughout our observation period, considerable advances in life expectancy at birth have emerged in the MENA countries (Figure 1.8). In 1950-55, 8 of 25 coun- tries had life expectancies below 40 years at birth. In 12 of the 25 countries, life expectancies at birth ranged from 40 to 49 years, and in only 3 countries life ex- pectancies at birth reached 50-59 years. By 2010-15, life expectancies had dramat- ically shifted upwards across all MENA countries, so that only 4 countries had life expectancies of less than 60 years. The majority of these countries had life ex- pectancies between 70 and 79 years. In Western Europe and the United States, life expectancy at birth was at about 81 and 79 years, respectively, in 2015.
Figure 1.8: Life expectancy at birth and infant mortality rate (both sexes combined per 1,000 live births), 1950-55 to 2010-15.
0 100 200
0 100 200
0 100 200
0 100 200
0 100 200 40
60 80
40 60 80
40 60 80
40 60 80
40 60 80
50-55 70-75 90-95 10-15 50-55 70-75 90-95 10-15 50-55 70-75 90-95 10-15 50-55 70-75 90-95 10-15 50-55 70-75 90-95 10-15
Algeria Bahrain Comoros Djibouti Egypt
Iran Iraq Israel Jordan Kuwait
Lebanon Libya Mauritania Morocco Oman
Palestine Qatar Saudi Arabia Somalia Sudan
Syria Tunisia Turkey United Arab Emirates Yemen
Life expectancy at birth Infant mortality rate
Infant mortality rate
Life expectancy at birth
Data: United Nations (2015a).
The advances in life expectancy at birth during the last decades is mainly due to the improvement of life expectancy at higher ages, whereas at the beginning of the 1950s, infant mortality still was part of life. As Figure 1.8 shows, infant mortality (i.e., infant deaths per 1,000 live births) decreased considerably during the last decades. In 2010-15, Comoros, Djibouti, Somalia, Sudan, and Yemen had infant mortality rates between 79 and 50, while all other MENA countries ranged well below 50 cases. In Western Europe and the United States, the infant mortality rate was at 3 and 6, respectively, in 2015 (Figure A8).
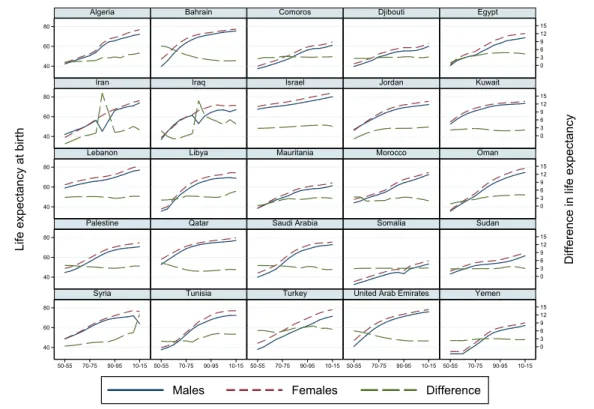
Concerning the male and female differences in life expectancy, the MENA countries show the well-known gender gap with male excess mortality (Figure 1.9). However, while in many Western countries the gender gap has narrowed over time (Luy and Gast 2014), this seems only the case for Bahrain, the United Arab Emirates, and to a smaller extent to Qatar and Saudi Arabia. In Bahrain, the difference in life expectancy at birth in 2010-15 was 1.84 years, while it was 7.38 years in 1950-55. In the United Arab Emirates, the difference decreased from 5.99
Figure 1.9: Male and female life expectancy at birth, 1950-55 to 2010-15.
0 3 6 9 12 15
0 3 6 9 12 15
0 3 6 9 12 15
0 3 6 9 12 15
0 3 6 9 12 15 40
60 80
40 60 80
40 60 80
40 60 80
40 60 80
50-55 70-75 90-95 10-15 50-55 70-75 90-95 10-15 50-55 70-75 90-95 10-15 50-55 70-75 90-95 10-15 50-55 70-75 90-95 10-15
Algeria Bahrain Comoros Djibouti Egypt
Iran Iraq Israel Jordan Kuwait
Lebanon Libya Mauritania Morocco Oman
Palestine Qatar Saudi Arabia Somalia Sudan
Syria Tunisia Turkey United Arab Emirates Yemen
Males Females Difference
Difference in life expectancy
Life expectancy at birth
Data: United Nations (2015a).
to 2.21 years during the same period. In a minority of MENA countries, the gen- der gap in life expectancy remained constant over time, whereas the difference in longevity increased in many others, suggesting that women gained more from medical progress compared to men. In Western Europe and in the United States, the difference in life expectancy at birth was about five years to the advantage of women in 2015 (Figure A9). Most interestingly, the difference in life expectancy in all MENA regions except the Mashreq suggests less gender specific mortality compared to Western Europe and the United States.
1.7 Age structure and demographic dividend/potential
Over the course of the demographic transition, declines in fertility and mortality cause important changes in a population’s age composition. In general, countries in the early stages of the transition have a younger age structure than countries in the later stages.
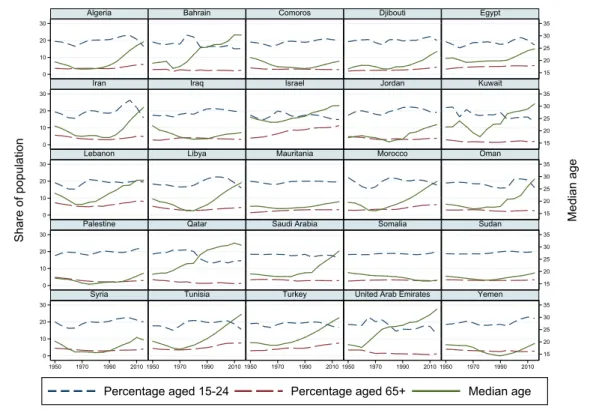
Figure 1.10: Median age, share of population age 15 to 24 and 65+, 1950 to 2015.
15 20 25 30 35
15 20 25 30 35
15 20 25 30 35
15 20 25 30 35
15 20 25 30 35 0
10 20 30
0 10 20 30
0 10 20 30
0 10 20 30
0 10 20 30
1950 1970 1990 2010 1950 1970 1990 2010 1950 1970 1990 2010 1950 1970 1990 2010 1950 1970 1990 2010
Algeria Bahrain Comoros Djibouti Egypt
Iran Iraq Israel Jordan Kuwait
Lebanon Libya Mauritania Morocco Oman
Palestine Qatar Saudi Arabia Somalia Sudan
Syria Tunisia Turkey United Arab Emirates Yemen
Percentage aged 15-24 Percentage aged 65+ Median age
Median age
Share of population
Data: United Nations (2015a).
As can be seen in Figure 1.10, most MENA countries have J-shaped median age throughout the period of investigation. The countries, though, differ with respect to the reversal of the trend. Although it was earlier in Bahrain, Lebanon, Morocco, Qatar, and the United Arab Emirates, it was quite late in Algeria, Iran, Iraq, Jordan, Libya, Saudi Arabia, and Yemen. In the year 2015, the median age ranged between 16.5 in Somalia and 30.7 in Qatar. This is quite young compared to the median age of 43.7 years in Western Europe, or 38.0 years in the United States in 2015 (Figure A10).
Despite the increase in median age, population ageing measured by share of population aged 65+ can only be observed for Algeria, Egypt, Israel, Lebanon, Tunisia, and Turkey (Figure 1.10). However, the increase in median age is closely linked to a declining share of the population under age 15 in most MENA countries (Figure 1.11). Exceptions to this pattern are Comoros, Djibouti, Israel, Maureta- nia, Somalia, and Sudan, where there is no visible clear downward trend in the share of younger population.
Figure 1.11: Share of population under age 15 and 15 to 64, 1950 to 2015.
20 40 60 80
20 40 60 80
20 40 60 80
20 40 60 80
20 40 60 80
1950 1970 1990 2010 1950 1970 1990 2010 1950 1970 1990 2010 1950 1970 1990 2010 1950 1970 1990 2010
Algeria Bahrain Comoros Djibouti Egypt
Iran Iraq Israel Jordan Kuwait
Lebanon Libya Mauritania Morocco Oman
Palestine Qatar Saudi Arabia Somalia Sudan
Syria Tunisia Turkey United Arab Emirates Yemen
Percentage aged 0-14 Percentage aged 15-64
Share of population
Data: United Nations (2015a).
The share of the working age population is usually used as a measure of the de- mographic dividend. Figure 1.11 shows that in all MENA countries the share mir- rors inverted the share of children under age 15. In most countries, we clearly ob- serve an increasing share of the working-age population and a decreasing share of the young population. This trend is particularly pronounced in Kuwait, Lebanon, Oman, Qatar, and the United Arab Emirates. In countries such as Algeria, Bah- rain, Egypt, Libya, and Tunisia, the increase has leveled off in recent years. Somalia is the only country in which the working-age population is decreasing slightly, and in Israel, the population aged 15-64 has been rather stable over the last decades.
The share of the 15 to 24 years old in relation to the total population (or to the population aged 25 to 64 years) is usually used as the measure of the youth- bulge. Figure 1.10 clearly shows that the youth bulge already belongs to the past in most MENA countries. For instance, Lebanon reached its maximum in 1976, Saudi Arabia in 1999, Libya and Morocco in 2000, Algeria in 2004, Egypt and Iran in 2005. Only Palestine, Somalia, Sudan, and Mauritania have shown a sustained youth-bulk for many decades.
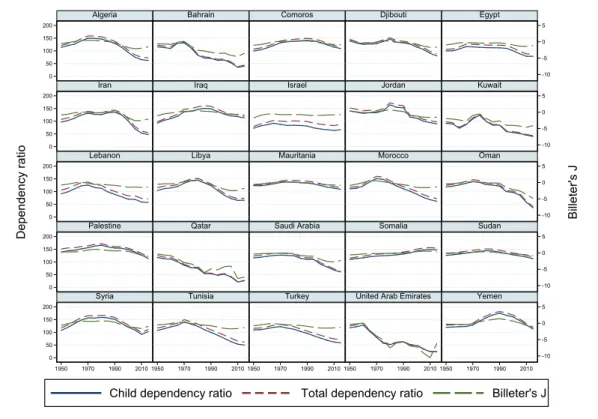
A changing age distribution has significant social and economic consequences, such as the allocation of education, healthcare, and social security resources to the young and old (Bongaarts 2009). Assessments of this impact often rely on the so-called total age-dependency ratio which summarizes key changes in the age structure. In this study, the total age-dependency ratio at a given point in time equals the ratio of population aged below 20 and over 64 to the population of age 20-64. This ratio aims to measure how many “dependents” there are for each person in the “productive” age group. Obviously, not every person below 20 and over 64 is a dependent, and not every person between ages 20 and 65 is productive. Despite its crudeness, this indicator is widely used to document broad trends in the age composition. Additionally, the young-age dependency ratio (the ratio of population aged below 20 to the population of age 20-64), or the old-age dependency ratio (the ratio of population aged over 65 to the population of age 20-64) can be considered.
Over the course of a demographic transition, the total age-dependency ratio is supposed to show a characteristic pattern of change. Figure 1.12 presents this pattern as observed in the MENA countries from 1950 to 2015. Early in the transi- tion, the age-dependency ratio typically rises slightly, as improvements in survival chances of children raise the number of young people. Following this, the age- dependency ratio falls sharply, as declines in fertility reduce the proportion of the population under age 15. This decline has important economic consequences be- cause it creates a so-called demographic dividend, which boosts economic growth by increasing the size of the labor force relative to dependents and by stimulating savings (Birdsall et al. 2001). In Western countries that are at the end of the tran- sition, the age-dependency ratio finally increases again, as the proportion of the population over age 65 rises. This is not yet the case in the MENA countries.
Figure 1.12 additionally plots the young age dependency ratio from 1950 to 2015. Most interestingly, it follows almost the same pattern with the total age- dependency ratio. Even though forecasts by the United Nations Population Divi- sion (2015b) expect population aging for the MENA countries, albeit to a lower degree than in the western world, ageing does not seem a major problem for the MENA countries until now.
Finally, Figure 1.12 plots Billeter’s J (Billeter 1954) for the 25 MENA countries.
This indicator divides the difference of the population aged under 15 and over 50 (under and over reproductive age) by the population aged between 15 and under 50 (reproductive age). Billeter’s J follows the country-specific patterns of the child