UNCORRECTED
PROOF
Deep-Sea Research Part I xxx (xxxx) xxx-xxx
Contents lists available at ScienceDirect
Deep-Sea Research Part I
journal homepage: www.elsevier.com
Physico-chemical properties of newly discovered hydrothermal plumes above the Southern Mid-Atlantic Ridge (13°-33°S)
Florian Schmid
a, b, ∗, Maike Peters
c, d, Maren Walter
a, c, Colin Devey
b, Sven Petersen
b, Isobel Yeo
e, Janna Köhler
a, c, John W. Jamieson
f, Sharon Walker
g, Jürgen Sültenfuß
caMARUM, Centre for Marine Environmental Sciences at the University of Bremen, Germany
bGEOMAR, Helmholtz-Center for Ocean Research Kiel, Germany
cIUP, Institute of Environmental Physics at the University of Bremen, Germany
dICBM, Institute for the Chemistry and Biology of the Marine Environment at the Carl von Ossietzky University of Oldenburg, Germany
eNOCS, National Oceanography Center Southampton, UK
fMemorial University of Newfoundland, St. John's, Canada
gNOAA/Pacific Marine Environmental Laboratory, Seattle, USA
A R T I C L E I N F O
Keywords:
Southern mid-atlantic ridge Mid-ocean ridges Hydrothermal plumes Helium-3
Vent fauna biogeography
A B S T R A C T
The oceanic crust is initially cooled and deep-sea chemosynthetic ecosystems are largely fed by hydrothermal cir- culation and venting on the seafloor. Much of this venting takes place at mid-ocean ridges and in order to make realistic models of the crust's thermal budget and to understand chemosynthetic biogeography it is important to have a detailed inventory of vent sites. Until recently, a major gap in this inventory was the Mid-Atlantic Ridge south of 13°S, a key region for vent fauna biogeography as it is the corridor linking the Atlantic to the Indian and Pacific Oceans. In spring 2013 we systematically surveyed the axial region between 13°S and 33°S for hydrother- mal signals in the water column, using turbidity, oxidation-reduction-potential (ORP) and noble gases as indica- tors. Standard conductivity-temperature-depth (CTD) rosette water-sampler deployments were complimented by a novel autonomous underwater vehicle (AUV) deployment strategy, in which the AUV made single-pass, seg- ment-scale (up to 100km long) dives close to the seafloor to detect small vents. The ca. 2100km-long survey covered 16 ridge segments and we identified previously unknown hydrothermal plumes above ten segments that point to 14 new hydrothermal vent fields. The majority of plumes are located at high-relief segment centers, where magmatism is robust. A wide gap in the distribution of vents in the 19°S-23°S region coincides with the Rio de Janeiro Transform, the maximum southward progression of North Atlantic Deep Waters and the maxi- mum northwards extent of3He-enriched waters with Pacific origins. Crossflowing currents in the transform and the large gap between adjacent vents may prevent a meridional connection between the vent fauna communities in the North Atlantic and along the Antarctic Ridges. This makes the region a prime target for future biogeo- graphical studies.
1. Introduction
Hydrothermal venting along the globe-spanning network of mid-ocean ridges (MORs) is a key process for the transfer of chemi- cal elements and heat from the lithosphere into the ocean. Knowing the location of individual vent fields, their frequency and spacing along the ridge axes, their discharge rates and fluid compositions is crucial to constrain geochemical cycles and the heat budget of the ocean crust (Edmond et al., 1979; Elderfield and Schultz, 1996; Hasterok, 2013;
Saito et al., 2013). Hydrothermal vent sites represent oases in the deep sea, as the discharged dissolved and particulate chemicals fuel micro- bial chemosynthesis that nourishes endemic vent communities (Fisher et al., 2007; Van Dover et al., 2002). Determining the location of indi- vidual vent sites is a prerequisite to investigate the regional vent com- munities and to understand their geographic dispersal and genetic con- nectivity across different ocean basins (Kelley and Shank, 2010; Shank et al., 1998; Van Dover et al., 2002). Currently, there is a large geo- graphical gap between known vents sites in the equatorial Atlantic and
∗ Corresponding author. GEOMAR, Helmholtz-Center for Ocean Research Kiel, Germany.
Email address:fschmid@geomar.de (F. Schmid) https://doi.org/10.1016/j.dsr.2019.04.010
Received 21 December 2018; Received in revised form 12 April 2019; Accepted 17 April 2019
UNCORRECTED
PROOF
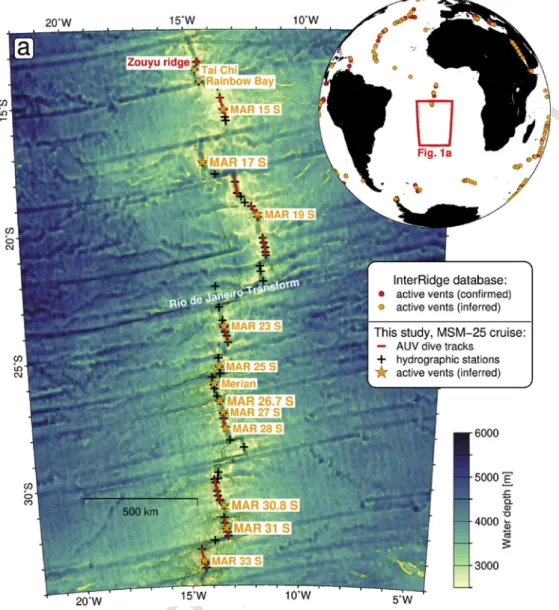
Fig. 1.Map a, overview of the study area at the Southern Mid-Atlantic Ridge (SMAR) with locations of confirmed (red) and inferred (orange) active vent sites extracted from the Inter- Ridge Vents Database, version 3.4 (http://vents-data.interridge.org/). Locations of hydrographic stations and inferred vent sites from the MSM-25 cruise are also given. Bathymetry from GMRT synthesis (Ryan et al., 2009). The globe in the upper right corner shows the location of the bathymetry map and further vent sites from the InterRidge database. (For interpretation of the references to color in this figure legend, the reader is referred to the Web version of this article.)
those along the Antarctic and Indian Ocean ridges, so the South Atlantic is a missing link in global biogeography and it is important to define biogeographic boundaries (Copley et al., 2016; Moalic et al., 2012). A further important aspect is the increasing commercial interest in hy- drothermal vent sites, because they represent the location of formation of metal-rich seafloor massive sulfide deposits. Slow spreading MOR, such as the Mid-Atlantic Ridge, are expected to bear more than 80% of the known seafloor tonnage of seafloor massive sulfides (German et al., 2016; Hannington et al., 2011; Tivey, 2007).
Since the initial discovery of active hydrothermal vents and sulfide mounds at the axes of MORs in the late 1970s (Corliss et al., 1979;
Rona et al., 1986) significant progress has been made in their oceano- graphic, geological and biological exploration. By mid-2018 the Inter- Ridge Vents Database (Beaulieu et al., 2013)– the authoritative ref- erence for the locations of active hydrothermal vent sites –lists 288 confirmed vent fields and 355 additional sites inferred from water col- umn plume-surveys (Fig. 1; Beaulieu, 2015). However, large portions of the global MORs are still unexplored for hydrothermalism (Beaulieu et al., 2015). A prominent example is the Southern Mid-Atlantic Ridge
(SMAR) south of 14°S which was, until 2013, a blank spot on the global map of venting (inset in Fig. 1).
To better constrain geochemical fluxes related to hydrothermal vent- ing, to define the biogeographic regions of endemic vent communities and to precisely evaluate associated massive sulfide deposits it is es- sential that we first determine the locations of active vent fields along the SMAR. Inferred vent locations will then serve as the basis for cruise planning and detailed studies of hydrothermalism along the SMAR in the future. In this paper we present the water column results from cruise MSM-25 of RV Maria S. Merian which took place in early 2013 with the primary goal of systematically surveying all ridge segments between 13° and 33°S for hydrothermal venting (Devey and cruise-participants, 2013). We combine measurements from 11 dives of an autonomous un- derwater vehicle (AUV) with those from ship based hydrographic casts.
Our approach is based on the detection of several independent tracers for hydrothermal venting: a) the oxidation-reduction potential (ORP), b) turbidity anomalies resulting from hydrothermal particles and c) pri- mordial helium, expressed asδ3He, discharged into the ocean by vent fluids.
UNCORRECTED
PROOF
F. Schmid et al. Deep-Sea Research Part I xxx (xxxx) xxx-xxx
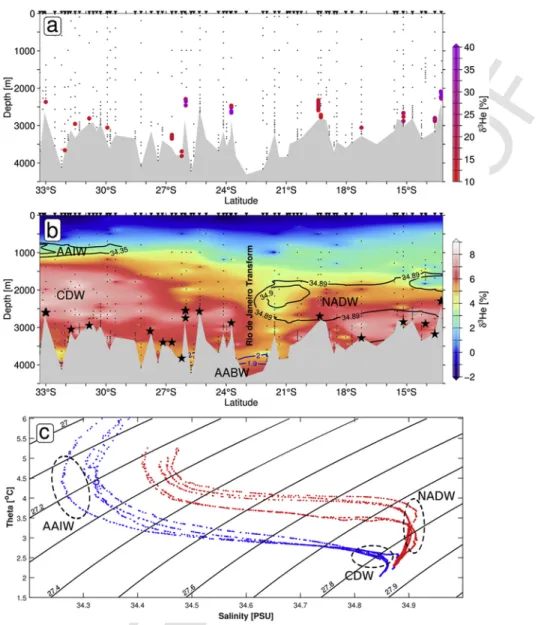
Fig. 2.Two aspects of the3He distribution above the SMAR. Panel a shows samples as colored circles whereδ3He is larger than 10%, which are considered as hydrothermally sourced anomalies. Small black dots show all sampling locations that yielded reliableδ3He values after quality control. Panel b shows a gridded meridional sectionδ3He. Values ofδ3He < 9%
have been omitted from gridding and thus the image represents the oceanic background in3He, which is not immediately affected by hydrothermalism. Black contours delineate salinities
>34.89 psμ, indicative of North Atlantic Deep Water (NADW). Blue contours delineate Antarctic Bottom Waters (AABW) of potential temperatures<2.0°C. CDW denotes Circumpolar Deep Waters carrying excessδ3He from the Pacific. Black stars indicate locations of identified hydrothermal vent sites. Panel c, T-S diagram for stations south of the Rio de Janeiro Trans- form (blue) and stations north of the Transform (red). Contours represent isopycnals. Data shallower than 700dbar have been omitted. Note, that different water masses of AAIW, NADW and CDW occupy distinct temperature and salinity ranges. (For interpretation of the references to color in this figure legend, the reader is referred to the Web version of this article.)
2. Hydrothermalism at the slow spreading Mid-Atlantic Ridge With full spreading rates of 20–35mm a−1 (DeMets et al., 2010) the Mid-Atlantic Ridge is a slow spreading MOR. Slow spreading MORs make up∼60% of the total MOR system. The compilation of all known vent sites along the global MORs reveals a coincident increase in vent field incidence and spreading rate (Baker et al., 1996; Beaulieu et al., 2015). However, the incidence of vent sites along individual sections of the Mid-Atlantic Ridge is non-uniform and distance between sites varies over an order of magnitude (Beaulieu et al., 2015; German and Parson, 1998). German and Parson (1998) propose these variations are related to larger-scale variations in the interplay between magmatic and tec- tonic activity along the ridge. In a typical MOR setting, the primary heat source for hydrothermal venting are axial magma chambers, usu- ally beneath the segment center (Baker and German, 2004; German
and Parson, 1998). A higher incidence of vent sites along some ridge sections is attributed to deep penetrating faults, which enable heat min- ing from the lower crust/upper mantle (German and Parson, 1998).
Hydrothermal vents occur in various tectonic settings on the Mid-At- lantic Ridge in diverse lithologies ranging from basaltic hosted, e.g.
Turtle Pits near 5°S (Haase et al., 2007), to ultramafic hosted e.g.
Ashadze near 13°N (Fouquet et al., 2010). The diversity of host rock lithologies results in diversity in the vent fluid compositions (Edmonds, 2010) and vent faunal communities (Kelley and Shank, 2010). Slow- and ultraslow MORs have the highest diversity of hydrothermal sys- tems of all MORs and since large portions of theses ridges are still un- explored they represent highly promising grounds for future discover- ies of vent sites with presently unknown characteristics (Baker, 2017;
Beaulieu et al., 2015). In contrast to intermediate and fast spreading ridges, where hydrothermalism is limited to the narrow neovolcanic zone, can venting along slow spreading MORs occur far off-axis as in
UNCORRECTED
PROOF
Table 1
Summary of all confirmed and inferred hydrothermal venting sites in the 13°-33°S region.
(Prelim.) site name
Seg.surveyed during
MSM-25 Inferred vent field locations
Maxturbidity
[ΔNTU] MaxΔE
[mV] Max.
δ3He [%]
Approx.
seafloor depth of vent [m]
Approx. rise height of
plume [m] Tectonic setting
MSM-25
CTDstations MSM-25 AUV dive
Zouyu-1a 16 13°15.0′S/14°24.6′Wa – – – 2300 unknown Axial high – –
Zouyu-2 16 13°17.31′S/14°24.59′Wc 0.45
(MAPR) −56
(MAPR) 146.9 2300 200 Axial high 124 #135
Tai Chi 16 13°35.41′S/14°31.21′We 0.19
(MAPR) −83
(MAPR) 29.5 3180 380 At eastern
valley wall 122 –
Rainbow
Bayb 16 14°3.6′S/14°20.4′Wb – – – 2900 unknown At eastern
valley wall – –
Deyin-1 15 15°9.97′S/13°21.34‘Wd 0.06
(MAPR) −20
(MAPR) 25.9 2850 350 Center of
axial valley 116 #134
MAR 17°S 14 17°15.13’S/14°13.62′We 0.008
(MAPR) −21
(MAPR) 19.9 3280 280 Axial high 107 –
MAR 19°S 12 19°19.81′S/11°56.53′Wd 0.08
(AUV) −22
(AUV) 22.8 2700 unknown At valley
bottom 102 #133
MAR 23°S 9 23°44.7′S/13°23.6′Wd 0.08
(MAPR) −61
(MAPR) 42.4 2880 350 on top of
oceanic corecomplex
070 #129
MAR 25°S 8 25°20.10′S/13°37.83′Wd 0.02
(MAPR) −31
(MAPR) none? 2570 200 Axial high 054 –
Merian VentField
7 26°00.99′S/13°51.17′Wd 0.15
(MAPR) −19
(AUV) 52.2 2550 280 Axial high 048 #128
7 26°02.71′S/13°50.88′Wd unknown −43
(AUV) unknown 2750 unknown Axial high 048 #128
MAR26.2°S 7 26°13.24′S/13°50.47′Wd unknown unknown 16.0 3825 unkown unkown 051 –
MAR26.7°S 7 26°42.58′S/13°36.59′Wd unknown unknown 18.0 2400 500 unkown 042 –
MAR 27°S 6 27°8.86‘S/13°28.52‘Wd 0.03
(AUV) −10
(AUV) unknown 3400 unknown At valley
bottom 039 #127
MAR 28°S 6 27°47.62‘S/13°22.38‘Wd none −30
(AUV) unknown 3100 unknown Center of
axial valley 035 #127
MAR30.8°S 2 30°49.96’S/13°28.14′We none −3
(MAPR) 12.8 2950 180 Center of
axial valley 019 –
MAR 31°S 2 31°44.26′S/13°22.63′Wf 0.007
(AUV) unknown unknown 3050 unknown Axial high Near 014 #125
MAR 33°S 1 32°58.06′S/14°27.10′Wd 0.13
(AUV) −72
(AUV) unknown 2600 unknown Axial high #124
1 32°59.68′S/14°26.55′Wd 0.07
(AUV) −32
(AUV) unknown 2600 unknown Axial high #124
alocation from Tao et al. (2017).blocation from Tao et al. (2011).clocation of buoyant plume.dlocation of strong ORP anomaly.elocation of CTD station detecting plume signal.flocation of turbidity anomaly. Note, the Zouyu-1 and Rainbow Bay sites have not been visited during our study but are listed here for completeness.
the case of Lost City (∼15km off-axis; Kelley et al., 2001) or the Ni- belungen vent field at 8°S (∼6km off-axis; Melchert et al., 2008).
The relative sparsity of active vent sites along slow spreading ridges and the rough morphology make segment-scale tow surveys–as con- ducted along fast spreading, hydrothermally more active ridges (e.g.
Baker et al., 2001; Baker et al., 2017)–very inefficient. Devey et al.
(2010) proposed a conceptual model describing the interplay of vol- canism, tectonics and hydrothermalism at slow spreading MORs. This model predicts that active venting is most likely to be detected at the magmatically robust axial highs where magma supply is enhanced and on geological time-scales only transiently disrupted by short sequences of tectonic activity. During the MSM-25 cruise we designed our survey strategy in reference to this conceptual model. Focused on morphologi- cally pronounced axial highs, often coinciding with the segment's center and identified from ship-based multibeam bathymetry, the survey pro- gram included dedicated AUV dives and/or tow-yo casts to investigate these structures (Devey and cruise-participants, 2013).
3. Primordial (mantle) helium emanating from MOR hydrothermalism
Lupton et al. (1977) were the first to report a massive plume of primordial helium (where the3He/4He ratio is significantly increased compared to the atmosphere) above the fast spreading East Pacific Rise originating from high-temperature hydrothermal venting. Owing to its inert nature the3He concentration in seawater is exclusively altered by dilution making it an ideal tracer for both hydrothermal activity and oceanographic processes (Jean-Baptiste et al., 2008; Lupton, 1998).
3He anomalies persist over larger distances than particle plumes since the latter may be subject to scavenging, dissolution or particle fall- out (Feely et al., 1994; Jean-Baptiste et al., 2008; Lupton and Jenkins, 2017). Plumes of3He above the northern Mid-Atlantic Ridge are weak (δ3He values do not exceed 15% outside regions in the immediate prox- imity of vent sites (Jean-Baptiste et al., 2008)). In comparison, at the fast spreading East Pacific Rise an extensive3He plume ofδ3He val- ues larger than 50% was observed up to 400m above the ridge axis (Lupton, 1998). The lower3He above the Mid-Atlantic Ridge is due to a lower vent field incidence and the approximately 10 faster renewal
UNCORRECTED
PROOF
F. Schmid et al. Deep-Sea Research Part I xxx (xxxx) xxx-xxx
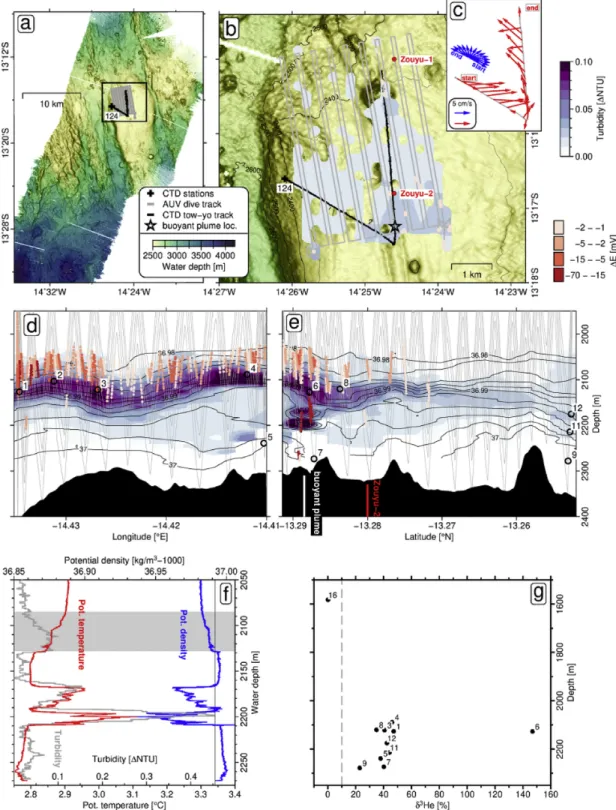
Fig. 3.Plume results from the Zouyu Ridge. Panel a, bathymetry overview of the segment. The black rectangle indicates perimeter of map b. Detailed map b shows the flat-topped axial high hosting the Zouyou-1 and 2 vent fields, coordinates from Tao et al. (2017). The gray shading represents gridded AUV turbidity, at the same color scale as MAPR data in panels d and e. Note, the AUV was flown at 50m above seafloor and thus remained below the main turbidity plume. Panel c, vectors of measured current velocities, red, along the tow-yo track and predicted barotropic tidal current velocities, blue. Panels d and e show results from tow-yo station 124 separately for the NE-SW and S-N striking parts of the station, respectively (tow track is plotted on map b). Faint gray lines indicate MAPR tracks, blue shading scales with turbidity, red dots showΔE anomalies. Numbered circles show water sampling locations and black contours are isopycnals calculated from CTD data. Panel f, profiles of temperature, density and turbidity of the CTD sensor for the tow-yo up-cast crossing the buoyant plume. To correct for a delayed response of the CTD-mounted turbidity sensor, the signal was shifted 3m upwards before plotting. The gray shaded area indicates the depth of the neutrally buoyant particle plume and the vertical black line shows the 36.992kgm−3isopycnal, coinciding with the lower boundary of the particle plume. Panel g,δ3He results from station 124 with labels corresponding to bottle numbers in panels d and e. (For interpretation of the references to color in this figure legend, the reader is referred to the Web version of this article.)
rates of Atlantic deep waters than of Pacific deep waters which leads to an efficient removal of3He over the Mid-Atlantic Ridge (Jean-Baptiste et al., 2008).
Surveys of 3He have been successfully used to trace hydrother- mal activity at regional and local scales on slow spreading MORs (Jean-Baptiste et al., 2004; Jean-Baptiste et al., 2008; Jean-baptiste et al., 1991). The discharge of3He at the Mid-Atlantic Ridge is strongest at
UNCORRECTED
PROOF
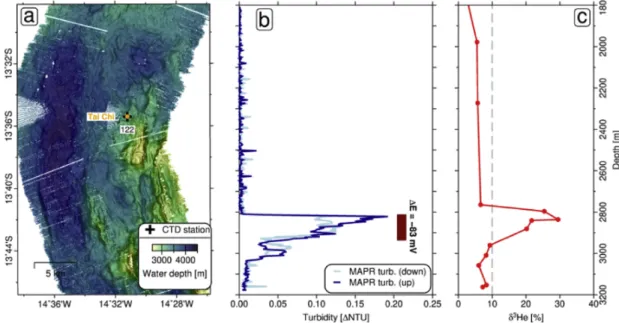
Fig. 4.Results from the Tai Chi vent field. Bathymetry map a shows the location of the Tai Chi vent field above which CTD station 122 was located. Panel b, MAPR turbidity andΔE anomalies (red bar) at station 122. Panel c, vertical profile ofδ3He at station 122. (For interpretation of the references to color in this figure legend, the reader is referred to the Web version of this article.)
Fig. 5.Results from the Deyin-1 site. Map a, bathymetry of the segment with black frame indicating the perimeter of map b. Panel c, turbidity and ORP measured along the AUV track on map b, plotted versus latitude. Panel d shows vehicle and seafloor depths versus latitude. Panel e, results from tow-yo station 116 with faint gray lines indicating MAPR tracks, blue shading representing turbidity and red dots showingΔE anomalies. Numbered circles show water sampling locations and black contours are isopycnals. Panel f,δ3He results from station 113 and 116 with labels corresponding to bottle numbers in panel e. Note, nearby CTD cast 113 did not see any hydrothermal anomaly. (For interpretation of the references to color in this figure legend, the reader is referred to the Web version of this article.)
UNCORRECTED
PROOF
F. Schmid et al. Deep-Sea Research Part I xxx (xxxx) xxx-xxx
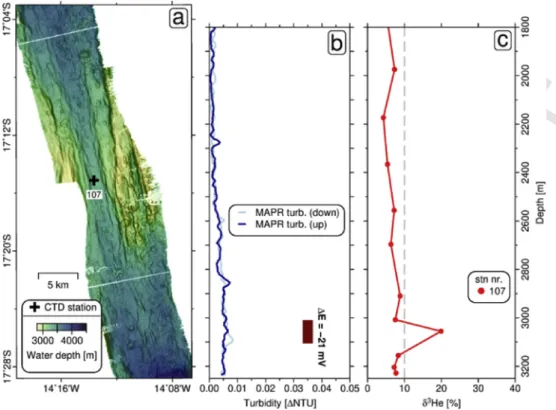
Fig. 6.Results from the 17°S plume site. Map a, bathymetry map with location of CTD 10. Panel b, turbidity and depth ofΔE anomaly at station 107. Panel c, profile ofδ3He for station 107.
Fig. 7.Results from the MAR 19° S site. Panel a, bathymetry with AUV track and station locations. Panel b, turbidity and ORP versus latitude along the AUV track plotted in a. Panel c, vehicle and seafloor depths versus latitude along the AUV track. Panel d, vertical profiles ofδ3He for stations 102 and 103.
UNCORRECTED
PROOF
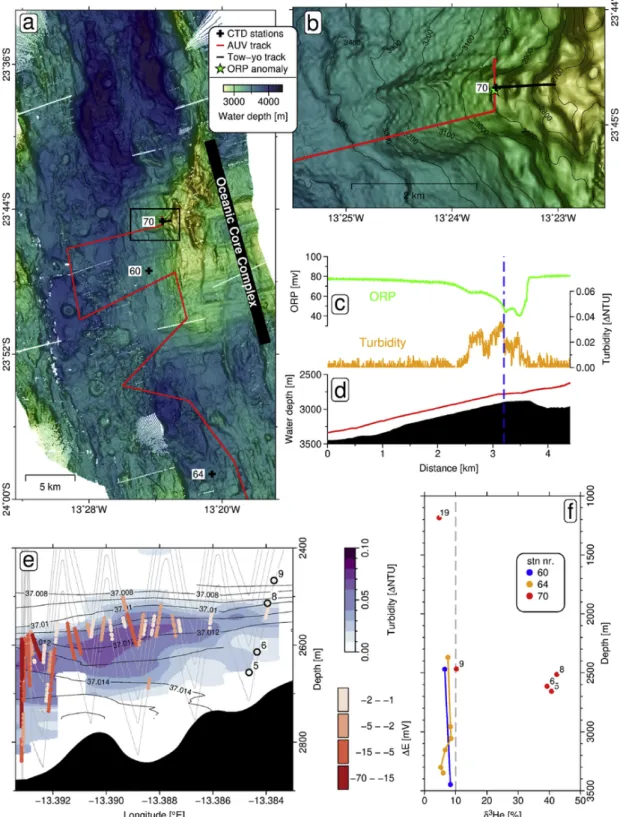
Fig. 8.Results from the 23°S segment. Map a provides an overview of the ridge segment with black bar roughly indicating the N-S extend of the oceanic core complex. The black frame indicates the perimeter of map b. Map b shows a sub-section of the AUV track in vicinity of the discovered plume. Panel c shows AUV turbidity and ORP data measured along the track section displayed in map b. Panel d indicates the vehicle and seafloor depths along the track section displayed in map b. Note, the AUV was diving from north to southwest and the location where heading was altered is indicated by the vertical dashed line. Panel e, results from tow-yo station 70 with faint gray lines indicating MAPR tracks, the blue shading representing turbidity and colored red dots showing ORP anomalies. Numbered circles show water sampling locations and black contours are isopycnals calculated from CTD data. Panel f,δ3He profiles of stations 60, 64 and 70 with labels corresponding to bottle numbers of station 70 in panel e. (For interpretation of the references to color in this figure legend, the reader is referred to the Web version of this article.)
high-temperature magmatic-hosted hydrothermal systems and generally weaker at, low-temperature cumulate- or mantle-hosted systems, e.g.
Lost City and Ashadze (Charlou et al., 1998; Edmonds, 2010; Jean-
Baptiste et al., 2008; Keir et al., 2006). First indications for active vent- ing along the southern MAR came from large scale3He distributions obtained on sections World Ocean Circulation Experiment (Rüth et al.,
UNCORRECTED
PROOF
F. Schmid et al. Deep-Sea Research Part I xxx (xxxx) xxx-xxx
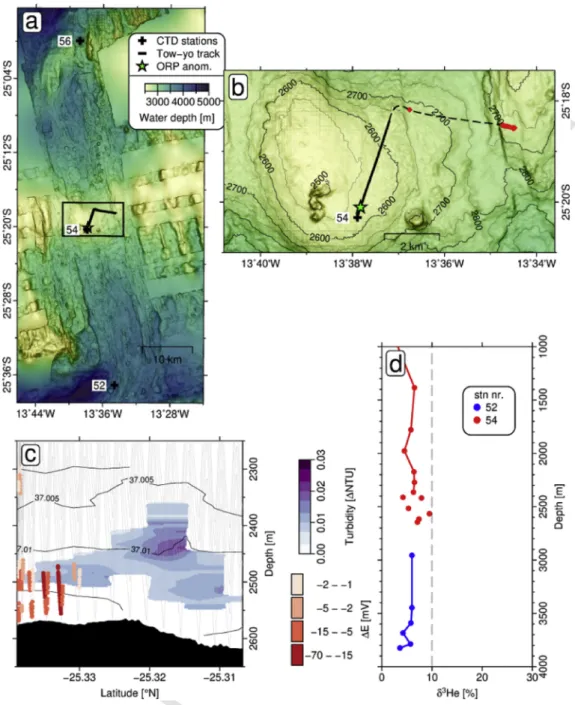
Fig. 9.Results from the 25°S plume site. Map a, bathymetry of the ridge segment with the black frame indicating the perimeter of map b. Red diamonds on map b indicate locations of water sampling, used for helium analysis. Panel c, results from the S→N trending portion of tow-yo station 54 (track shown on map b) with blue shading representing turbidity and red dots showingΔE anomalies. Panel d,δ3He profiles of stations 52 and 54. (For interpretation of the references to color in this figure legend, the reader is referred to the Web version of this article.)
2000), where3He far field plume signals emanating from the ridge crest were observed between 11°S and 30°S.
4. Materials and methods
4.1. Ship and AUV based plume surveying
We deployed five Pacific Marine Environmental Laboratory (PMEL) Miniature Autonomous Plume Recorders (MAPRs) equipped with tur- bidity, oxidation-reduction potential (ORP), temperature and pressure sensors. For standard vertical casts one MAPR unit was mounted to the SeaBird Electronics 911plus conductivity-temperature-depth (CTD) probe. For tow-yo stations additional MAPR units were mounted on the cable roughly 50, 100, 150 and 200m above the CTD. The MAPR tur- bidity sensor is a custom built, high-sensitivity optical backscatter sen
sor (Seapoint Sensors, Inc) that is specifically tuned to identify plumes of hydrothermal particles, typically discharged by hydrothermal vents of exit temperatures>100°C (Baker et al., 2016). Turbidity is measured in dimensionless nephelometric turbidity units (NTU) and reported here as the anomaly (ΔNTU) above ambient background seawater. ORP anom- alies are caused by nanomolar concentrations of reduced hydrothermal chemicals (e.g. Fe2+, HS−, H2) which are rapidly oxidized or metabo- lized after being discharged into the ocean (Walker et al., 2007). ORP anomalies typically occur closer to the vent site than turbidity anom- alies and thus are a good indicator of active venting within∼1–2km (Baker et al., 2016, 2017). The ORP sensor response is characterized by a steep decrease in potential once a plume anomaly is intersected, followed by a gradual recovery (Baker et al., 2016). Absolute poten- tial values, E, given by the ORP sensor may vary between individual sensors due to sensor drift or hysteresis. Therefore, the time deriva
UNCORRECTED
PROOF
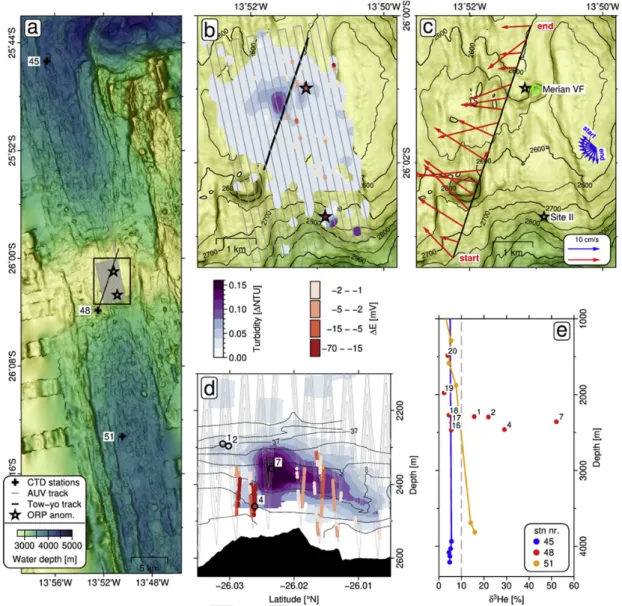
Fig. 10.Results from the 25°42′S–26°36′S segment. Map a gives an overview of the segment and the perimeter of maps b,c (black frame). Map b shows the AUV track (gray lines) and tow-yo track (black line). Blue shading, AUV turbidity data colored at the same scale as MAPR data in panel d and red dotsΔE anomalies at the same color scale as MAPR data in panel d. Note, the AUV was flown at 50m above seafloor and remained below the center of the turbidity plume. Map c, red vectors show average measured current velocities in the lowermost 200m and blue arrows show predicted barotropic tidal current velocities. Green circle indicates the location of the Merian Vent Field (Devey and cruise-participants, 2013). Panel d, results from tow-yo 48 track plotted in c. Faint gray lines indicating MAPR tracks, blue shading representing turbidity and red dots showingΔE anomalies (color bars above). Numbered circles show water sampling locations and black contours are isopycnals. Panel e,δ3He profiles 45, 48 and 51 with labels corresponding to bottle numbers of station 48 in panel d. (For interpretation of the references to color in this figure legend, the reader is referred to the Web version of this article.)
tive dE/dt is used to define an ORP anomaly (ΔE) whenever dE/dt is more negative than−0.02mV for consecutive measurements and the to- tal drop in voltage is>1.0mV. By applying these thresholds we avoid ambiguous signals caused by the variable nature of the background val- ues. The AUV was also equipped with turbidity and ORP sensors.
During the MSM-25 cruise we conducted hydrographic casts at all high-relief segment centers identified from topography and additional casts at segment-ends of all 16 first-order ridge segments between 13 and 33°S. The AUV accomplished nine long-range missions during which the vehicle was programmed to survey at 150m altitude and two dedicated dives above the Zouyu Ridge (13°S) and the Merian vent field (26°S) were carried out at 50m altitude.
4.2. Sampling and analysis of helium isotopes
For the analysis of helium isotopes in the waters above the SMAR two different sampling methods were used (Devey and cruise-
participants, 2013). 522 samples were filled into pinched-off copper tubes that were sealed free of head space and 451 samples were drawn into evacuated glass ampoules by leaving a head space for gas phases, following the methodology of Roether et al. (2013). After the cruise all samples were further processed and analysed in the Bremen Helium Isotope Laboratory (Helis; Sültenfuß et al., 2009). After gas extraction (only necessary for copper tube samples) the gases are analysed with a fully automated mass spectrometry facility, of which the technical de- tails are provided in Sültenfuß et al. (2009). 973 samples were success- fully analysed and the achieved noble gas dataset (including concen- trations of3H,4He, Ne) was carefully checked for spurious values, by also considering neon. We discard all samples that show aΔ(Ne) value lower than 1% and higher than 8% as values outside this range are im- plausible (Well and Roether, 2003). The neon data were further used to correct for excess air in the samples caused by wave induced bub- ble injection, melting ice or contamination, following the approach of (Roether et al., 2001); Roether et al. (1998). Details of excess air cor- rection are provided in Supporting Information Texts S1-S3. In the fol
UNCORRECTED
PROOF
F. Schmid et al. Deep-Sea Research Part I xxx (xxxx) xxx-xxx
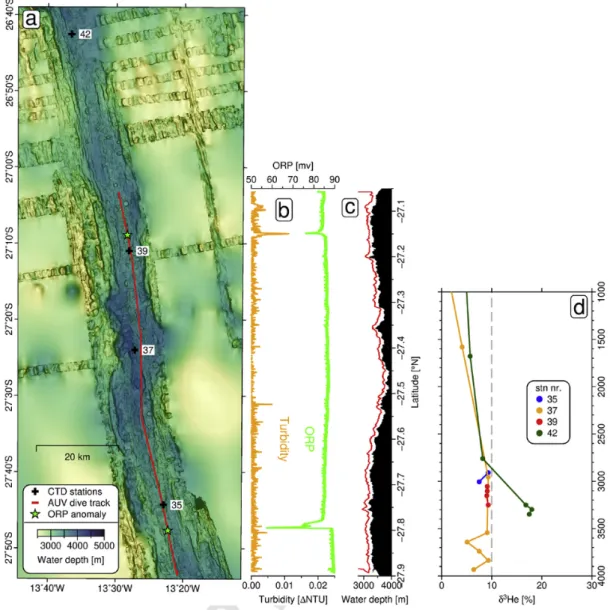
Fig. 11.Results from the 26°40′S–27°50′S region. Map a, bathymetry of the ridge segment with AUV track and CTD stations. Panel b, turbidity and ORP versus latitude along the AUV track. Panel c, vehicle- and seafloor depth versus latitude along the AUV track. Panel d, vertical profiles ofδ3He for stations 35, 37, 39 and 42.
lowing we present helium data as excess air corrected values in the commonly used delta notation, , whereR is the
3He/4He ratio in the sample andRais the3He/4He ratio in the atmos- phere.
4.3. Bathymetry data and underwater positioning
Bathymetric data were acquired with a hull-mounted Kongsberg EM122 echosounder. The raw data were manually cleansed of outliers and grids of 50m horizontal resolution were produced for each surveyed ridge segment. Wherever available, the bathymetry grids were supple- mented with auxiliary ship-based data from the Global Multi-Resolu- tion Topography Synthesis archive (Ryan et al., 2009). A hull-mounted ultra-short baseline system (USBL, IXSEA “Posidonia”) was used for precise positioning of the CTD rosette and MAPRs during tow-yo sta- tions. The AUV operated during the cruise (GEOMAR's REMUS 6000 vehicle “ABYSS”) is equipped with an inertial navigation system and a USBL beacon. The inertial navigation system gives relative positions during the dive while the USBL allowed us to determine the vehi- cles absolute position whenever the ship was in proximity during the dives. For each dive at least two independent USBL position fixes (typi
cally when the AUV had arrived at the bottom and at a later stage before the vehicle departed from the bottom) were achieved (Devey and cruise-participants, 2013). Using these fixes, the horizontal drift of the inertial navigation system was determined and yielded deviations within 100–900m after a 12–18h dive. The AUV navigation data was shifted accordingly in post processing.
4.4. Current velocity measurements and predicted barotropic tidal velocities Current velocities were measured with two RDI Workhorse lowered Acoustic Doppler Current Profilers, mounted to the CTD-rosette water sampler (Devey and cruise-participants, 2013). One sensor faced down- wards and the second one upwards and both instruments were oper- ated in synchronous mode, recording average velocities in 10m verti- cal bins. The current velocity data were processed following the scheme of Visbeck (2002). In this study we only use measurements from near the seafloor (less than 300m above bottom), gathered via the instru- ments bottom-tracking mode. The amplitudes and directions of pre- dicted barotropic tidal velocities for the location and the operation pe- riod of selected CTD stations were retrieved from the global model of ocean tides prediction, TPXO7.1, developed by Egbert and Erofeeva (2002).
UNCORRECTED
PROOF
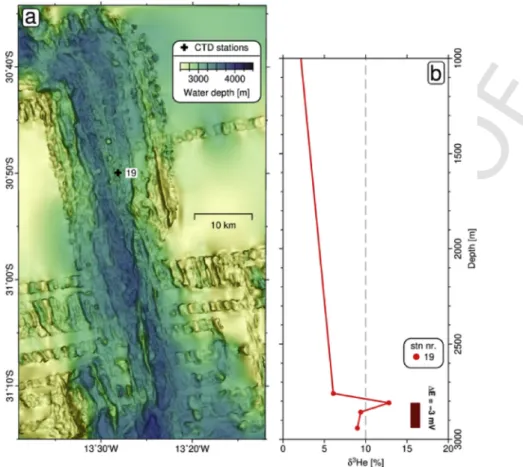
Fig. 12.Results from the 30°50′S plume site. Map a, bathymetry of the ridge segment. Panel b showsδ3He results and the depth of an ORP anomaly at station 19.
5. Results and discussion 5.1. 3He above the SMAR axis
The analysis and quality control of noble gas data yielded 525 dis- creteδ3He values above the SMAR axis (Fig. 2), a survey which is un- precedented in its extent along the spreading axis and density of sam- pling in the bottom waters.δ3He ranges between−3.4% and 146.9%
with negative values only present at depths shallower than 2000 m (Fig.
2b) and values>10% only occurring at discrete sites deeper than 2000 m (Fig. 2a). The general pattern ofδ3He values above the SMAR sug- gests that the oceanic background in the different water masses does not exceed 10% and all values above this threshold may thus be con- sidered affected by hydrothermal input (Fig. 2). Our meridional tran- sect of backgroundδ3He (omitting all values ofδ3He>10%, Fig. 2b) is in agreement with the cross-cutting zonal transects ofδ3He at 19°S and 30°S presented in Roether et al. (1998) and Rüth et al. (2000). The pub- lished zonal section at 19°S shows aδ3He maximum of 5.5% directly above the SMAR axial seafloor and∼2000 m depth (Rüth et al., 2000) which is consistent with our dataset (Fig. 2b). The zonal section at 30°S shows a slightly stronger maximum of 7% that reaches from the seafloor up to 1000m depth as does our data (Fig. 2b; Rüth et al., 2000). Overall, the3He values are of similar magnitude with those above the Northern Mid-Atlantic Ridge and lower than those above the fast Spreading East Pacific Rise (Lupton, 1998).
5.2. Is the Rio de Janeiro Transform (22°S) a barrier to the meridional dispersal of vent fauna?
The Rio de Janeiro Fracture Transform valley at 22°S represents the deepest cross-passage in the survey area and is associated with a
∼220km offset in the ridge axis. The fracture zone coincides with a gap in the distribution of hydrothermal vent fields between 19°S and 23°S and is marked by a decrease of3He concentrations throughout the water column (Fig. 2b). Our hydrographic data from the SMAR axis indicate that the southward progression of North Atlantic Deep Waters (NADW) is interrupted above this region (Fig. 2b and c). Waters at 1000–2500m depth in the region south of 27°S represent Circumpolar Deep Waters (CDW) that are enriched in3He (δ3He>6%) due to the elevated 3He background from the Pacific entering the South Atlantic via the Drake Passage (Rüth et al., 2000; Well et al., 2003). Mercier et al. (2000) re- port a throughflow in the Rio de Janeiro Transform supplied by cold and fresh bottom waters from the deep basins west of the SMAR. This is supported by our hydrographic measurements revealing Antarctic Bot- tom Waters (AABW) identifiable from potential temperatures<2.0°C (Broecker et al., 1976) in the deepest part of the transform valley (Fig.
2b).The along-axis dispersal success of passive larvae and microbes en- demic to hydrothermal vents is dependent on bottom currents and the frequency of vent sites (McGillicuddy et al., 2010; Mullineaux et al., 2002). The crossflowing waters and the absence of active vents in the 19°-23°S region prevent the meridional dispersal of vent endemic lar- vae. The maximum southward progression of NADW suggests that lar- vae from the northern and Equatorial MAR may not be transported fur- ther south than the Rio de Janeiro Fracture Zone. We hypothesize that the topographic controlled hydrography and the sparse distribution of active vents in the 19°-22°S region constitute a physical barrier to the meridional dispersal and genetic connectivity between the different vent fauna communities found along northern MAR and the Circum-Antarc- tic Ridges (Copley et al., 2016; Moalic et al., 2012). However, this hy- pothesis may only be validated by biological investigations of the vent fauna immediately north and south of the Rio de Janeiro Transform.
UNCORRECTED
PROOF
F. Schmid et al. Deep-Sea Research Part I xxx (xxxx) xxx-xxx
Fig. 13.Map a gives an overview of the ridge segment, AUV track and CTD stations. Panel b, turbidity versus latitude along the AUV track. No ORP data is available from this dive. Panel c, vehicle- and seafloor depth versus latitude along the AUV track. Panel d, vertical profilesδ3He for stations 12–17.
5.3. Detailed description of individual plume sites
The following section describes in detail the individual plumes ob- served in geographical order from north to south. We also discuss the locations of underlying vent sites and their tectonic setting. A compre- hensive summary of the coordinates of all the vent sites is provided in Table 1.
5.3.1. Zouyu Ridge, 13°16′S
The unusually extensive axial volcanic high near 13°16′S (Zouyu Ridge) was targeted by one AUV mission at 50m altitude and tow-yo station 124 (Fig. 3a and b). The axial high measures approximately 20km along-axis by 8km across-axis and rises as high as the local rift flanks (Fig. 3a and b). Tow-yo 124 started at the western rim of the axial high and after pursuing a southeasterly heading for 3km the course was altered to north and the CTD was towed across a N-S oriented chain of up to 100m high mounds sitting on top of a linear scarp (possibly fault or volcanic fissure; Fig. 3b). The S-N oriented limb of the tow-yo crossed the previously known Zouyu-2 vent field (Fig. 3b, e; Tao et al., 2011;
Tao et al., 2017). The CTD sensor encountered a buoyant hydrothermal plume∼1km south of the Zouyu-2 location (at 13°17.31′S/14°24.59′W;
Fig. 3e and f) marked by a temperature anomaly of +0.31 °C and strong density inversions between 2165 and 2210 m depth (Fig. 3f).
An extensive neutrally buoyant plume was observed at ∼200m above the seafloor (Fig. 3d and e). The plume increases slightly in ver
tical extent at the northern end of tow-yo 124, possibly due to vent- ing near the Zouyu-1 vent field (Fig. 3b). Increased turbidity in the bot- tom waters near the southern apex of the tow-yo is consistent in both, MAPR and AUV data (Fig. 3b, d-e) and may indicate the presence of several active chimneys near the identified buoyant plume. Widespread ORP anomalies were observed in the upper part of the particle plume,
∼50m above the layer of highest turbidity (Fig. 3d and e). Occasional ORP anomalies were also observed below the particle plume, above the Zouyu-2 site, in the buoyant plume and near the western rim of the ax- ial high (Fig. 3d and e). The stratification above the axial high shows a staircase pattern as indicated by the variable spacing of isopycnals (Fig.
3d and e and Supporting Information Fig. S2) and the shape of the den- sity profile in Fig. 3f at depths shallower than 2160m. Water samples along the tow-yo track yieldedδ3He values of 22.9–47.9% in the neu- trally buoyant plume and an exceptionally high value of 146.9% in bot- tle number 6 directly above the buoyant plume (Fig. 3e and f). Average current velocities in the near bottom layers range from 5 to 17cms−1 and show a gradual change in direction along the tow-yo track, i.e.
through time of measurement (Fig. 3c). Predicted barotropic tidal veloc- ities for this region, at the time of tow-yo operations, range from 3 to 5cms−1and show a gradual change in direction coinciding with mea- sured near-bottom current velocities (Fig. 3c).
The coordinates of Zouyu-2 from Tao et al. (2011), do not refer to an active vent but give the dredging location of a chimney fragment.
Based on tow-camera observations Tao et al. (2011) estimated the vent field to have an extent of∼1km in the N-S direction which suggests the hydrothermal discoveries of Tao et al. (2011) in 2009/2011 and
UNCORRECTED
PROOF
Fig. 14.Results from the 33°S axial high. Map a, bathymetry of the ridge segment with black frame indicating perimeter of map b. Panel c, turbidity, potential temperature and ORP versus latitude along the AUV track displayed on map b. Panel d, vehicle- and seafloor depth versus latitude along the AUV track. Panel e, vertical profiles ofδ3He for stations 5–7. Note, that no turbidity or ORP anomaly was detected at tow-yo station 6.
Fig. 15.Relation of the vent field frequency in the 13°-33°S region of the SMAR to the vent field frequency along the global Mid-Ocean Ridges (from the compilation of Beaulieu et al. (2015). Diamonds represent hydrothermal survey results from non-hotspot influ- enced ridges binned into five spreading rate categories. Horizontal and vertical bars show give the range of data points for each category. Figure is from Beaulieu et al. (2015).
the buoyant plume we discovered in 2013 relate to the same vent field, Zouyu-2. ORP signals are indicative of recently discharged hy- drothermal fluids (Walker et al., 2007), suggesting the neutrally buoy- ant plume is particularly‘fresh’in its uppermost layers (Fig. 3d and e).
The current velocity measurements suggest that tides rapidly spread the
plume waters across the axial high. Similar types of advection of hy- drothermal plumes by tides and background currents have been de- scribed at other sites on the MAR, such as above the Logachev vent field (Schmale et al., 2012) or the Nibelungen vent field (Walter et al., 2010).
A constant vertical offset between an ORP plume and a particle plume is unusual and has never before been observed above any active vent site in such clarity. As the number of active vent sites on the Zouyu Ridge and their chemistries are unknown we can only speculate about the cause of this vertical offset. We present two scenarios to explain this offset. In the first scenario, the Zouyu-2 vent field is the primary source of the neutrally buoyant plume and the upper layer of anomalous ORP and low turbidity represents the freshest portion of the plume while the lower layer of highest turbidity and without ORP signal is composed of mature plume waters. Such a layering could be sustained by gravita- tional separation of hydrothermal particles from the reduced chemicals (e.g. Fe2+, HS−, H2producing the ORP signal) supported by the staircase stratification. The settling of particles is retarded by a jump in density (crossing the 36.992kgm−3isopycnal, Fig. 3d–f and Supporting Infor- mation Fig. S1). The vertical offset may also result from overshooting of the buoyant plume waters in the wake of which particles fall back to a level of higher density than the reduced chemicals. In the second scenario, the neutrally buoyant plume is fed by two separate venting sites of different characteristics. Site A (possibly the one producing the observed buoyant plume) discharges particle-rich fluids that are poor in reduced chemicals and thus produce no ORP anomalies beyond the buoyant plume. Site B is rich in reduced chemicals, poorer in particles and either located at shallower depths (possibly on one of the∼100m high mounds) or has higher exit temperatures than site A in order to produce a plume of∼50m higher rise height.
UNCORRECTED
PROOF
F. Schmid et al. Deep-Sea Research Part I xxx (xxxx) xxx-xxx
5.3.2. Tai Chi vent field, 13°36′S
Vertical CTD station 122 above the previously known Tai Chi vent field (also spelled Taiji; Fig. 4a) located at approximately 3100m water depth on the northern face of an inside corner high marking the south- ern boundary of a non-transform ridge-offset (Li et al., 2018). Turbid- ity and ORP anomalies were found between 2810 and 2950m depth (Fig. 4b). The upper boundary of the plume is sharply defined and cor- relates with a maximumδ3He value of 29.5% (Fig. 4c). Li et al. (2018) reported a weak temperature anomaly at 3000–3050m depth, above the vent field in 2011. Their camera surveys did not find sites of active dis- charge, leading to the conclusion that only diffusive venting was present in 2011. However, our discovery of a plume rich in3He, particles and of reduced ORP∼200m higher suggests that considerable, high-temper- ature venting was present in 2013.
5.3.3. Deyin-1 vent field, MAR 15°10′S
The 14°6′S - 15°30′S segment was investigated by a long-range AUV mission which revealed turbidity and ORP anomalies around 15°9.97′S/
13°21.34′W and subsequently this site was further investigated by tow-yo station 116 (Fig. 5). In 2011 a plume had been observed at the same site by a Chinese hydrothermal survey (S Wang et al., 2017) al- though this was unpublished at the time of the MSM-25 cruise. The site is located on a∼200m high neovolcanic ridge in the center of the ax- ial valley which was crossed from east to west by tow-yo 116 (Fig. 5a and b). We mapped a particle plume at 2440–2800m depth extending to east and west of the neovolcanic ridge (Fig. 5e). An ORP anomaly was exclusively detected to the west, suggesting the active vent field is located on this side at∼2850m depth. Water samples 2 and 4 (Fig. 5e and f) collected within the particle plume yieldδ3He values of 25.9%
and waters from slightly outside the particle plume (bottle numbers 5,7) fall back to the oceanic background (Fig. 5e). None of the monitored hydrothermal tracers showed an anomaly at the nearby station 113, im- plying that this plume is locally confined. Dredged rock samples from this site yielded basalts and massive sulfides (H Wang et al., 2017).
5.3.4. MAR 17° S
The segment between 16°24′S and 17°36′S was sampled by verti- cal CTD station 107, located above an axial high at the segment center.
There, the axial valley is unusually narrow, 1.5km wide, compared to
∼10km width further north and south (Fig. 6a). AnΔE anomaly of−21 mV was detected between 3010 and 3015m depth (∼260m above the seafloor) but no significant increase in turbidity was observed (Fig. 6b).
One water sample from 3055m depth yielded aδ3He value of 19.9%
confirming the presence of hydrothermal input in the area (Fig. 6c). The ORP anomaly implies that the source is not far (<1km) from the sam- pling site and the absence of a turbidity anomaly suggests that venting is likely of low-temperature and particle-poor character.
5.3.5. MAR 19° S
The SMAR axis between 19°S and 19°36′S, comprising several sec- ond-order ridge segments, was surveyed by one long-range AUV mis- sion and three vertical CTD casts. In this region the ridge axis is char- acterized by a ∼5km wide axial valley that is, in most places, not significantly deeper than the ridge flanks and bears numerous vol- canic mounds (Fig. 7a). During the AUV mission a 0.08ΔNTU turbid- ity anomaly was observed near 19°20.82′S/11°56.4′W in 2470m wa- ter depth (Fig. 7a–c) and an ORP anomaly of−20 mV was observed at 19°19.8′S/11°56.52′W in 2585m water depth, approximately 1.2km north of the turbidity anomaly. No turbidity or ORP anomalies were detected at tow-yo station 102 (∼10km south of the AUV ORP anom- aly) and CTD cast 103 (∼6km north of the AUV ORP anomaly). How
ever, at both sites theδ3He values exceeds the oceanographic back- ground with the highest value of 22.8% occurring at 2420m water depth at station 102 (Fig. 7d).
Most of the anomalies can be explained by the presence of a single hydrothermal field and predominantly southwards directed currents in the area. The vent field's potential location is near the maximum ORP anomaly, with the neutrally buoyant plume spreading at water depth between 2400 and 2600m, where the maxima in turbidity andδ3He oc- cur. Backgroundδ3He values in the 2400–2600m depth interval at sta- tion 103 (Fig. 7d) support the hypothesis that the plume is mainly dis- persed to the south and the minorδ3He anomaly below 2700m depth at this site may indicate another hydrothermal plume.
5.3.6. MAR 23° S
The 22°54′S - 24°24′S segment was surveyed by five vertical CTD casts, one tow-yo and one long-range AUV dive, which zigzagged across the axial valley from north to south (Fig. 8a). A plume was discovered near the start of the AUV mission (Fig. 8a). The ridge axis in this region is defined by the (to date) southernmost known oceanic core complex (OCC) on the Mid-Atlantic Ridge. This OCC exhibits typical ridge-per- pendicular corrugations and measures ∼16km along strike. The OCC rises high above the surrounding axial valley floor and large rider blocks (or volcanic ridges) sitting on top, mostly on its northern part (Fig. 8a).
The strongest ORP signal was detected on top of the detachment fault surface, about 1.5km east of the hanging-wall cut-off and in proximity to a topographic feature, possibly a rider block or volcanic ridge (Fig.
8b). Tow-yo station 70 was towed in a W→E direction and the MAPR data revealed a particle plume between 2500 and 2700m depth (Fig.
8e) that is coincident with ORP anomalies of up to−61 mV near the western end of the tow-yo track (near 23°44.68′S/13°23.59′W) indicat- ing the location of the vent field which is∼6kmE off the ridge axis (Fig. 8a and b). Water samples collected∼1km east of the strongest ORP anomaly show highδ3He values up to 42.4% within the particle plume (bottles 5,6,8 in Fig. 8f).
5.3.7. MAR 25° S
The 24°56′S–25°36′S segment was investigated by two vertical CTD casts (52, 56) and tow-yo station 54 above the generally smooth-topped axial high at the center of the segment (Fig. 9a). ORP anomalies up to
−31 mV were detected in the first 100m above the seafloor, near the start of the tow-yo (around 25°20.10′S/13° 37.83′W; Fig. 9b and c) in- dicating the potential vent site location. A weak increase in turbidity rising∼220m above the seafloor was detected∼1km north of the ORP anomalies (Fig. 9c). No turbidity or ORP anomalies were detected on the W→E trending portion of the tow-yo cast and theδ3He values from the western end of the tow-yo station, did not exceed the oceanic back- ground (Fig. 9d). Since the water samples stem from distances further than 4km from the ORP signal, it cannot be ruled out that this vent site discharges minor amounts of3He.
5.3.8. Merian Vent Field (26°S)
The 25°42′S – 26°36′S segment was investigated by three verti- cal CTD casts, one tow-yo and one AUV dive (Fig. 10). A turbidity plume rising ∼280m above the seafloor and strong ORP anomalies were discovered during tow-yo 48 traversing the axial high at 26°S of which the shallowest part is cross-cut by a series of ridge-parallel fault scarps (Fig. 10a, c). The plume discovery motivated a dedicated AUV mission of densely spaced survey lines flown at 50m altitude above the axial high (Fig. 10a and b). The AUV and tow-yo turbidity data agree in the location of the densest particle cloud, above the center of the axial high (Fig. 10b and c). The AUV detected an ORP anom- aly ofΔE =−19 mV, coincident with a +0.05 °C temperature spike, at 26°0.99′S/13°51.17′W originating from the nearby Merian Vent Field, discovered during the MSM-25 cruise (green circle in Fig. 10c; Devey
UNCORRECTED
PROOF
and cruise-participants, 2013). Another ORP anomaly of ΔEh =−43 mV, paralleled by a +0.03 °C temperature anomaly, was detected at 26°2.71′S/13°50.88′W (marked as Site II in Fig. 10a–c) that is not accompanied by a particle plume.
Water samples collected during tow-yo 48 yield aδ3He maximum of 52.2% in the center of the particle plume (bottle number 7; Fig. 10c and d). Water samples from station 51 (Fig. 10a, e) show increasedδ3He val- ues of up to 16.0% at 3815m depth (∼20m above the seafloor) which are likely unrelated to the plume above the axial high and suggest an- other undiscovered vent at the segment's southern end. Near-bottom current velocities above the axial high average around 12cms−1, with directions between NW and SW (Fig. 10c). Predicted barotropic tidal currents average around 5cms−1and their directions evolve from NW to S over the course of the two-yo station (Fig. 10c) suggesting that bot- tom currents above the axial high are not fully in phase with barotropic tides and a residual flow of westerly direction prevails.
The identified ORP anomalies suggest there is one futher active hy- drothermal field on the axial high besides the Merian Vent Field (Site II;
Fig. 10a–c), following the definition of Baker et al. (2016) who consider venting sites separated more than 1km as individual vent fields. The dense particle plume above axial high is likely created by the Merian Vent Field and disperesed by the W directed residual bottom currents.
The absence of turbidity plumes above venting sites II and III could ei- ther be attributed to sparse sampling (flying at 50m altitude, the AUV might have passed below such plumes) or a different, particle-poor type of venting.
5.3.9. MAR 2640′S–27°50′S
In the 26°40′S–27′50°S region was investigated by one AUV dive and four vertical CTD casts (Fig. 11a). The AUV detected two ORP anomalies at 27° 8.86‘S/13°28.52‘W (ΔE=−10mV) and at 27°
47.62‘S/13°22.38‘W (ΔE=−30mV). The northern anomaly is accom- panied by a 0.03ΔNTU turbidity increase (Fig. 11b). None of the wa- ter samples collected along the AUV track showed increased3He con- centrations (Fig. 11d). Three water samples collected at station 42 (at 26°42.58’S/13°36.59′W) in water depths of 3250–3350m yield δ3He values of 16.8–18.0%. This3He plume did not coincide with any turbid- ity or ORP anomalies but has a considerable rise height of∼500m above the seafloor and suggests active hydrothermal venting in the vicinity of station 42.
5.3.10. MAR 30°50′S
Vertical CTD 19 station was placed at the center of the ridge seg- ment between 30°38′S and 31°13′S (Fig. 12a). One water sample at 2809m depth yielded aδ3He value of 12.8% and the MAPR detected an ORP anomaly between 2805 and 2940m depth, i.e.∼400m above the seafloor (Fig. 12b) but no coincident turbidity anomaly was detected.
Although weak, we infer our findings give evidence for hydrothermal activity in the vicinity of station 19.
5.3.11. MAR 31°40′S
The 30°15′S - 32°5′S segment was investigated by one long-range AUV dive and five vertical CTD casts (Fig. 14a). A turbidity anomaly of 0.007ΔNTU was found at 31°44.26′S/13°22.63′W in 2890m water depth above an axial high at the segments center (Fig. 13b and c). Since no ORP data is available from this AUV dive a coincident ORP anom- aly cannot be confirmed. Water samples collected at station 14 (∼3km south of the turbidity anomaly) did not show an increase in3He but a slightly increasedδ3He value of 10.7% was found at 3955m depth at station 16 (Fig. 13d) approximately 23km north of the AUV tur- bidity anomaly. While it seems likely that there is hydrothermal activ- ity at this ridge segment, we can only speculate about the vent loca- tion and whether the3He signal at station 16 and the turbidity plume
above the segment center have a common source or not. The increased δ3He value of 11.4% at 3660m depth (70m above the seafloor) sam- pled at station 12 near the southern end of the segment seems too deep to originate from within the segment and may stem from an unknown source in the fracture zone (Fig. 13a, d).
5.3.12. MAR 33°S
The most southerly segment investigated (32°30′S-33°30′S) was sur- veyed by a long-range AUV mission, one tow-yo (6) and three verti- cal CTD casts (3, 5, 7; Fig. 14a). The segment center is characterized by an axial volcanic high at which the seafloor is covered by numer- ous mounds of variable size (Fig. 15a and b). During the AUV mission two distinct ORP anomalies were detected at 32°58.06′S/14°27.10′W (ΔE=−72mV; Site I) and at 32°59.68′S/14°26.55′W (ΔEh=−32mV;
Site II) that are marked by stars in Fig. 14a and b. The ORP anomaly at Site I consists of three consecutive pulses within a strike distance of 650 m and the AUV CTD data revealed a +0.03 °C spike in tempera- ture coincident with the strongest ORP anomaly (Fig. 14c). Sites I and II are associated with turbidity plumes and additional turbidity anom- alies were found∼2km and∼6km north of Site I (Fig. 14c). No tur- bidity or ORP signal was detected along tow-yo 6 (Fig. 14a) but aδ3He value of 18.2% was found at 2367m water depth near the northern end of tow-yo 6 (Fig. 14e). The three repeated ORP pluses and the tempera- ture spike at Site I indicate a field of multiple active chimneys. The ORP, temperature and turbidity anomalies at Site II indicate another active vent field.
5.4. Relation to vent field frequency along the global MORs
Our survey covered approximately 2100km of the SMAR axis (ex- cluding transforms) along which hydrothermal plumes were found at ten ridge segments, providing the location of 14 new and three pre- viously known hydrothermal vent fields. A summary of all confirmed and inferred sites is given in Table 1, including the previously known Zouyu-1 and Rainbow Bay vent fields (Tao et al., 2011, 2017) that have not been visited during the MSM-25 cruise. We count a total number of 19 vent fields in the 13°-33°S region implying an average vent field in- cidence of 0.9 vent fields per 100km ridge axis. With spreading rates of 32–34mm yr−1in this region the inferred frequency matches well with the latest global compilations of vent field incidence (Beaulieu et al., 2015; Hannington et al., 2011, Fig. 15).
The actual number of vent fields in the 13°–33° region may even be higher, assuming our survey has missed odd sites. Sampling even in close proximity to active vents does not always return a plume signal, as demonstrated in the case of station 113at∼1.5km distance to the Deyin-1 vent site where no plume signal was found by our vertical CTD cast (Fig. 5). Thus, our number of inferred vent fields may be consid- ered a minimum estimate. Since the AUV dives and CTD stations fo- cused on the center of the axial valley, we would also have not detected any off-axis systems, with the exception of the 23°S segment, where the off-axis core complex was specifically targeted with the AUV.
6. Conclusions
Knowing the seafloor location of active venting sites is a crucial prerequisite for the later planning of detailed studies on hydrother- mal activity, biogeographical distribution of endemic vent fauna, and of seafloor massive sulfide deposits along MORs. We present the results of an over 2100km-long systematic plume survey in the 13°S-33°S re- gion of the SMAR, a previously virtually unexplored ridge region. Dur- ing expedition MSM-25 we identified previously unknown plumes above ten ridge segments and confirmed three previously known hydrothermal plumes using a combination of three independent hydrothermal tracers: