R E S E A R C H A R T I C L E Open Access
Widespread introgression in deep-sea hydrothermal vent mussels
Corinna Breusing1,2* , Robert C. Vrijenhoek2and Thorsten B. H. Reusch1
Abstract
Background:The analysis of hybrid zones is crucial for gaining a mechanistic understanding of the process of speciation and the maintenance of species boundaries. Hybrid zones have been studied intensively in terrestrial and shallow-water ecosystems, but very little is known about their occurrence in deep-sea environments. Here we used diagnostic, single nucleotide polymorphisms in combination with one mitochondrial gene to re-examine prior hypotheses about a contact zone involving deep-sea hydrothermal vent mussels,Bathymodiolus azoricusandB.
puteoserpentis, living along the Mid-Atlantic Ridge.
Results:Admixture was found to be asymmetric with respect to the parental species, while introgression was more widespread geographically than previously recognized. Admixed individuals with a majority of alleles from one of the parental species were most frequent in habitats corresponding to that species. Mussels found at a geographically intermediate vent field constituted a genetically mixed population that showed no evidence for hybrid incompatibilities, a finding that does not support a previously inferred tension zone model.
Conclusions:Our analyses indicate thatB. azoricusandB. puteoserpentishybridize introgressively across a large geographic area without evidence for general hybrid incompatibilities. While these findings shed new light onto the genetic structure of this hybrid zone, many aspects about its nature still remain obscure. Our study sets a baseline for further research that should primarily focus on the acquisition of additional mussel samples and environmental data, a detailed exploration of vent areas and hidden populations as well as genomic analyses in both mussel hosts and their bacterial symbionts.
Keywords:Bathymodiolus, Introgressive hybridization, Hybrid zone models, Single nucleotide polymorphisms
Background
Hybrid zones, regions where genetically distinct species interbreed to form genotypes of mixed origin, have achieved considerable interest in evolutionary research.
Such zones of interbreeding can provide significant in- sights into the mechanisms that underlie speciation and the integrity of species [1, 2]. Interspecific hybridization in animals has traditionally been considered as a mechan- ism causing genetic swamping and extinction of species (reverse speciation) [3–7], but increasing evidence stresses its importance as a process that promotes adaptive vari- ation and the evolution of biodiversity [1, 2, 4, 8]. These destructive and creative mechanisms represent relatively
extreme outcomes of hybridization, which typically acts as selective filter to between-species gene flow, thereby lead- ing to complex pictures of differential introgression across the genome [9]. While selectively neutral loci will intro- gress freely across the hybrid zone, loci involved in repro- ductive isolation or local adaptation are likely to show restricted introgression. The identification of such barrier genes is crucial to understand the genomic architecture of species boundaries. Depending on the spatial scale as well as the environmental, historical and geographic context, hybrid zones vary in their genetic structures. In many cases interspecific mating is spatially confined to a narrow region that is bordered by pure populations of the interbreeding lineages. Such tension zones [3] are maintained by a dy- namic equilibrium between immigration of parental spe- cies and selection against hybrids, a scenario that results in concordant step clines in allelic frequencies. If the distribu- tions of the hybridizing taxa are discontinuous, hybrid
* Correspondence:cbreusing@mbari.org
1GEOMAR Helmholtz Centre for Ocean Research Kiel, Evolutionary Ecology of Marine Fishes, Düsternbrooker Weg 20, 24105 Kiel, Germany
2Monterey Bay Aquarium Research Institute, 7700 Sandholdt Road, Moss Landing, CA 95039, USA
© The Author(s). 2017Open AccessThis article is distributed under the terms of the Creative Commons Attribution 4.0 International License (http://creativecommons.org/licenses/by/4.0/), which permits unrestricted use, distribution, and reproduction in any medium, provided you give appropriate credit to the original author(s) and the source, provide a link to the Creative Commons license, and indicate if changes were made. The Creative Commons Public Domain Dedication waiver (http://creativecommons.org/publicdomain/zero/1.0/) applies to the data made available in this article, unless otherwise stated.
zones are commonly composed of multiple population patches that represent individual local contact areas be- tween the hybridizing taxa [9]. In contrast to tension zones, patchy hybrid zones often extend across large geographic regions and either reflect colonization history (mottled hy- brid zones) or ecological segregation (mosaic hybrid zones) of the interbreeding species. Under this scenario admixed individuals comprise a diverse “swarm” of genotypes that can facilitate local adaptation and potentially lead to hybrid speciation [1].
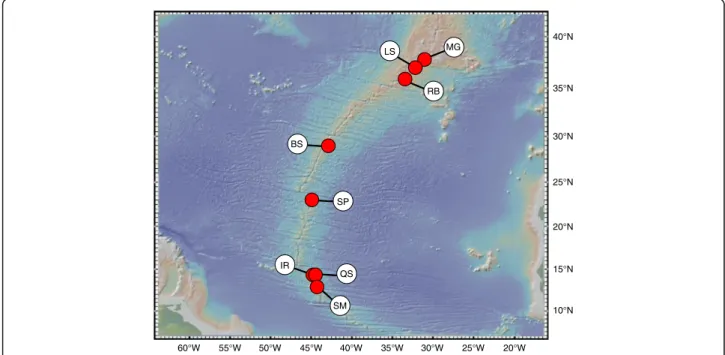
Although most hybrid zone research has focused on terrestrial, freshwater and coastal ecosystems, three examples of hybridization and intergradation were de- scribed from deep-sea hydrothermal vent environments [10–13]. Unlike the open ocean, vent habitats are geo- morphologically constrained and distributed relatively linearly along the global mid-ocean ridge system, spor- adically in back-arc spreading centres or on volcanically active seamounts [14]. Offsets in the axis of mid-ocean ridges and the isolated nature of back-arc basins can restrict the flow of deep-water currents disrupting the dispersal of vent larvae. This, in turn, may produce vari- ous degrees of geographic subdivision in vent animals [15, 16]. These circumstances are likely to influence the opportunities and outcomes of hybridization in deep-sea vent species. Morphologically and genetically divergent bathymodiolin mussels native to the Mid-Atlantic Ridge (MAR) (Fig. 1) provided the first example of a hybrid zone at deep-sea hydrothermal vents [10, 11, 17–19].
Bathymodiolus azoricus inhabits shallower vents (813–
2251 m) clustered near the Azorean Triple Junction [18], whereas Bathymodiolus puteoserpentis inhabits deeper vents (2432–3480 m) distributed along the central MAR [17, 18]. These mussels hybridize at the latitudinally inter- mediate Broken Spur (BS) vent field that does not appear to be particularly suitable for either species [10, 11]. Else- where the two ecologically similar parental species are remarkably abundant. They both depend nutritionally on chemosynthetic gammaproteobacterial endosymbionts that are capable of oxidizing methane, hydrogen sulphide, and hydrogen present in the vent effluents [20]. They are gono- choristic with periodic, external fertilization and long-lived planktotrophic larvae, although instances of protandric hermaphroditism have been reported in B. azoricus [21–24]. Spawning of B. azoricus takes place between January and March [24], but the reproductive season of B. puteoserpentis is unknown.
Won et al. [11] found that mussels from the BS hybrid zone exhibited significant cytonuclear disequilibrium be- tween mitochondrial NADH dehydrogenase subunit 4 (ND4) haplotypes and leucine-aminopeptidase (Lap) allo- zymes. Parental genotypes greatly surpassed the frequency of recombinants, indicating limited reproduction and self- recruitment at the environmentally stressful BS locality.
Concordant step-clines across a number of allozyme loci suggested that introgression into the parental ranges was limited. Together these patterns were interpreted as evi- dence for a tension zone maintained primarily by immigra- tion of parental species and possibly hybrid unfitness.
Faure et al. [25] developed a number of nuclear DNA
40°N
35°N
30°N
25°N
20°N
15°N
10°N
W
° 5
2 20°W W
° 5
3 30°W W
° 5
4 40°W W
° 5
5 50°W 60°W
LS MG
RB
BS
SP
IR
QS
SM
Fig. 1Sampling area ofBathymodiolusmussels along the Mid-Atlantic Ridge. MG = Menez Gwen, LS = Lucky Strike, RB = Rainbow, BS = Broken Spur, SP = Snake Pit, IR = Irina, QS = Quest, SM = Semenov. Adapted from [28] with permission from ELSEVIER
markers to investigate the origin of the hybrid zone. They concluded thatB. azoricusandB. puteoserpentissplit as recently as 0.76 million years ago. The coalescent history of intragenic recombination between semi-diagnostic GF1B alleles led these authors to surmise that secondary intergradation probably followed a brief period of allopatric divergence. Although biogeography can be useful in the in- terpretation of genetic patterns [26], a lack of multiple, diagnostic, nuclear markers has so far limited researchers’
abilities to identify the nature of the hybrids and to assess the accuracy of the tension zone model due to the difficulty of distinguishing introgressive hybridization from incom- plete lineage sorting (retention of ancestral polymor- phisms)—a common problem involving species that have split very recently or have retained very large effective population sizes [27].
To remedy these limitations, the present study builds upon a recent development. Breusing et al. [28] designed a panel of single nucleotide polymorphisms (SNPs) to study gene flow across the known ranges of B. azoricus and B. puteoserpentis. For the present study, we used a diagnostic subset of these SNP markers and the mito- chondrial ND4 gene (i) to identify the geographical range of hybridization along the MAR axis, (ii) to thor- oughly determine different classes of hybrids, and (iii) to find evidence for or against the tension zone model.
Methods
Sample collection and molecular analyses
Mussel samples were obtained from eight localities (Fig. 1) during research expeditions conducted between 1997 and 2013 along the northern MAR (37°50.7′N to 13°30.8′N). For geographic coordinates, bathymetric depths, and sample sizes see Additional file 1: Table S1.
To accurately assess hybridization between B. azoricus and B. puteoserpentis, we used a subset of 18 species- diagnostic markers from a starting panel that included 90 SNPs [28]. Loci were defined as diagnostic, if the two SNP alleles were reciprocally abundant with≥95% in the most distant geographical populations MG (B. azoricus) and SM (B. puteoserpentis) (Additional file 2: Tables S2 and S3). In addition to the 18 SNP markers, we included the mitochondrialND4locus that was shown to be diag- nostic for the two lineages [10, 11]. Limiting our ana- lyses to highly differentiated markers allowed us to distinguish incomplete lineage sorting from introgres- sion [27] and to obtain reliable estimates of hybrid in- dexes to categorize genotypes into hybrid classes [29].
ND4 sequences, haplotype data and SNP genotypes for all mussel specimens were taken from Breusing et al.
[28], where full details about the molecular analyses are available. Further information about individual geno- types, primer sequences and putative gene functions are given in Additional file 2: Tables S3 and S4.
Simulation of artificial hybrid populations
We applied STRUCTURE v2.3.4 [30], INTROGRESS (R v3.2.0) [31–33] and NEWHYBRIDS v1.1b [34] to iden- tify the degree of admixture and introgression across the deep-sea hybrid zone. To assess the power of these population genetic programs to resolve hybridization, we modelled hybrid and pure genotypes in HYBRIDLAB v1.1 [35], using the MG and SM samples as parental populations. Simulations were performed as described in the manual with sample sizes of 40 individuals per popu- lation. Model runs for STRUCTURE, INTROGRESS and NEWHYBRIDS were done as for the real samples de- scribed in “Population structure and admixture in the real data set”.
For STRUCTURE, we identified the highest and lowest average q-values in the simulated parental populations of B. azoricus (0.05) and B. puteoserpentis (0.92) to set these as thresholds for hybrid identification. As STRUC- TURE q-values do not consider interspecific heterozy- gosities and are therefore not suitable for distinguishing between different hybrid genotypes, we did not attempt to further classify potential hybrid individuals with this program. For INTROGRESS, hybrid categorizations es- sentially followed the classification scheme by Milne &
Abott [36], considering that some hybrid types cannot be distinguished due to identical ranges of hybrid indices (h) and interspecific heterozygosities (IH). Reference values of hand IHwere determined for artificial hybrid and parental types and subsequently adjusted as given in Table 1. For NEWHYBRIDS, we defined 12 genotype cat- egories (Table 1) to allow detection of backcross hybrids and distinguish those from pure individuals. The mean genotype probability across five replicate runs was used to assign individuals to the most appropriate hybrid class. As different backcross categories could not be distinguished from each other (see above) and to make the NEWHY- BRIDS output comparable to the other programs, back- cross hybrid categories for each species were lumped into one class and their probabilities were summarized.
Population structure and admixture in the real data set STRUCTURE was used to determine population genetic structuring and patterns of hybridization between B.
azoricus and B. puteoserpentis along the MAR. Simula- tions based on the SNP data were run according to the admixture model with correlated allele frequencies [37], testing up to 10 genetic clusters K with 10 replicates.
Model runs involved 107iterations after a de-memorization period of 106. For identifying the most likely value ofKwe applied theΔKcorrection as described in Evanno et al. [38]
and inspected bar plots for biologically reasonable structur- ing [39]. STRUCTURE graphics were produced with“bar_- plotter.rb” (http://evolution.unibas.ch/salzburger/software.
htm). Haplotype networks for population structure analyses
of the mitochondrial ND4 locus were created with NET- WORK v4.6.1.2 (www.fluxus-engineering.com; [40–42]) as in Breusing et al. [43]. To assess the level of reproductive isolation and infer evolutionary processes structuring the hybrid zone we calculated Hardy-Weinberg equilibrium (HWE) and linkage disequilibrium (LD) in GENEPOP v4.3 [44] using 10,000 dememorization steps, a batch length of 10,000 and a batch number of 1000. HWE tests were done with the enumeration method. Corrections for multiple comparisons (α= 0.05) were performed with the Benjamini-Yekutieli False Discovery Rate (BY FDR) pro- cedure [45], which has been found to produce biologically more meaningful results than comparable methods [46].
To estimate individual hybrid indices h and interspe- cific heterozygosities IHbased on genotypic information at the 18 diagnostic SNP markers, we used the max- imum likelihood approach implemented in the R pack- age INTROGRESS, defining MG and SM as parental populations ofB. azoricusandB. puteoserpentis, respect- ively. To support the findings of the INTROGRESS program, we performed additional simulations in NEW- HYBRIDS. Runs were replicated five times with different seed values, using 100,000 iterations of the MCMC chain and a burnin of 10,000.
Results
Detection of hybrids and genotype classes in the artificial population data set
Simulations of hybrid categories confirmed that different Fxgeneration hybrids and parental genotypes were easily distinguishable from each other using the 18 diagnostic SNP markers, as all programs showed a very high as- signment certainty for individuals from these classes (Additional file 3: Table S5; Additional file 4: Figure S1).
Although STRUCTURE could not be used to distinguish various hybrid generations, it assigned 100% of the F-type individuals correctly as hybrids. Likewise, all B. azoricus andB. puteoserpentisindividuals were identified accurately by this program. INTROGRESS and NEWHYBRIDS were applied to further differentiate between distinct hybrid ge- notypes. While INTROGRESS seemed to group all F1, F2–4 and pure individuals into the appropriate categories, NEWHYBRIDS showed a misidentification rate of≤5% for Fxgeneration hybrids and≤10% for parental species. Prob- abilities for correct assignments of both parental and Fx
genotypes were generally high (B. puteoserpentis: 0.639;B.
azoricus: 0.690; F1: 0.997; F2–4: 0.964−0.984).
By contrast, the identification of backcross genotypes was less reliable, as many individuals were misclassified as either F2–4hybrids (BC1, BC2) or pure species (BC3, BC4).
STRUCTURE categorized up to 87.5% incorrectly as par- ental genotypes given that q-values largely overlapped be- tween these classes (Additional file 5: Figure S2). Similarly, INTROGRESS misidentified up to 77.5% as F2–4hybrids or parental species. NEWHYBRIDS assignments appeared to be more accurate and became only very uncertain for later generation backcrosses, where between 25 and 40% were wrongly assigned as pure individuals (Additional file 3:
Table S5; Additional file 4: Figure S1). Probabilities for the correct classification were in a similar range as for the other genotype categories (0.772−0.991). Since (backcross) hybrids were much more frequently misidentified as paren- tal species than vice versa, the HYBRIDLAB simulations suggest that the amount of genetic admixture in our real population data set could be significantly underestimated.
Unfortunately, such wrong assignments might be difficult to detect, as the NEWHYBRIDS probabilities for mis- identified individuals were usually only slightly lower Table 1Genotype categories as used by the NEWHYBRIDS and INROGRESS programs based on simulations in HYBRIDLAB
Genotype category NEWHYBRIDS INTROGRESS
AA Aa aA aa IH h
B. azoricus 1.00000 0.00000 0.00000 0.00000 0.00–0.11 0.00–0.03
BC1azoricus 0.50000 0.25000 0.25000 0.00000 0.00–0.88 0.04–0.27
BC2azoricus 0.75000 0.12500 0.12500 0.00000
BC3azoricus 0.87500 0.06250 0.06250 0.00000
BC4azoricus 0.93750 0.03125 0.03125 0.00000
F1 0.00000 0.50000 0.50000 0.00000 0.89–1.00 0.45–0.53
F2–4 0.25000 0.25000 0.25000 0.25000 0.00–0.88 0.28–0.79
BC1puteoserpentis 0.00000 0.25000 0.25000 0.50000 0.00–0.88 0.80–0.93
BC2puteoserpentis 0.00000 0.12500 0.12500 0.75000
BC3puteoserpentis 0.00000 0.06250 0.06250 0.87500
BC4puteoserpentis 0.00000 0.03125 0.03125 0.93750
B. puteoserpentis 0.00000 0.00000 0.00000 1.00000 0.00–0.17 0.94–1.00
For NEWHYBRIDS categories are based on genotype frequency proportions, whereAdenotes theB. azoricus-specific allele andadenotes theB. puteoserpentis-specific allele. For INTROGRESS categories are based on interspecific heterozygosities (IH) and hybrid indices (h)
than for correct classifications (Additional file 3:
Table S5; Additional file 4: Figure S1).
Genetic structure and extent of hybridization in the real population data set
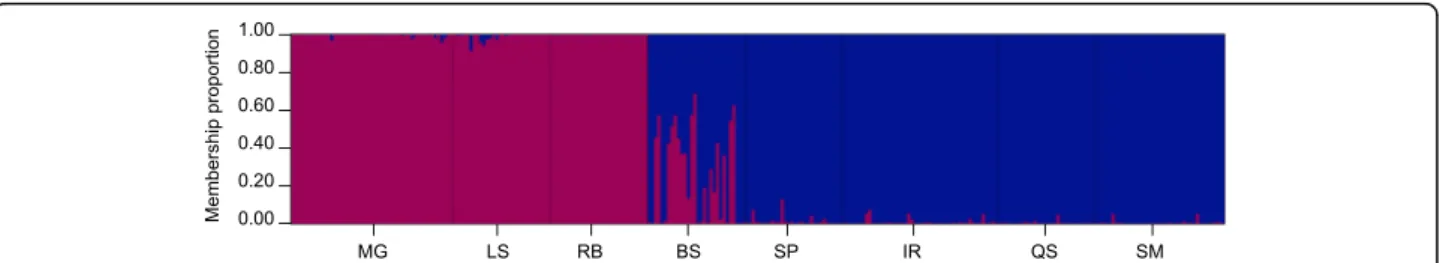
The STRUCTURE analyses confirmed the presence of two genetic groups corresponding with the recognized species,B. azoricus andB. puteoserpentis(Fig. 2). At the northern vents MG, LS and RB populations consisted exclusively of parental B. azoricus genotypes (MG, RB) or comprised a mixture of mostly pureB. azoricusand a low amount of hybrids (LS; 6.7%). By contrast, at the southern vents SP, IR, QS and SM populations contained onlyB. puteoserpentisindividuals (IR, QS, SM) or were a mixture of pureB. puteoserpentis and a few hybrid mus- sels (SP; 3.3%). At the intermediate BS locality 60% of mussels seemed to be hybrids, whereas the rest of the individuals were classified as pureB. puteoserpentis.
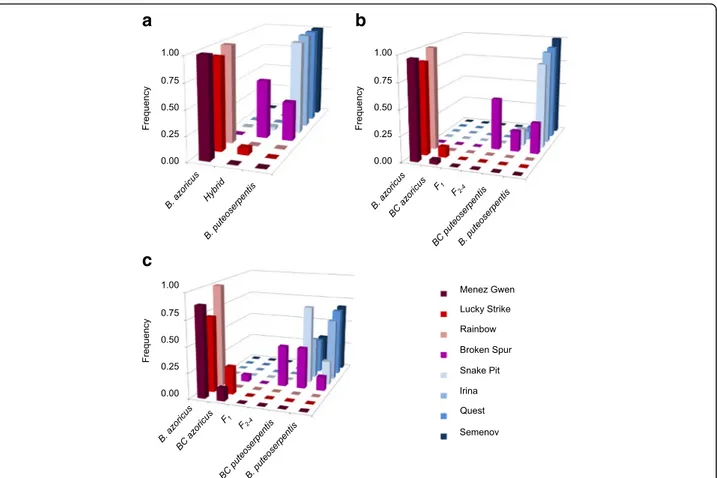
To further resolve the extent of introgression and the nature of the hybrids we used maximum likelihood and Bayesian inference methods in the programs INTRO- GRESS and NEWHYBRIDS. Although these analyses confirmed the asymmetric genotype distribution pattern that was already indicated by the STRUCTURE simula- tions, they identified additional hybrid individuals at various locations of the MAR, implying a more wide- spread occurrence of introgression (Fig. 3; Table 2).
While backcrosses to B. azoricus were detected at MG (4.0−12.0%) and LS (10.0−26.7%), backcrosses to B.
puteoserpentis were detected at SP (16.7−76.7%), IR (8.3−39.6%), QS (6.7−33.3%) and SM (0.0−32.5%). At the central vent BS 40−50% of the individuals were cat- egorized as multi-generation hybrids (F2 to F4) with a similar allelic contribution from both parental species (Fig. 3; Table 2). The remaining individuals were classi- fied as pure B. puteoserpentis (13.3−30.0%) and back- crosses thereof (20.0−40.0%), whereas no B. azoricus were found at this locality. In contrast to the INTRO- GRESS program, NEWHYBRIDS identified a few back- crosses toB. azoricus(6.7%) at BS, although these might be misclassified F-generation hybrids, as indicated by results
from the artificial population data set (Additional file 3:
Table S5). F1hybrids were completely absent from all loca- tions. In general, NEWHYBRIDS assigned many more individuals as hybrids than did any of the other programs, while STRUCTURE was most conservative and identified the majority of individuals as parental species (Table 2).
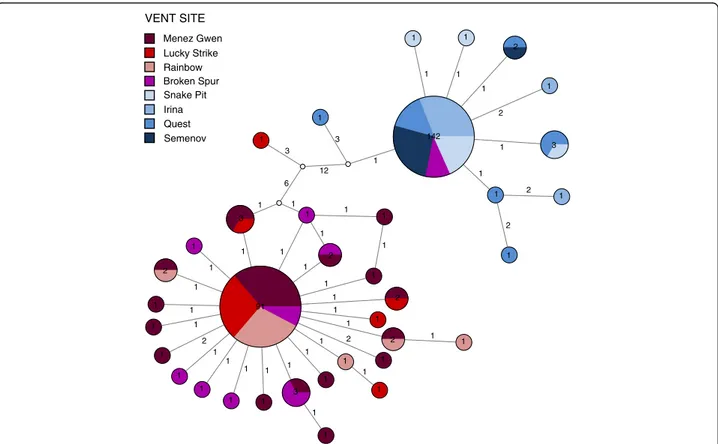
Each geographic area was characterized by one major and several minorND4 haplotypes that formed lineage- specific clades differing by at least 12 mutations (Fig. 4).
In contrast to the other localities, the BS population contained haplotypes from both lineages in roughly equal proportions (Fig. 4).
Hardy-Weinberg equilibrium and linkage disequilibrium Following corrections for multiple tests (BY FDR α= 0.0103), no significant deviations from HWE were found in any of the sampled demes. By contrast, tests for LD (BY FDR α= 0.0072) revealed 48 significant associations of non-homologous alleles, mostly (85.4%) involving the BS sample (Additional file 6: Table S6).
Discussion
Studies of interspecific hybridization in animals have a long-standing history in terrestrial, coastal and shallow- water research, but virtually nothing is known about contact zones in deep-sea environments. We used 18 diagnostic SNP markers and the mitochondrial ND4 gene to analyse the hybrid zone between the deep-sea musselsB. azoricus andB. puteoserpentis[10, 11]. With this panel of diagnostic markers we were able to reliably distinguish hybridization from incomplete lineage sort- ing and to estimate the extent of admixture in individ- uals from eight localities of the MAR. In contrast to former studies we found that evidence for introgression was widespread and not restricted to the geographically intermediate BS locality. Moreover, the frequency of hy- brids was much higher than described previously (30%
in [11] compared to at least 60% in this study). Gene flow occurred across the sampled geographic range from MG to SM, but in a highly asymmetric fashion. The population at BS consisted mostly of F2–4 generation
Fig. 2Inferred genetic structure for the eightBathymodiolussampling localities based on the 18 diagnostic SNP markers. The graph confirms the existence of two mussel species (B. azoricusinred,B. puteoserpentisinblue) that are interbreeding in an asymmetric way along the Mid-Atlantic Ridge, as shown by the presence of individuals (vertical lines) with mixed ancestry (q-values between 0.05 and 0.92). MG = Menez Gwen, LS = Lucky Strike, RB = Rainbow, BS = Broken Spur, SP = Snake Pit, IR = Irina, QS = Quest, SM = Semenov. Adapted from [28] with permission from ELSEVIER
hybrids with a minority of B. puteoserpentis-like geno- types, whereas noB. azoricus-like individuals were found.
By contrast, mussels at vent fields to the north of BS car- ried predominantly B. azoricus genotypes, while mussels in the south were predominantly B. puteoserpentis with declining proportions of backcross genotypes. No individ- uals that matched an F1genotype were detected at any lo- cality. Although different statistical approaches varied in their estimates of the number of hybrids at the investi- gated vent locations, even the most conservative program (STRUCTURE) detected admixed individuals outside the BS hybrid zone. As many backcross genotypes were often identified as pure species and as the use of diagnostic markers might underestimate the level of introgression [27], these observations indicate that gene flow is possibly more extensive than suggested by our analyses.
Different, mutually non-exclusive explanations could ac- count for the asymmetry in admixture patterns and the differential abundance of genotype classes among vent lo- cations. Bathymodiolus azoricus and B. puteoserpentis appear to segregate by depth along the MAR [10, 11].
Such differential depth associations could prevent the two species from meeting and forming hybrids in certain re- gions. Or, if dispersal into non-native ranges occurs and the two species differ in their bathymetric tolerances, indi- viduals with a high genomic proportion of only one parent might experience a selective disadvantage in depths that are characteristic for the other ancestral lineage. Both scenarios would agree with the differential fixation of B.
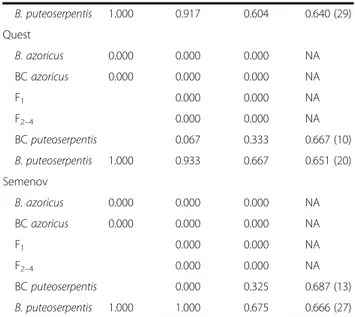
azoricus and B. puteoserpentis ND4 haplogroups in the Table 2Genotype frequencies in the eight sampled mussel
populations as inferred by STRUCTURE, INTROGRESS and NEWHYBRIDS
STRUCTURE INTROGRESS NEWHYBRIDS Frequency Frequency Frequency Probability
(N) Menez Gwen
B. azoricus 1.000 0.960 0.880 0.688 (44)
BCazoricus 0.000 0.040 0.120 0.741 (6)
F1 0.000 0.000 NA
F2–4 0.000 0.000 NA
BCputeoserpentis 0.000 0.000 NA
B. puteoserpentis 0.000 0.000 0.000 NA
Lucky Strike
B. azoricus 0.933 0.900 0.733 0.692 (22)
BCazoricus 0.067 0.100 0.267 0.794 (8)
F1 0.000 0.000 NA
F2–4 0.000 0.000 NA
BCputeoserpentis 0.000 0.000 NA
B. puteoserpentis 0.000 0.000 0.000 NA
Rainbow
B. azoricus 1.000 1.000 1.000 0.673 (30)
BCazoricus 0.000 0.000 0.000 NA
F1 0.000 0.000 NA
F2–4 0.000 0.000 NA
BCputeoserpentis 0.000 0.000 NA
B. puteoserpentis 0.000 0.000 0.000 NA
Broken Spur
B. azoricus 0.000 0.000 0.000 NA
BCazoricus 0.600 0.000 0.067 0.751 (2)
F1 0.000 0.000 NA
F2–4 0.500 0.400 0.966 (12)
BCputeoserpentis 0.200 0.400 0.814 (12)
B. puteoserpentis 0.400 0.300 0.133 0.639 (4)
Snake Pit
B. azoricus 0.000 0.000 0.000 NA
BCazoricus 0.033 0.000 0.000 NA
F1 0.000 0.000 NA
F2–4 0.000 0.000 NA
BCputeoserpentis 0.167 0.767 0.739 (23)
B. puteoserpentis 0.967 0.833 0.233 0.637 (7)
Irina
B. azoricus 0.000 0.000 0.000 NA
BCazoricus 0.000 0.000 0.000 NA
F1 0.000 0.000 NA
F2–4 0.000 0.000 NA
BCputeoserpentis 0.083 0.396 0.756 (19)
Table 2Genotype frequencies in the eight sampled mussel populations as inferred by STRUCTURE, INTROGRESS and NEWHYBRIDS(Continued)
B. puteoserpentis 1.000 0.917 0.604 0.640 (29)
Quest
B. azoricus 0.000 0.000 0.000 NA
BCazoricus 0.000 0.000 0.000 NA
F1 0.000 0.000 NA
F2–4 0.000 0.000 NA
BCputeoserpentis 0.067 0.333 0.667 (10)
B. puteoserpentis 1.000 0.933 0.667 0.651 (20)
Semenov
B. azoricus 0.000 0.000 0.000 NA
BCazoricus 0.000 0.000 0.000 NA
F1 0.000 0.000 NA
F2–4 0.000 0.000 NA
BCputeoserpentis 0.000 0.325 0.687 (13)
B. puteoserpentis 1.000 1.000 0.675 0.666 (27)
For the NEWHYBRIDS program the mean assignment probability (as proportion) of the chosen genotype category is given, where numbers in brackets give the sample sizes (N) that were used for averaging.NANot applicable
northern and southern regions due to geographic premat- ing barriers resulting in genetic drift or due to co- evolution of nuclear and cytoplasmic genomes [47, 48].
Alternatively, the apparent lack ofB. azoricusgenotypes at the intermediate BS locality could simply be a matter of sampling bias. Firstly, mussels are very difficult to distin- guish from surrounding rock at this vent field as they are coated with sulphide-enriched sediments [10]. Secondly, hydrothermal vents are highly dynamic habitats, where physico-chemical conditions can vary over small spatial scales, thereby providing opportunities for niche segrega- tion [49]. Consequently, it is possible that we failed to sample B. azoricusgenotypes, if they are relatively infre- quent or adapted to environmental patches at BS that we did not explore during our cruises. Likewise, this could be the case for F1 hybrids, which were surprisingly not observed in our sample. Given that we were able to detect B. azoricusat other localities and that the assignment cer- tainties for F1individuals were very high, it is improbable that our marker panel did not have enough power to detect these genotypes at BS. Therefore, it is justified to conclude that our results mirror a true pattern rather than a statistical artefact.
Another explanation for the observed patterns could be a southward movement of the contact zone from an
unknown, possibly now extinct vent locality north of BS.
Under this scenario, the early generation hybrids would be immigrants that reproduced locally. Both hybrid zone movements and potential sampling gaps would be con- sistent with the composition of thiotrophic symbionts in BS individuals [50]. Based on their analyses of internal transcribed spacer sequence variation, Won et al. [50]
observed either single infections by theB. puteoserpentis- specific bacterial strain or double infections by symbionts from both species. By contrast, no single infections by the B. azoricus-specific type were found. Mixed infections would only be possible, when both pure species co-occur at BS (sampling gap hypothesis) or when the first contact happened at another locality (hybrid zone movement hy- pothesis). Both hypotheses seem to be plausible for several reasons. On the one hand, secondary contact zones be- tween recognized species often emerge under environ- mental conditions to which parental genotypes are not well adapted [1, 51–53]. In such areas increased genetic diversity due to interspecific mating is likely to promote adaptability in hybrids and allow them to exploit these un- occupied niches [1]. As we did not sample environmental parameters from the investigated vent fields and were not targeting genes that might be involved in local adaptation, we cannot test this hypothesis with our current data set.
a
c
b
Fig. 3Frequencies of hybrid and parental genotypes in the real population data set based onaSTRUCTURE,bINTROGRESS andcNEWHYBRIDS
However, the dynamic nature of hydrothermal vents, depths differences and the association with different chemosynthetic symbiont strains could favour ecological differentiation between B. azoricus and B. puteoserpentis and lead to hybrid advantage in environmentally inter- mediate vent areas. Addressing this aspect will be helpful to identify the relative importance of selective forces and neutral processes, which can cause the same introgression and admixture patterns as natural selection [54].
On the other hand, a recent study by Breusing et al. [28]
indicates that hydrothermal vents or equivalent chemosyn- thetic habitats are much more abundant on the MAR than previously thought. In combining biophysical modelling approaches with molecular analyses the authors found that known mussel populations are connected over thousands of kilometres, although veliger larvae seldom reach suitable settlement sites that are more than 150 km away from their natal locality. These results are in agreement with current predictions from physical and geochemical mea- surements about the frequency of hydrothermal habitats on the MAR [55]. Thus, it is also possible that the centre of the hybrid zone originated at another, so far undetected vent locality close to BS.
Based on information from two loci (ND4 and Lap), Won et al. [11] reported that the parental genotypes
greatly exceeded hybrid genotypes in abundance. They hypothesized that the scarcity of mussels at BS results from a deficit of local reproduction and episodic recruit- ment of immigrants from the parental regions—a pattern that supported the tension zone model. The present multi- locus data cannot confirm this hypothesis, as most speci- mens at BS were of mixed ancestry and fell into a variety of hybrid genotype classes. Furthermore, no deviations from random mating expectations could be found, thereby providing no evidence for heterozygote deficiencies. How- ever, the finding of significant linkage disequilibria could imply that some nuclear incompatibilities exist in hybrids.
Alternatively, linkage disequilibria might be due to a recent origin of hybridization at BS, as it has been suggested that vents at this locality were lately re-activated and re- colonized after experiencing a period of dormancy [56, 57].
Conclusions
In contrast to previous research our study shows that hybridization between B. azoricus and B. puteoserpentis is introgressive and that gene flow extends across more vent localities than reported in former work. While our results give new insights into the genetic structure of this hybrid zone, several additional analyses need to be performed to test further hypotheses on its nature and
1
1 1 1
2
3
1 2 1
3 1
2 3
1 1
1
1
2
1
1 1
1
1
1 2
1 1
1 1
1
1
1
1 1
2
1 1
1 1 1
1
2
2 3
1 1
1 1
1 1
2 1
1
1 1
1 1
1 1
1 1
1
2 1
1
1
1
1 1
1 3
1 1 6
91
12
142
VENT SITE Menez Gwen Lucky Strike Rainbow Broken Spur Snake Pit Irina Quest Semenov
Fig. 4Haplotype network for the mitochondrialND4locus. Haplotypes are represented ascircles, where internal numbers indicate counts of the respective variant in the total data set and branch numbers show the mutation steps between haplotypes. Unknown variants are shown aswhite circles
evolutionary implications. Most importantly, it will be necessary to obtain new samples from the BS vent field and to thoroughly search surrounding areas for the ex- istence of other mussel populations. Metagenomic stud- ies of the composition and functional variation of both thiotrophic and methanotrophic symbionts might pro- vide critical informative data about the extent and type of ecological differentiation between parental species and hybrids. In addition, genome-wide scans could be used to design additional diagnostic markers, which—in combination with a standardized sampling design, mea- surements of environmental conditions and determination of phenotypic traits—would help to resolve the true de- gree of introgression and admixture along the MAR and the role of differential adaptation in this system. Such in- sights will be crucial for our general understanding of the role of hybridization in the evolution of deep-sea taxa.
Additional files
Additional file 1: Table S1.Bathymodiolussampling localities along the Mid-Atlantic Ridge. (DOCX 17 kb)
Additional file 2:Table S2.Frequencies of theB. azoricus-specific SNP allele in the eight sampled mussel populations;Table S3.SNP genotype andND4haplotype data for each individual of the 8 sampled localities. 1
= c54079_g1_i1, 2 = c59751_g2_i3, 3 = c12535_g1_i1, 4 = c36135_g1_i2, 5 = c40452_g1_i1, 6 = c61080_g8_i1, 7 = c62359_g8_i4, 8 = c23539_g1_i1, 9 = c34434_g1_i1, 10 = c41151_g1_i3, 11 = c58708_g7_i1, 12 = c55170_g1_i1, 13 = c47041_g1_i1, 14 = c29533_g1_i1, 15 = c61290_g11_i1, 16 =
c59181_g1_i1, 17 = c42562_g1_i1, 18 = c35975_g1_i1;Table S4.Fluidigm primer information (5′to 3′) and putative gene functions of the 18 SNP loci investigated in this study. ASP1 = SNP allele detected with allele-specific primer 1, ASP2 = SNP allele detected with allele-specific primer 2, SNP_SEQ = sequence of the amplified fragment containing the SNP, ASP1_SEQ = sequence of allele-specific primer 1, ASP2_SEQ = sequence of allele-specific primer 2, LSP_SEQ = sequence of locus-specific reverse primer, STA_SEQ = sequence of forward primer for specific target amplification, AMP_GC = proportional GC content, REFSEQ = blast annotation in the RefSeq protein database, SWISSPROT = blast annotation in the Swiss-Prot database, TREMBL = blast annotation in the TrEMBL database. (XLSX 37 kb)
Additional file 3: Table S5.Genotype frequencies in the HYBRIDLAB data set as inferred by STRUCTURE, INTROGRESS and NEWHYBRIDS. For the NEWHYBRIDS program the mean assignment probability (as proportion) of the chosen genotype category is given, where numbers in brackets give the sample sizes (N) that were used for averaging. (DOCX 28 kb) Additional file 4: Figure S1.Frequencies of hybrid and parental genotypes in the simulated population data set based on (a) STRUCTURE, (b) INTROGRESS and (c) NEWHYBRIDS. F1= first generation hybrid (P1x P2), F2= second generation hybrid (F1x F1), F3= third generation hybrid (F2x F2), F4= fourth generation hybrid (F3x F3), BC1= first generation backcross (F1x P), BC2= second generation backcross (BC1x P), BC3= third generation backcross (BC2x P), BC4= fourth generation backcross (BC3x P). (PDF 142 kb)
Additional file 5: Figure S2.Inferred genetic structure for the simulated data set for all populations based on the 18 diagnostic SNP markers. The graph confirms the existence of two mussel species that are interbreeding in an asymmetric way along the Mid-Atlantic Ridge, as shown by the presence of individuals (vertical lines) with mixed ancestry (q-values between 0.05 and 0.92). az =azoricus, pu =puteoserpentis, F1= first generation hybrid (P1x P2), F2= second generation hybrid (F1x F1), F3= third generation hybrid (F2x F2), F4= fourth generation hybrid (F3x F3), BC1= first generation backcross (F1x
P), BC2= second generation backcross (BC1x P), BC3= third generation backcross (BC2x P), BC4= fourth generation backcross (BC3x P). (PDF 36 kb) Additional file 6: Table S6.Significant cases of linkage disequilibrium between markers after BY FDR correction. IR = Irina, LS = Lucky Strike, QS = Quest, SP = Snake Pit, BS = Broken Spur, SM = Semenov. (DOCX 20 kb)
Abbreviations
BC:Backcross; BS: Broken Spur; BY FDR: Benjamini-Yekutieli False Discovery Rate;h: Hybrid index; HWE: Hardy-Weinberg equilibrium;IH: Interspecific heterozygosity; IR: Irina;Lap: Leucine aminopeptidase; LD: Linkage disequilibrium;
LS: Lucky Strike; MAR: Mid-Atlantic Ridge; MG: Menez Gwen;ND4: Mitochondrial NADH dehydrogenase subunit 4; QS: Quest; RB: Rainbow; SM: Semenov;
SNP: Single nucleotide polymorphism; SP: Snake Pit
Acknowledgements
We are particularly indebted to the crews and pilots of the research vessels and submersibles for their great technical support and sampling efforts that enabled us to perform this project. We further thank the Symbiosis Group at MPI Bremen, Sven Petersen and the Department of Oceanography and Fisheries at the University of the Azores for sharing mussel samples and Katrin Beining, Diana Gill as well as the Environmental Physiology Group at GEOMAR Helmholtz Centre for Ocean Research Kiel for their assistance in the lab. Many thanks also go to Shannon Johnson, Oscar Puebla, Heiko Stuckas, Eric Anderson and Carlos Garza for their valuable comments to the analyses of this study. AXIOS Review is gratefully acknowledged for supporting the review process of this article.
Funding
Funding was provided by C.B.’s Ph.D. studentship through the Helmholtz Research School for Ocean System Science and Technology (www.hosst.org) at GEOMAR Helmholtz Centre for Ocean Research Kiel (VH-KO-601) and Kiel University. Funding for the oceanographic expeditions was provided by grants from the US National Science Foundation (OCE9633131 and OCE9910799) to R.C.V.
Availability of data and materials
Sanger sequences for theND4locus are available in GenBank (accession numbers KU950834–KU951111). SNP genotype data and the input files for statistical analyses can be found in Pangaea under https://doi.pangaea.de/
10.1594/PANGAEA.859094 [58]. Individual genotype and haplotype data are also provided in Table S3 of the supplementary material.
Authors’contributions
C.B. developed the study design, performed the molecular lab work, bioinformatics and statistical analyses and wrote the paper. R.C.V. provided mussel samples, advised on the analyses and helped to write the manuscript. T.B.H.R. gave advice on the study concept and assisted with writing the paper. All authors agreed to this version of the manuscript.
Competing interests
The authors declare that they have no competing interests.
Consent for publication Not applicable.
Ethics approval
Permissions for sampling the species in international waters were not necessary. Sampling permissions for vents of the Azorean Triple Junction were obtained by theAtlantis03/3, BIOBAZ 2013 andMeteor82/3 cruises.
Received: 7 November 2016 Accepted: 21 December 2016
References
1. Seehausen O. Hybridization and adaptive radiation. Trends Ecol Evol.
2004;19:198–207.
2. Mallet J. Hybridization as an invasion of the genome. Trends Ecol Evol.
2005;20:229–37.
3. Barton NH, Hewitt GM. Analysis of hybrid zones. Annu Rev Ecol Syst.
1985;16:113–48.
4. Arnold ML. Natural hybridization as an evolutionary process. Annu Rev Ecol Syst. 1992;23:237–61.
5. Rhymer JM, Simberloff D. Extinction by hybridization and introgression.
Annu Rev Ecol Syst. 1996;27:83–109.
6. Allendorf FW, Leary RF, Spruell P, Wenburg JK. The problems with hybrids:
setting conservation guidelines. Trends Ecol Evol. 2001;16:613–22.
7. Seehausen O, Takimoto G, Roy D, Jokela J. Speciation reversal and biodiversity dynamics with hybridization in changing environments. Mol Ecol. 2008;17:30–44.
8. Abbott R, Albach D, Ansell S, Arntzen JW, Baird SJE, Bierne N, Boughman J, Brelsford A, Buerkle CA, Buggs R, et al. Hybridization and speciation. J Evol Biol. 2013;26:229–46.
9. Harrison RG, Larson EL. Heterogeneous genome divergence, differential introgression, and the origin and structure of hybrid zones. Mol Ecol.
2016;25:2454–66.
10. O’Mullan GD, Maas PA, Lutz RA, Vrijenhoek RC. A hybrid zone between hydro-thermal vent mussels (Bivalvia: Mytilidae) from the Mid-Atlantic Ridge.
Mol Ecol. 2001;10:2819–31.
11. Won Y-J, Hallam SJ, O’Mullan GD, Vrijenhoek RC. Cytonuclear disequilibrium in a hybrid zone involving deep-sea hydrothermal vent mussels of the genusBathymodiolus. Mol Ecol. 2003;12:3185–90.
12. Johnson SB, Won YJ, Harvey JB, Vrijenhoek RC. A hybrid zone between Bathy-modiolusmussel lineages from eastern Pacific hydrothermal vents.
BMC Evol Biol. 2013;13:21.
13. Zhang H, Johnson SB, Flores VR, Vrijenhoek RC. Intergradation between discrete lineages ofTevnia jerichonana, a deep-sea hydrothermal vent tubeworm. Deep Sea Res Part II. 2015;121:53–61.
14. Van Dover CL, German C, Speer KG, Parson L, Vrijenhoek R. Evolution and biogeography of deep-sea vent and seep invertebrates. Science.
2002;295:1253–7.
15. Audzijonyte A, Vrijenhoek R. When gaps really are gaps: statistical phylogeography of hydrothermal vent invertebrates. Evolution.
2010;64:2369–84.
16. Vrijenhoek RC. Genetic diversity and connectivity of deep-sea hydrothermal vent metapopulations. Mol Ecol. 2010;19:4391–411.
17. Von Cosel R, Métivier B, Hashimoto J. Three new species ofBathymodiolus (Bivalvia: Mytilidae) from hydrothermal vents in the Lau Basin and the North Fiji Basin, western Pacific, and the Snake Pit area, Mid-Atlantic Ridge. Veliger.
1994;37:374–92.
18. Von Cosel R, Comtet T, Krylova E.Bathymodiolus(Bivalvia: Mytilidae) from hydrothermal vents on the Azores Triple Junction and the Logatchev Hydrothermal Field, Mid-Atlantic Ridge. Veliger. 1999;42:218–48.
19. Maas PAY, O’Mullan GD, Lutz RA, Vrijenhoek RC. Genetic and morphometric characterization of mussels (Bivalvia: Mytilidae) from Mid-Atlantic hydrothermal vents. Biol Bull. 1999;196:265–72.
20. Duperron S, Gaudron SM, Rodrigues CF, Cunha MR, Decker C, Olu K. An over-view of chemosynthetic symbioses in bivalves from the North Atlantic and Mediterranean Sea. Biogeosciences. 2013;10:3241–67.
21. Tyler PA, Young CM. Reproduction and dispersal at vents and cold seeps. J Mar Biol Assoc UK. 1999;79:193–208.
22. Le Pennec M, Beninger PG. Reproductive characteristics and strategies of reducing-system bivalves. Comp Biochem Physiol A. 2000;126:1–16.
23. Dixon DR, Lowe DM, Miller PI, Villemin GR, Colaço A, Serrão-Santos R, Dixon LRJ.
Evidence of seasonal reproduction in the Atlantic vent musselBathymodiolus azoricus, and an apparent link with the timing of photosynthetic primary production. J Mar Biol Assoc UK. 2006;86:1363–71.
24. Colaço A, Martins I, Laranjo M, Pires L, Leal C, Prieto C, Costa V, Lopes H, Rosa D, Dando PR, et al. Annual spawning of the hydrothermal vent mussel, Bathymodiolus azoricus, under controlled aquarium, conditions at atmospheric pressure. J Exp Mar Biol Ecol. 2006;333:166–71.
25. Faure B, Jollivet D, Tanguy A, Bonhomme F, Bierne N. Speciation in the deep sea: multi-locus analysis of divergence and gene flow between two hybridizing species of hydrothermal vent mussels. PLoS One. 2009;4:e6485.
26. Toews DPL, Brelsford A. The biogeography of mitochondrial and nuclear discordance in animals. Mol Ecol. 2012;21:3907–30.
27. Payseur BA. Using differential introgression in hybrid zones to identify genomic regions involved in speciation. Mol Ecol Resour. 2010;10:806–20.
28. Breusing C, Biastoch A, Drews A, Metaxas A, Jollivet D, Vrijenhoek RC, Bayer T, Melzner F, Sayavedra L, Petersen JM, et al. Biophysical and population genetic models predict the presence of“phantom”stepping stones connecting Mid-Atlantic Ridge vent ecosystems. Curr Biol. 2016;26:2257–67.
29. Buerkle CA. Maximum-likelihood estimation of a hybrid index based on molecular markers. Mol Ecol Notes. 2005;5:684–7.
30. Pritchard JK, Stephens M, Donnelly P. Inference of population structure using multilocus genotype data. Genetics. 2000;155:945–59.
31. Gompert Z, Buerkle CA. A powerful regression-based method for admixture mapping of isolation across the genome of hybrids. Mol Ecol. 2009;18:1207–24.
32. Gompert Z, Buerkle CA. Introgress: a software package for mapping components of isolation in hybrids. Mol Ecol Resour. 2010;10:378–84.
33. R Core Team. R: A language and environment for statistical computing.
Vienna: R Foundation for Statistical Computing; 2015.
34. Anderson EC, Thompson EA. A model-based method for identifying species hybrids using multilocus genetic data. Genetics. 2002;160:1217–29.
35. Nielsen EE, Bach LA, Kotlicki P. HYBRIDLAB (version 1.0): a program for generating simulated hybrids from population samples. Mol Ecol Notes.
2006;6:971–3.
36. Milne RI, Abbott RJ. Reproductive isolation among two interfertileRhododendron species: low frequency of post-F1 hybrid genotypes in alpine hybrid zones. Mol Ecol. 2008;17:1108–21.
37. Falush D, Stephens M, Pritchard JK. Inference of population structure using multi-locus genotype data: linked loci and correlated allele frequencies.
Genetics. 2003;164:1567–87.
38. Evanno G, Regnaut S, Goudet J. Detecting the number of clusters of individuals using the software STRUCTURE: a simulation study. Mol Ecol. 2005;14:2611–20.
39. Meirmans PG. Seven common mistakes in population genetics and how to avoid them. Mol Ecol. 2015;24:3223–31.
40. Bandelt HJ, Forster P, Röhl A. Median-joining networks for inferring intraspecific phylogenies. Mol Biol Evol. 1999;16:37–48.
41. Forster P, Harding R, Torroni A, Bandelt HJ. Origin and evolution of Native American mtDNA variation: a reappraisal. Am J Hum Genet. 1996;59:935–45.
42. Saillard J, Forster P, Lynnerup N, Bandelt HJ, Nørby S. mtDNA variation among Greenland Eskimos: the edge of the Beringian expansion. Am J Hum Genet. 2000;67:718–26.
43. Breusing C, Johnson SB, Tunnicliffe V, Vrijenhoek RC. Population structure and connectivity in Indo-Pacific deep-sea mussels of theBathymodiolus septemdierumcomplex. Conserv Genet. 2015;16:1415–30.
44. Rousset F. Genepop’007: a complete re-implementation of the Genepop software for Windows and Linux. Mol Ecol Resour. 2008;8:103–6.
45. Benjamini Y, Yekutieli D. The control of the false discovery rate in multiple testing under dependency. Ann Stat. 2001;29:1165–88.
46. Narum SR. Beyond Bonferroni. Less conservative analyses for conservation genetics. Conserv Genet. 2006;7:783–7.
47. Burton RS, Pereira RJ, Barreto FS. Cytonuclear genomic interactions and hybrid breakdown. Annu Rev Ecol Evol Syst. 2013;44:281–302.
48. Chou J, Leu J. The Red Queen in mitochondria: cyto-nuclear co-evolution, hybrid breakdown and human disease. Front Genet. 2015;6:187.
49. Beinart RA, Sanders JG, Faure B, Sylva SP, Lee RW, Becker EL, Gartman A, Luther 3rd GW, Seewald JS, Fisher CR, et al. Evidence for the role of endosymbionts in regional-scale habitat partitioning by hydrothermal vent symbioses. Proc Natl Acad Sci U S A. 2012;109:3241–50.
50. Won YJ, Hallam SJ, O’Mullan GD, Pan IL, Buck KR, Vrijenhoek RC. Environmental acquisition of thiotrophic endosymbionts by deep-sea mussels of the genus Bathymodiolus. Appl Environ Microbiol. 2003;69:6785–92.
51. Gompert Z, Fordyce JA, Forister ML, Shapiro AM, Nice CC. Homoploid hybrid speciation in an extreme habitat. Science. 2006;314:1923–5.
52. Mallet J. Hybrid speciation. Nature. 2007;446:279–83.
53. Gardner JPA. TheMytilus edulisspecies complex in southwest England.
Effects of hybridization and introgression upon interlocus associations and morphometric variation. Mar Biol. 1996;125:385–99.
54. Bierne N, Daguin C, Bonhomme F, David P, Borsa P. Direct selection on allozymes is not required to explain heterogeneity among marker loci across aMytilushybrid zone. Mol Ecol. 2003;12:2505–10.
55. Beaulieu SE, Baker ET, German CR. Where are the undiscovered hydrothermal vents on oceanic spreading ridges? Deep Sea Res Pt II. 2015;121:202–12.
56. Murton BJ, Van Dover C, Southward E. Geological setting and ecology of the Broken Spur hydrothermal vent field. 29° 10′N on the Mid-Atlantic Ridge. Geol Soc Lond Spec Publ. 1995;87:33–41.
57. Van Dover CL. Ecology of Mid-Atlantic Ridge hydrothermal vents. Geol Soc Lond Spec Publ. 1995;87:257–94.
58. Breusing C, Vrijenhoek RC, Reusch TBH. 2016 Genotypes ofBathymodiolus vent mussels from the Mid-Atlantic Ridge using SNP and mitochondrial markers. PANGAEA. doi: 10.1594/PANGAEA.859094 .