N. Riedinger1 , M.E. Torres2 , E. Screaton3 , E.A. Solomon4, S. Kutterolf5 , J. Schindlbeck‐Belo6, M.J. Formolo7, T.W. Lyons8, and P. Vannucchi9,10
1Boone Pickens School of Geology, Oklahoma State University Stillwater, OK, USA,2College of Earth, Ocean, and Atmospheric Sciences, Oregon State University, Corvallis, OR, USA,3Department of Geological Sciences, University of Florida, Gainesville, FL, USA,4School of Oceanography, University of Washington, Seattle, WA, USA,5GEOMAR Helmholtz Centre for Ocean Research Kiel, Kiel, Germany,6Institute for Geosciences, University of Heidelberg, Heidelberg, Germany,7ExxonMobil Upstream Research Company, TX, USA,8Department of Earth Sciences, University of California, Riverside, CA, USA,9Earth Sciences Department, Royal Holloway, University of London, Egham, UK,
10Dipartimento di Scienze della Terra, Università degli Studi di Firenze, Firenze, Italy
Abstract
Distinct differences were observed in geochemical signatures in sediments from two sites drilled in the upper plate of the Costa Rica margin during Integrated Ocean Drilling Program (IODP) Expedition 334. The upper 80 m at Site U1379, located on the outer shelf, shows pore water non‐steady state conditions characteristic of a declining methaneflux. These contrast with analyses of the upper sediment layers at the middle slope site (U1378) that reflect steady state conditions. Distinct carbonate‐rich horizons up to 11 meters thick were recovered between 63 and 310 meters below seafloor at Site U1379 but were not found at Site U1378. The carbonates and dissolved inorganic carbon from Site U1379 have a depleted carbon stable isotope signal (up to−25‰) that indicates anaerobic methane oxidation. This inference is further supported by distinctδ34S‐pyrite and magnetic susceptibility records that revealfluctuations of the sulfate‐methane transition in response to methaneflux variations. Tectonic reconstructions of this margin document a marked subsidence event after arrival of the Cocos Ridge, 2.2 ± 0.2 million years ago (Ma), followed by increased sedimentation rates and uplift. As the seafloor at Site U1379 rose from ~2,000 m to the present water depth of ~126 m, the site moved out of the gas hydrate stability zone at ~1.1 Ma, triggering upward methane advection, methane oxidation, and the onset of massive carbonate formation. Younger carbonate occurrences and the non‐steady state pore water profiles at Site U1379 reflect continued episodic venting likely modulated by changes in the underlying methane reservoir.
Plain Language Summary
Several carbonate‐rich layers, up to 11 m in thickness, were recovered in sediments collected at Site U1379 in the outer shelf of the Costa Rica margin, offshore the Osa Peninsula. These layers coincide with minima in the magnetic mineral assemblages. To investigate the processes and mechanisms that led to the formation of these carbonates, we used geochemical and sedimentological analyses of pore water and solid phase samples collected at two sites (U1378 and U1379) during the Integrated Ocean Drilling Program (IODP) Expedition 334. Our results, in the context of available dating and tectonic reconstructions, indicate that the discrete carbonate layers formed near the seafloor driven by anaerobic oxidation of methane, which was released from deeper sediments. The methane discharge events can be related to the subsidence and uplift history of the margin following the subduction of the Cocos Ridge beneath the Caribbean plate. Methane discharge at Site U1379 began ~1.1 Ma, when the ongoing margin uplift brought this site to a depth shallower than that where gas hydrates are stable, breaking a permeability barrier that had kept methane trapped within the sediment. Since then, methane continued to be released in discrete events modulated by characteristics of the gas reservoir.1. Introduction
Any effort to fully characterize Earth's carbon cycle necessitates a good understanding of the processes that generate and consume methane within the sediment and overlying hydrosphere. Examples in the literature document forcing and consequences of methane advection pulses in sedimentary systems (e.g., Reeburgh, 2007, and references therein). A common approach to unraveling methane dynamics uses the combined
©2019. American Geophysical Union.
All Rights Reserved.
Key Points:
• Authigenic carbonate formation documents episodic methane venting
• Fluid release events respond to uplift and subsidence off Costa Rica
• Diagenetic changes impact sedimentary magnetic signal in non‐steady state system
Supporting Information:
•Supporting Information S1
Correspondence to:
N. Riedinger,
natascha.riedinger@okstate.edu
Citation:
Riedinger, N., Torres, M. E., Screaton, E., Solomon, E. A., Kutterolf, S., Schindlbeck‐Belo, J., et al (2019).
Interplay of Subduction Tectonics, Sedimentation, and Carbon Cycling.
Geochemistry, Geophysics, Geosystems, 20, 4939–4955. https://doi.org/10.1029/
2019GC008613
Received 6 AUG 2019 Accepted 20 SEP 2019 Published online 10 NOV 2019
profiles of dissolved sulfate and methane, because the microbially mediated oxidation of methane by sulfate results in characteristic dissolved sulfate profiles that decrease from seawater values to non‐detectable sul- fate at the sulfate‐methane transition (SMT). In the early 1990s, the slope of a linear sulfate profile was shown to be a good indicator of the strength of the methaneflow, so that a very shallow SMT would indicate a high methaneflux and rapid anaerobic oxidation of methane (AOM; e.g., Niewöhner et al., 1998; Borowski et al., 1999).
We now know that not all pore water sulfate gradients are linear and that deviations from this steady state condition most often reflect recent changes in methaneflux, which have been attributed to a gamut of pro- cesses including pulses in organic carbon accumulation, mass transport deposition, earthquake activity, and dynamics of deeper methane reservoirs (e.g., Egger et al., 2018; Hensen et al., 2003; Riedinger et al., 2005).
We also know that AOM is accompanied by: (1) an increase in alkalinity that promotes precipitation of methane‐derived authigenic carbonate (MDAC) and (2) production of H2S and associated sulfide mineral diagenesis that overprints the magnetic susceptibility of the sediment (e.g., Karlin & Levi, 1983; Tarduno, 1994; Roberts et al., 1999; Neretin et al., 2004; Riedinger et al., 2005, 2017; März et al., 2008; Rowan et al., 2009). These minerals remain in the sediment record and offer an excellent opportunity to reconstruct the history and nature offluidflow. Examples include studies of modern and paleo‐seep carbonate (e.g., Han et al., 2014; Joseph et al., 2013; Pierre et al., 2012) and iron minerals (e.g., Dewangan et al., 2013; Zhang et al., 2014) worldwide.
One of the goals of the Integrated Ocean Drilling Program (IODP) Costa Rica Seismogenesis Project (CRISP) was to investigatefluidflow and related diagenetic reactions on an active margin characterized by erosive subduction processes. Here we report on porefluids, solid‐phase iron, and carbonate phases from IODP Expedition 334. We use our data to relate carbon cycling to the tectonic history of the erosional convergent margin of Costa Rica. We review and update our understanding of the tectonic evolution of the margin using pore water, solid phase, and mineral (carbonate and sulfide) geochemical data complemented with available magnetic susceptibility records. We integrate these results with a modeled gas hydrate stability response to the uplift/subsidence of the forearc basin at, and following, the arrival of the Cocos Ridge, to generate an integrated view of the volatile recycling history of the margin over the past approximately 2 million years.
Collectively our results document the timing and effect offluid release events in response to uplift and sub- sidence of the margin as the Cocos Ridge subducts offshore the Osa Peninsula.
1.1. Study Area
The CRISP study area (Figure 1a) is located offshore the Osa Peninsula within an area of active and long‐ lived subduction erosion—that is the removal of crust from the overriding tectonic plate due to subduction of oceanic crust—that extends from Guatemala to Costa Rica (e.g., LaFemina et al., 2009; Ranero et al., 2008;
Ranero & von Huene, 2000; Vannucchi et al., 2004, 2013). A well‐characterized suture in the incoming plate offshore the Nicoya Peninsula separates the ~24 Ma crust originating at Cocos‐Nazca spreading center to the southeast from the similarly aged East Pacific Rise crust that subducts to the northwest of the suture.
Seepage in the northwestern region of the forearc is typically focused on cone‐shaped mounds with a few localized sites associated with normal faulting (Sahling et al., 2008). In contrast, the forearc segment to the southeast of the plate suture exhibits diverse seep structures that reflect the irregular morphology of the forearc caused by the subduction of ridges and seamounts. Seepage here has been associated with frac- tures directly related to seamount subduction, mounds, and landslide scars forming preferentialfluid migra- tion pathways that commonly control the seepage site (e.g., Kutterolf et al., 2008; Moerz et al., 2005). A more thorough picture of the seep distribution has been developed with the onset of coupled seismic reflection and multibeam surveys that can image gas plumes in the water column (Figure 1c).
Using hull‐mounted multibeam and towed side‐scan surveys, Sahling et al. (2008) suggested that the loca- tion of seepage in this region is centered 28 ± 7 km landward of the trench. In a coupled high‐resolution seis- mic reflection and multibeam survey focused in the region offshore Osa Peninsula, Kluesner et al. (2013) documented a substantially greater seep density over a broader depth range than previously reported, with 161 sites of potential fluid seepage on the shelf and slope regions that had not been detected before (Figure 1a). In this latter study, the authors clearly showed how the seep distribution is controlled by fault- ing. Fluid seepage indicators include pockmarks, mounds, and ridges ranging from a few meters to hundreds of meters across (Kluesner et al., 2013). Similar to the observations of Sahling et al. (2008), Kluesner et al.
(2013) reported seepage across the mid‐slope region, coincident with the upper edge of gas hydrate stability, with almost no seep evidence in the lower slope region. These authors also note that the majority of pockmarks observed in the upper and lower slope are associated with BSR weakening and terminations.
These observations, tied to a significant decrease in seep density in sediments that lie within the gas hydrate stability zone (Kluesner et al., 2013), are consistent with gas accumulations beneath a zone where interconnected networks of gas hydrate cut off pore space connectivity limiting upward methane advection (e.g., Evrenos et al., 1971; Riedel et al., 2006; Sahoo et al., 2018).
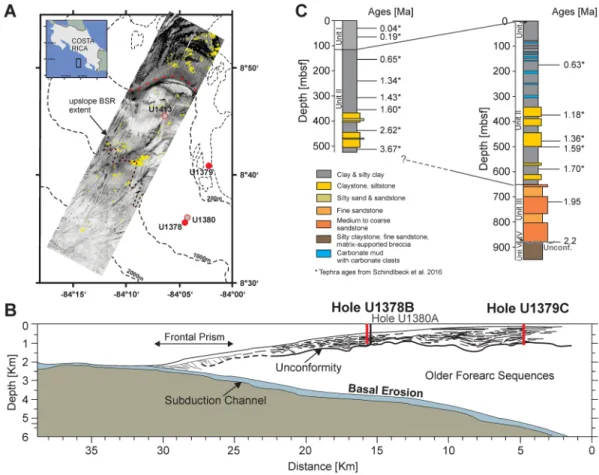
Drilling offshore the Osa Peninsula during IODP CRISP Expeditions 334 and 344 (Figure 1b) probed the nature of the modern forearc sediment apron and the sediment sequence beneath a prominent reflector in the 3‐D seismic volume. This reflector extends from the middle slope to the shelf and has been interpreted as a regional angular unconformity (Harris et al., 2013; Vannucchi et al., 2012). The shallowest site along the CRISP transect, Site U1379, was drilled into the outer shelf of the Costa Rica margin with a present seafloor depth of 127 meters below sea level (m bsl). Coring recovered ~1 meter of medium‐to coarse‐grained beach sand with disarticulated shell fragments (Lithologic Unit I) above the sediments of Lithologic Unit II (0.93–651 m below seafloor, m bsf). These are predominantly monotonous sequences of silty clay to clay that alternates with widely interspersed decimeter‐scale sandy layers and abundant tephra layers that remain unlithified to 650 m bsf and are excellent markers for time constraints (Schindlbeck et al., 2016a;
Figure 2c). Carbonates occur as discrete concretions and or carbonate mud sediment between 63–305 m bsf (Figure 1c). The carbonate‐rich intervals are separated by monotonous silty clay (stone)–clay (stone) and clayey silt (stone)–sand (stone).
Figure 1.Overview of the study area and drilled sites. (a) Location of study Sites U1378 (127 meters below sea level (m bsl)) and U1379 (522 m bsl) as well as Sites U1380 (504 m bsl) and U1413 (540 m bsl), in the context of a backscatter mosaic of the wide CRISP survey area; the yellow patches on the backscatter patch present potential locations of pock- marks (modified after Kluesner et al., 2013). Simplified seismic cross section along the margin off Costa Rica including the location of the drilled sites (modified after Vannucchi et al., 2012, ). (c) Lithology and ages for Sites U1378 and U1379 (modified after Vannucchi et al., 2012 and tephra ages (*) from Schindlbeck et al., 2016a).
Olive‐green silty sands and sandstone deposits constitute ~64% of the thickness of Lithologic Unit III (651–880 m bsf) and alternate withfiner hemipelagic sediments. Small, disseminated wood and plant debris are recognized throughout coarser horizons. Tephra layers are less common than in overlying units. Unit IV (870–882 m bsf) consists of carbonate‐cemented medium‐ to coarse‐grained sand containing abundant disseminated shell debris. The basal meter of the unit revealed distinct centimeter‐thick shell layers and localized well‐rounded pebble conglomerates. The mudstone of Unit V (882–947 m bsf) is brecciated and intercalated with basalt clasts in the upper part, with a sequence of variably sandy and clayey silt matrix in the lower portion (Vannucchi et al., 2012; Figure 1c).
The upper slope was sampled by drilling Site U1378 in 522 m of water, 41 km offshore the Osa Peninsula (Figure 1b). The sediments recovered at this location—a monotonous sequence of silty clay to clay that alter- nates with widely interspersed centimeter‐scale sandy layers—are divided into two main lithostratigraphic units (Figure 1c). Unit I (0–128 m bsf) consists mainly of dark greenish gray, soft, silty clay sediments with 21 tephra layers and is punctuated by thick sequences of lithic sands. Unit II (128–513 m bsf) is a monotonous massive sequence of olive green clay and silt with minor sandy intervals that become thicker and more com- mon with greater depth. The sediment is generally well‐consolidated but contains tephra layers that remain unlithified to 506 m bsf (Figure 1c). Drilling at Site U1378 was terminated before reaching the depth of the unconformity, and an additional site, U1380, was drilled to investigate the deeper portions of the upper slope sequence and underlying wedge sediments. The sedimentary succession recovered from the framework wedge at Site U1380 revealed an alternating terrestrially sourced, turbiditic upper slope (Units I, 438 to 553 m bsf, and Unit III, 7,812 to 800 m bsf) to shelf (Unit II, 553 to 772 m bsf) sequence thought to reflect the influence of deltaic‐derived sediments (Harris et al., 2013).
The unconformity imaged in the seismic data was sampled at Sites U1379 and U1380 and was found to cor- respond with a sharp depositional and lithological change dated at 2.2 ± 0.2 Ma. Shell‐rich material was Figure 2.(a and b) Selected core images of carbonate layers from the upper 320 m bsf (for lithology legend see Figure 1).
(c and d) Changes from deep marine to shallow marine to deep marine and shallow marine environment is recorded in the cored sediments. The contact between deep marine (Unit V; brecciated mudstone) and shallow marine deposits (Unit IV; bioturbated sands with shell fragments) is indicated by the red line marking the unconformity (modified after Vannucchi et al., 2013).
recovered at the unconformity and separates the shallow water base of the modern slope sediment drape from underlying poorly deformedfine‐to coarse‐grained volcanoclastic turbidites and hemipelagites typical of a deep‐water environment (Vannucchi et al., ). The sediments below the unconformity are interpreted as the topmost portion of the wedge imaged in seismic profiles and characterized by a progressive increase in deformation at depth within the wedge itself. Prior to drilling, the material beneath the unconformity was postulated to be crystalline basement, and it was unclear how thefluids from the underthrusting material could provide enough water, and more problematically enough carbon, to support the widespreadfluid and methane seepage along this margin (e.g., Bohrmann et al., 2002; Mau et al., 2006; Mau et al., 2007).
We now know that the wedge itself generates additionalfluids and volatiles (such as methane). Two distinct fluid migration paths were identified from the CRISP pore water data set: (1) lateral advection along the unconformity of deep‐sourcedfluids consisting of thermogenic hydrocarbons with afluid composition that indicates source temperatures of at least 90oC (Vannucchi et al., 2012) and (2) a more pervasive migration of dehydration‐derivedfluids with a distinctly differentfluid composition that likely originates from a more local, lower temperature source in the wedge (Harris et al., 2013; Vannucchi et al., 2012).
2. Materials and Methods
2.1. Sampling and Shipboard Analyses
Immediately after core retrieval, a 3‐cm3bulk sediment sample was collected for headspace analyses from the freshly exposed end of top core sections adjacent to the interstitial water sample. Hydrocarbon composi- tion was measured at sea using an Agilent/HP 6890 Series II gas chromatograph (GC3). The concentrations were subsequently corrected for sediment porosity (Expedition 334 Scientists, 2012). Solid phase and pore water samples were taken from whole‐round cores cut and processed immediately after retrieval. Samples were squeezed for pore water, and the extracted porefluids were treated and stored cool (+4°C). The remain- ing solid phase (squeeze cake) was stored frozen (−20°C) for further analyses. For detailed description of sampling, sample processing, and analyzes on board the D/V Joides Resolution see the“Methods”chapter (Expedition 334 Scientists, 2012).
2.2. Pore Water and Gas Analyses
Pore water sulfate (SO4), alkalinity, dissolved calcium (Ca), and methane (CH4) were measured onboard the DV JOIDES Resolution (Vannucchi et al., 2012). Alkalinity was determined by Gran titration (Gieskes et al., 1991), and sulfate was analyzed using a Dionex ICS‐3000 ion chromatograph. Calcium was measured via inductively coupled plasma‐atom emission spectrometry (ICP‐AES) with a Teledyne Prodigy high‐ dispersion ICP spectrometer (Murray et al., 2000).
Carbon isotopes of dissolved inorganic carbon (δ13C‐DIC) were analyzed at Oregon State University (OSU) after treatment with 100 μL of 43% H3PO4 using a Gas Bench II automated sampler interfaced with a Finnigan DELTA plus XL gas source stable isotope mass spectrometer (GS‐IRMS; for details see Torres et al., 2005). Based on replicate analyses of a NaHCO3stock solution, the overall precision of this analysis is better than ±0.15‰.
For isotope analyses of sulfate,filtered pore water aliquots were acidified, and sulfate was precipitated with a 1 M barium chloride solution (BaCl2) to barium sulfate (BaSO4). Sulfur isotope measurements were per- formed using an EA‐IRMS model Delta V (Finnigan; Thermo Fisher Scientific, Waltham, MA, USA) at the University of California, Riverside (UCR). The sulfur isotope data are reported relative to the Vienna Cañon Diablo Troilite (VCDT) standard. The standard deviation (1σ) of replicate measurements of an in‐
house standard was less than 0.2‰forδ34S values.
2.3. Solid Phase Analyses
Data for total inorganic carbon (TIC), porosity, and magnetic susceptibility (Ƙ) were collected onboard the DV JOIDES Resolution (Vannucchi et al., 2012). Total inorganic carbon (TIC) was analyzed using a Coulometrics 5011 CO2coulometer. Magnetic susceptibility was measured with a Bartington Instruments MS2 meter coupled to a MS2C sensor coil, and porosity was determined by measurement of wet mass, dry mass, and dry volume (Blum, 1997).
Carbonate samples were characterized isotopically at OSU using traditional phosphoric acid digestion and IRMS. Carbonate powders were reacted with 100% phosphoric acid at 75°C, and the isotopic composition was measured using a Kiel III device connected to a Thermo Fisher 252 gas source mass spectrometer.
Isotopic analyses with this technique yield a precision better than ± 0.1‰and 0.2‰forδ13C andδ18O, respectively. Instrument calibration was accomplished by comparison to NBS‐19. The strontium isotopic composition of the carbonates was determined after a soft‐leaching procedure on samples via multi‐collector ICP‐mass spectrometry (MC‐ICP‐MS) at OSU. The 2σerrors in the Sr isotope ratios measured by MC‐ICP‐ MS at OSU were ± 0.000028 (for method details see Ruark et al., 2019).
Chromium reducible sulfur (CRS) species were determined using 0.5–1 g frozen wet samples that were trea- ted with a two‐step acid Cr (II) distillation method at 200°C for ~2h (Fossing & Jørgensen, 1989) at UCR. Any potential elemental sulfur (S0) and monosulfides were removed prior to the Cr (II) distillation with methanol followed by a cold ~1h extraction with 6M HCl, collected and characterized via the methylene blue method (because all values of monosulfides and S0were below 0.05 wt%, with the majority of the samples below or near the detection limit of ~1 ppm, we did not included these data in our discussion). Once these phases were removed, the released sulfide from CRS was trapped in a 5% w/v Zn‐Acetate solution. The trapped CRS sam- ples were sonicated, thoroughly shaken, and an aliquot of each sample was diluted and analyzed spectropho- tometrically via the methylene blue method (Cline, 1969). The CRS content data are reported in dry weight percent units. During the Cr (II) reduction step, mainly pyrite and some of greigite are extracted (e.g., Cornwell & Morse, 1987). For simplification, because greigite is typically a minor component, we refer to CRS as pyrite throughout the text. The sulfur isotope composition of CRS (δ34S‐CRS) was determined by con- verting zinc sulfide to silver sulfide (Ag2S) with a 5% silver nitrate (AgNO3) solution. The precipitate was rinsed and washed with deionized water and 1 M NH4OH and subsequently dried at approximately 50°C.
Sulfur isotope ratios were measured on a EA‐IRMS model Delta V as described above for the dissolved sul- fate measurements. For further method details see Riedinger et al. (2017).
3. Results and Discussion
We combine the most recent understanding of the subsidence/uplift history of the margin with geochemical information to model the onset of the discrete carbonate layers recovered from Site U1379, which is the shal- lowest drilled site on this margin.
3.1. Reconstructing Tectonic History of the Margin
By combining drilling results with a large 3‐D seismic reflection volume (e.g., Bangs et al., 2015, 2016;
Kluesner et al., 2013), Vannucchi et al. (2016) postulated a new framework for the forearc evolution of this margin. Subduction of the main body of the Cocos Ridge led to rapid uplift and subaerial exposure of the forearc, evidenced by shell‐rich sandstone typical of beach to nearshore deposition (Figure 2;Vannucchi et al., 2012; Harris et al., 2013). The uplift of the margin to or near sea‐level is followed by net subsidence caused by erosion at the base of the overriding plate, and the eroded forearc rapidlyfills with terrigenous sediment in what Vannucchi et al. (2016) refer to as a depositionary basin. Organic matter degradation within the thick sedimentary package thatfilled the forearc basin supports active methanogenesis (e.g., Hensen & Wallmann, 2005; Lückge et al., 2002). This revised depositional model also explains the pervasive hydrocarbon venting–a mixture of biogenic and thermogenic source–across the margin (see also Figure 1a;
Schmidt et al., 2005; Mau et al., 2006; Kluesner et al., 2013) that could not be supported from the organic car- bon present in the thin, mainly pelagic subducting sediment section, where TOC is less than 2.5 wt.%.
The original time frame for the evolution of the forearc offshore the Osa Peninsula was developed on the basis of shipboard biostratigraphic dating (Vannucchi et al., 2013). Post cruise tephrochronology studies yielded a more detailed and revised age model for the margin (Schindlbeck et al., 2016a). In particular, tephra dating at Site U1379, provided a new critical age of 1.4 Ma at 450 m bsf, which differs from the 0.4 Ma age estimate derived from biostratigraphic dating at sea (Schindlbeck et al., 2016a). We use this revised age model in our interpretations (Figures 1c and 2). The more recent stratigraphic ages are in good agree- ment with model ages from nearby sites (Li et al., 2015).
3.2. Contrasting Behavior of Two Sites on the Upper Plate
The main hydrogeologic features of the sites drilled in the context of the CRISP project are described in Vannucchi et al. (2012) and Harris et al. (2013). Here we focus on pore water changes in the upper 50 m bsf at Sites U1378 and U1379 to illustrate recent changes in biogeochemical behavior of two these sites.
Although both sites are located on the upper plate, they differ in sedimentological signals and geochemical behavior. Site U1378 shows a steady‐state pore water sulfate profile, which decreases linearly with depth from the seafloor to a SMT at around 12 m bsf (Figure 3). The outer shelf Site U1379 is characterized by a concave‐
down sulfate pore water profile (Figure 4), which, in conjunction with a broad SMT (from 30 to 40 m bsf) and low methane concentrations, indicates a waning of upward methaneflow. Deep penetration of seawater sulfate into the sediments, and consequently, a downward shift of the SMT (e.g., Hensen et al., 2003) is characteristic for the end of a venting episode at seep sites (e.g., Roberts & Carney, 1997; Torres et al., 2001).
The result is that magnetic minerals can be buried to greater sediment depth on the upper slope without alteration. This assertion is in agreement with the observation offine‐grained magnetite in sediments below 450 m bsf by Usui et al. (2015). Fine magnetite is typically prone to alteration in sulfide‐containing environ- ments. In contrast to Site U1379, the pore water concentration profiles at Site U1378 indicate a steady upward movement of the SMT with sediment burial, leading to production and accumulation of hydrogen sulfide (up to 1.75 mM) at the SMT. Reactive iron oxide minerals, including magnetite, are thus altered into iron sulfide phase expressed in accumulation of 34S‐enriched pyrite (up to 1 wt.%). The net result is a decrease in magnetic susceptibility (Figure 3; e.g., Tarduno, 1994; Roberts et al., 1999; Riedinger et al., 2005, 2017; März et al., 2008; Roberts, 2015).
3.3. Carbonate Geochemistry
In addition to pore water profiles indicative of a recent decrease in methaneflux, the sediment recovered at Site U1379A contain a sequence of lithified concretions of carbonate mud within Lithologic Unit II (Figure 2). Such distinct layers were not present at Site U1378.
Decades of work on MDAC both along the Costa Rica margin as well as at seeps worldwide have generated a conceptual understanding of how these deposits form (e.g., Aloisi et al., 2000; Naehr et al., 2000; Ritger et al., 1987). The carbonate rich sediment layer at 63 m bsf produced an XRD spectra dominated by calcite, Mg‐rich calcite, and aragonite. Carbonate concretions below this layer are predominantly calcite, which is consistent with reports of MDACs worldwide (e.g., Aloisi et al., 2000; Peckmann et al., 2001; Ritger et al., 1987). In Figure 3.Upper slope Site U1378 pore water concentration profiles of sulfate (SO42‐) and sulfate sulfur isotopes (δ34S‐SO4), alkalinity and dissolved inorganic carbon C‐isotopes (δ13C‐DIC), and calcium (Ca) as well as solid phase profiles of total inorganic carbon (TIC), pyrite and its sulfur isotopes (δ34S‐Pyrite), and the magnetic susceptibility (Ƙ). The grey bar displays the sulfate methane transition (SMT). Red arrows indicate average seawater values.
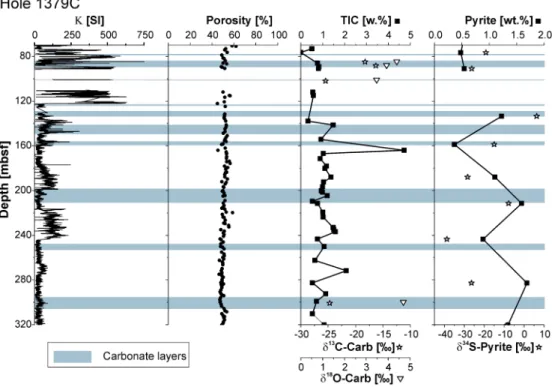
addition, MDACs associated with enhanced methanefluxes at seep sites have been shown to correspond with intervals of magnetic susceptibility (Ƙ) drawdowns (e.g., Usapkar et al., 2014). There are two reasons for this observation: (1) formation of authigenic carbonate layers can cause a dilution in the signal of magnetic mineral assemblages and (2) the formation of hydrogen sulfide from AOM can alter iron oxide mineral assemblages and overprint the magnetic signal (e.g., Roberts, 2015, and references therein). At Site U1379, we record slightly higher values of δ34S‐pyrite in (and near) some of the carbonate layer intervals (Figure 5), suggesting that the observed drawdowns in magnetic susceptibility in the carbonate‐ bearing section result from a dynamic system where ferrimagnetic minerals are converted to paramagnetic sulfides during prolonged intervals of AOM. The lack of an absolute correlation of carbonate layers and the depth ofƘ‐minima could be attributed to factors such as changes in the primary mineral input; the rate of hydrogen sulfide production and consequently the exposure time of iron minerals to H2S, and the diagenetic formation of other magnetic minerals such as greigite, an iron sulfide mineral (e.g., Rowan et al., 2009).
The carbon isotope composition of MDAC reflects both the original methane source and the degree of car- bon fractionation during AOM (e.g., Gieskes et al., 2005). As illustrated in Figure 6, proximity to the center of gas discharge, as well as the time scale over which the seepage operates, controls the depth of the SMT, AOM rate, and consequently the isotopic composition of the dissolved inorganic carbon (DIC) pool (e.g., Gieskes et al., 2005; Han et al., 2014; Hong et al., 2016, 2018; Teichert et al., 2014). In other words, the closer to the gas discharge center, the higher the methaneflux and the more depleted the stable carbon DIC isotope signal (Figure 6). The carbon isotope composition of samples from Site U1379 (Figure 5) are consistent with authigenic deposition at a SMT, whereδ13C‐DIC has a value of approximately−11‰(Figures 5 and 6).
The isotope signal in the samples is, however, less depleted inδ13C compared to samples collected by Han et al. (2004) from the foci of gas discharge along the upper slope (Figure 6a). The carbon isotope range in Site 1379 samples suggests a methaneflux that is lower than those marked by methane advecting rapidly in the gas phase (Figure 6c), such as on aflank of an actively bubbling site similar to reported values by Han et al. (2014; Figure 6b).
The DIC isotopic signal points to low AOM rates consistent with the waning methaneflux suggested by the sulfate profile. Theδ18O is also lighter than that reported by Han et al. (2014), and only the deepest carbonate sample (~300 m bsf) approaches isotope values similar to those designated as“gas hydrate carbonate”(Han et al., 2014; see also Figure S1 in the supporting information) where hydrate dissociation is responsible for Figure 4.Site U1379 pore water concentration profiles of sulfate (SO42‐) and sulfate sulfur isotopes (δ34S‐SO4), alkalinity and dissolved inorganic carbon C‐isotopes (δ13C‐DIC), and calcium (Ca) as well as solid phase profiles of total inorganic carbon (TIC), pyrite and its sulfur isotopes (δ34S‐Pyrite), and the magnetic susceptibility (Ƙ). The grey bar indicates the sulfate methane transition (SMT). The red arrows indicate average seawater values.
more positive oxygen isotope values in the porefluids (Hesse & Harrison, 1981). This possibility agrees with our hypothesis. Specifically, whereas the onset of seepage corresponds to uplift of the margin past the upper edge of hydrate stability, subsequent venting episodes (e.g., Kutterolf et al., 2008) are most likely unrelated to gas hydrate dynamics.
Figure 5.Site U1379 content profiles between 70 and 320 m bsf for the magnetic susceptibility (Ƙ), porosity, total inorganic carbon (TIC), pyrite, and its sulfur isotopes (δ34S‐Pyrite). The light‐blue bars indicate observed carbonate layers (see Vannucchi et al., 2012). It should be noted that most samples for TIC analyses were taken outside observed carbonate layers based on sedimentary description (see also Site U1379 description in Vannucchi et al., 2012).
Figure 6.Schematic overview of the suggested paleodepositional environment for Sites U1378 and U1379. The red line marks the sulfate‐methane transition (SMT) where carbonates can precipitate related to anaerobic methane oxidation.
Open arrow indicates methane gas and black arrows suggest dissolved methaneflux. The carbonate stable isotope values of oxygen (δ18O) and carbon (δ13C) in A and B are from Han et al. (2014) for recent, upper slope seep sites off Costa Rica;
data in C are from this study.
The87Sr/86Sr ratios in the carbonates, with values between 0.70870 and 0.70911 (Table S5), reflect coeval seawater values within the measurement error, which supports microbial carbon cycling pathways as the main source of alkalinity. The seawater values challenge any potential local impact of silicate weathering reactions that can shift the pore waters away from the Sr‐isotope composition of seawater (Sample et al., 2017).
Collectively, the mineralogic and isotopic data of the carbonate sequences recovered at Site U1379 are consistent with formation at a paleo‐SMT site. We postulate that the precipitation events reflect past epi- sodes of upwardflow of methane‐richfluids, likely on theflanks of gas discharge sites (Figure 6).
3.4. Carbonates as Markers of Venting Episodes
Pore water profiles, including the present isotopic signals of carbon and sulfur at Site U1379, point to a highly dynamic system that has experienced changes in methaneflux. These changes can be attributed to various non‐steady state processes. Our observations for the sediments from approximately >0.2 Ma, tied to mineral and isotopic composition of the carbonate and decreases in magnetic susceptibility, support the inference that the carbonate layers recovered at this site reflect a series of paleo‐episodes of enhanced methane migration.
The eleven layers rich in diagenetic carbonate allow us to explore the episodicity offlow by estimating time and duration of the events. Based on tephra layers at 177 and 375 m bsf, with dates of 0.634 and 1.177 Ma, respectively (Schindlbeck et al., 2016a), we infer that carbonate deposition began ~1.1 Ma. The carbonate layers are ~0.5 to 11 m in thickness. If we use an average sedimentation rate of 300 m/Ma (Figure 2), a first‐order approximation for the duration of carbonate deposition is ~1.7 to 37 thousand years (Kyr). Such a period of active venting is too long to correspond to a discrete methane pulse driven by earthquake activity.
Furthermore, we would expect a carbonate record spanning longer than 1.1 Myr and extending along the entire margin if seismicity at the fault interface drives methane‐derived carbonate precipitation. Ourfind- ings are in good agreement, instead, with the episodes of venting previously postulated by Kutterolf et al.
(2008), where episodes offluid venting might have lasted for several tens of thousands of years and could have occurred in multiple cycles at the same venting structure/region.
Here we argue that the onset of carbonate deposition was driven by anaerobic oxidation of a methane pool previously trapped beneath a gas hydrate seal. The fact that gas hydrate act as a permeability barrier forflow has long been postulated and explained by the fact that hydrates occur not as a cement but rather as a load‐bearing phase that cuts off pore space connectivity. Whether hydrate can occur as discrete cement or interconnected between pores is still not fully resolved, but recent experiments measuring both hydrate saturation (Sh) andP‐wave velocity (Vp) under pressure are consistent with a load‐bearing hydrate model as presented by Konno et al. (2015). Imaging of methane hydrates using synchrotron X‐ray computed micro- tomography have also shown methane hydrate to form interconnected networks in porous media (Kerkar et al., 2014; Sahoo et al., 2018). In the scenario we postulate, the gas‐hydrate permeability seal was breached as Site U1379 uplifted beyond the upper limit of gas hydrate stability, freeing the methane‐richfluids to migrate upward and initiate carbonate precipitation at the SMT.
Whereas a major driver for the onset of venting and associated carbonate deposition at 1.1 Ma can be attrib- uted to methane hydrate destabilization, once the hydrate barrier is breached and Site U1379 continues to shoal above the GHSZ, subsequent methane discharge events are not directly tied to gas hydrate dynamics.
Rather, the changes in methaneflux responsible for younger carbonate occurrences and for the non‐steady state sulfate profile are likely related to episodic venting that is modulated by changes in the underlying methane reservoir. Possible regulators of methane discharge events include changes in methane saturation during margin uplift, periodic charge/release of gas reservoirs, opening of newfluid conduits, and potential self‐sealing of migration pathways.
3.5. Gas Hydrate Response to Margin Dynamics
Organic‐rich sediments at water depths greater than 300 to 500 m usually host methane hydrates, a solid compound in which methane and other low molecular weight gases are trapped in a water lattice (e.g., Sloan & Koh, 2007). Stability of methane hydrate depends on water pressure and temperature (e.g., Dickens & Quinby‐Hunt, 1994):
1=ð273:15þTÞ ¼3:79*10−3−2:83×10−4ðlogPÞ (1) whereTis temperature (°C) at the base of gas hydrate stability (BGHS) and P is water pressure at the BGHS.
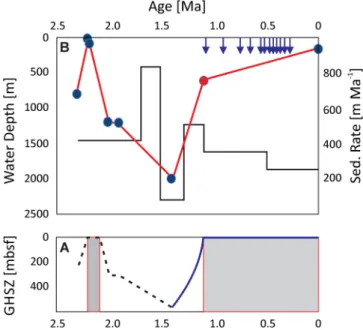
We explore our hypothesis that the onset of carbonate deposition at Site U1379 reflects the initiation of methane release driven by changes in methane hydrate stability in response to the uplift and subsidence his- tory of the margin. This exercise can provide a new constraint on the uplift history of the margin. To this end, we use the backstripping results of Vannucchi et al. (2013) to recreate the seafloor depth through time extending back to 2.5 Ma using the new tephra age constraints of Schindlbeck et al., 2016a; Figures 1c and 7a). Paleo‐bathymetric infer- ences are based on sediment and benthic foraminifera that document subsidence, from near or above sea‐level about 2.2 Ma to water depths of ~2,000 m bsl at 1.4 Ma (blue circles in Figure 7a). There are no existing data to reconstruct paleo‐water depth from 1.4 Ma to the present water depth of 126 m bsl.
We reconstruct the base of gas hydrate stability (BGHS; Figure 7b) since 2.5 Ma using Equation 1 and a thermal gradient of 41.6°C/km based on observations at Site U1379 (Harris et al., 2013; Vannucchi et al., 2012).
Past variations in bottom water temperatures and changes in the thermal gradient due to subduction of the Cocos Ridge will alter the estimated BGHS, but the simplification shown here illustrates roughly the impact of uplift and subsidence on gas hydrates stability (Figure 7b). If we then assume that thefirst appearance of authigenic carbonate at 1.1 Ma corresponds to the time when the BGHS is at the seafloor, we can assign a water depth to this horizon of ~ 600 m bsl. We recognize errors based on the assumption of paleo‐bottom water temperatures, but within the margin of error, this new data point pro- vides an additional constrain on the uplift history of the margin, which yields an estimated rate of uplift in the past 1.1 Myr in the order of 400 m/Myr.
3.6. Carbonate Constraints on Uplift and the Volatile Recycling History of the Margin
Our results, when considered in light of the previous work of Vannucchi et al. (2013, 2016) and the new tephrochronology of Schindlbeck et al. (2016a), leads us to the following scenario for margin evolution.
The Cocos Ridge initially arrived at the margin 2.91 ±0.23 Ma (Schindlbeck et al., 2016a). Subduction of the main body of the Cocos Ridge at 2.2 ± 0.2 Ma generated a forearc embayment that efficiently trapped terrigenous sediment from the nearby continent and enhanced methane generation. Additional CH4was likely supplied from deeper sediments by upward‐flow offluid along the unconformity, as evidenced by geochemical data of Sites U1378 (U1380) and presence of thermogenic hydrocarbons in the 600‐to 800‐m interval Site U1380 (Harris et al., 2013). In the scenario we propose, the methane pool generated between 2.2 and 1.1 Ma may have been trapped within the sediments either as a gas hydrate or as free gas below a permeability barrier created by gas hydrate growth in interconnected networks that cut off pore space connectivity.
A gas hydrate barrier to upward methane advection is consistent with present‐day observations of very lim- ited venting below the edge of gas hydrate stability (Kluesner et al., 2013). This condition would persist as long as the site remained within the GHSZ. At ~1.1 Ma, uplift caused shallowing of the seafloor above the GHSZ (Figure 8). The resulting destabilization allowed upward methane transport, which, upon anaerobic oxidation at the SMT, is transformed into authigenic carbonate. Following 1.1 Ma, Site U1379 remained at depths that were too shallow for gas hydrate formation. As the site continued to shoal, methane continued to be discharged at repeated pulses, some of which were active for prolonged periods (1.7 to 37 thousand years). The longer periods of activity correspond roughly to drawdowns in magnetic susceptibility, consistent with alteration of ferrimagnetic to paramagnetic minerals related to anaerobic methane oxidation (e.g., Riedinger et al., 2005).
Figure 7.Modeled time frame for (a) the depth of the gas hydrate stability zone (GHSZ) at Site U1379 based on; the grey areas indicate time intervals where the depth was too shallow for gas hydrate formation. (b) an updated tectonic history model (modified after Vannucchi et al., 2016 with new age data from Schindlbeck et al., 2016a). The blue arrows indicate formation of massive authigenic carbonate layers, and red circle demarks onset of authigenic carbonate precipitation as the site reaches at the upper edge of gas hydrate stability shown in panel A.
Episodic methane discharge, a process we postulate for Site U1379, was recognized as the driving force for the formation of large forearc carbonate mound structures offshore Nicaragua and Costa Rica (Kutterolf et al., 2008). These authors documented highly active periods of venting that lasted 10–50 thousand years, with intervening inactive periods that spanned more than 10 thousand years. This, and other instances of episodic methane discharge described elsewhere (e.g., Teichert et al., 2003; Leon et al., 2007; Cremiere et al., 2016; Hong et al., 2017; Loher et al., 2018), have been attributed to a variety of forcing mechanisms that include localized conditions at a given fault (changes in local high permeability pathways),fluctuations in the methane reservoir (charge/recharge episodes), regional tectonics (methane release due to uplift and/or fault generation), and changes in eustatic sea level. A combination of these factors was likely at play at Site U1379, where the episodicity recorded in carbonate deposits following the initial methane pulse reveal forcing mechanisms that are not directly tied to gas hydrate changes at the site, which was above the GHSZ after 1.1 Ma (Figure 7a).
Methane seepage and MDAC precipitation since this site shoaled above the upper limit of gas hydrate stabi- lityfits with the regional picture of pervasive methane discharge that was documented at other sites located at or above the upper edge of gas hydrate stability. These sites are identified through high‐backscatter anoma- lies, bathymetric expressions, and hydroacoustic data (e.g., Kluesner et al., 2013). Geophysics data from this margin and elsewhere clearly show that location of migration paths (e.g. faults) plays a dominant role in how much methane reaches a site and determines the well‐defined discrete sites of methane expulsion. Although margins are punctuated by seepage sites, even in highly dense seep patches such as those mapped in the upper slope and shelf region offshore the Osa Peninsula (Figure 1a), there are significant areas of the seafloor with no indication of methane discharge, no chemosynthetic communities, and no authigenic carbonate. It was rather fortunate that coring at Site U1379 pierced a clear and long‐lived focus of methane release.
The extreme dynamic environment at Site U1379 contrasts with the record recovered at Sites U1378 and the companion Site U1380 (Figure 1). The presence of a shell‐rich sand to sandstone unit, which is also present at the unconformity at Site U1380, is indicative of shallower water depth, which was followed by rapid sub- sidence and rapid deposition of land‐derived volcanogenic turbidites in the fore‐arc basin. However, the material recovered at Site U1378 is mostly re‐sedimented from shallower water and not deposited in situ
—in contrast to Site U1379. Additionally, the upper slope site remained within the zone of gas hydrate sta- bility, and it is not until very recently that it reached the 600 m water depth that represents the upper limit of gas hydrate stability zone along this margin. The pore water profiles at Site U1378 reflect a steady state con- dition, with no evidence of recent changes in methaneflux (Figure 3). It is possible that any accumulated methane‐bearingfluid beneath the gas hydrate stability zone at Sites U1378/U1380 may have migrated toward the shallower shelf region where methane discharge occurred in settings analogous to U1379.
Additionally, the occurrences offluid migration pathways, such as fault structures (Figure1b), are known to impact the amount of methane that potentially reaches a specific site.
3.7. Interpretation of Our Results in the Context of Seismic Evidence for Venting
The sites discussed here were drilled along a transect immediately to the south of the 3‐D‐seismic volume described in Kluesner et al. (2013). Site U1413 was drilled in 540 of water within the region covered by this survey (Figure 1a). Although we do not have a complete data set for Site U1413 comparable to what we Figure 8.Simplified sketch of time slices for the last 1.5 million years with regard to the gas hydrate stability zone (GHSZ) at the investigated sites based on the updated tectonic history (Figure 7). The dashed area depicts the GHSZ and dashed line indicates the upper limit for gas hydrate stability (upper gas hydrate stability zone, UGHSZ).
presented for Sites U1378 and U1379, we note that, similar to the situation at Site U1378 (at 533 m bsl), no MDACs were recovered at U1413. The reasons for the lack of MDACs at U1413 are therefore likely similar to those presented for U1378. U1413 is currently close to the edge of hydrate stability where seismic data show lower prevalence of seep sites (Figure 1). Thus, any gas released as the margin shoaled likely migrated to shallower regions, and the lower density of gas vents at the 500–600 m bsf band are likely tied to migration pathways not pierced by drilling.
In agreement with the hypothesis of Sahling et al. (2008), Kluesner et al. (2013) attributed seepage in this region of the margin to the effects of seamount and/or ridge subduction. Seismic acoustic evidence of gas pockets present under many of the seeps, as well as evidence of buried paleo‐seepage sites, was interpreted to result from episodic methane venting driven by gas reservoir dynamics so that when gas accumulation was sufficiently overpressured to breach the sediment trap, gas leaked and vented at the seafloor (Kluesner et al., 2013). These geophysical inferences are in agreement with the conceptual model we propose based on drilling data. We expand the geophysical interpretations by providing geochemical evidence for episodic methane pulses in the shelf region, which is undoubtedly tied to changes in the margin hydrology in response to ridge subduction. We further show that in addition to fault generation, the uplift and subsi- dence response of the margin to the subduction of the Cocos Ridge impacted the gas hydrate stabilityfield, and this long‐term perturbation further modulated the volatile recycling history of the margin.
3.8. Importance for the Ancient Rock Record
The occurrence of massive carbonate layers within the sediments and their association to changes in methaneflux related to gas hydrate dynamics and/or methaneflow pathways might be used to understand the occurrence of massive carbonate concretions observed in the ancient rock record. Discrete diagenetic beds or laterally continuous horizons of ellipsoidal concretions have been observed in several ancient shale formations (e.g., Raiswell, 1971; Coleman & Raiswell, 1981; Kirkland et al., 1992; Coleman, 1993). Although these carbonate concretions have been extensively analyzed, especially for their oxygen and carbon isotope signatures to potentially infer paleo‐temperature and formation timing (see compilation in: Mozley & Burns, 1993), the formation process itself that led to the massive carbonate deposits and why/how the concretions are preserved within the host sediments over long periods of time remains a mystery.
Recently, Lash (2015) suggested that carbonate concretions observed in Upper Devonian Hanover shale deposits near west of New York might have formed near the sediment surface at the SMT due to pulses of high methanefluxes (and with that higher AOM rates). These observed carbonate concretions are embedded in clastic material comprising mainly of silt and clay with high organic content (Lash & Blood, 2004). Similar carbonate concretions were discovered in organic‐rich Devonian Woodford shales (Kirkland et al., 1992).
The Woodford Shale concretions revealed a carbonate δ13C signal in the concretion center of−15 to
−18‰(Martin, 2017). These carbonateδ13C values are very similar to those observed in the carbonate layers from our study area. All these reported massive carbonate concretions have in common that they overlie hydrocarbon producing material. The production of methane (and other hydrocarbons) likely resulted in varying methaneflux over time depending on burial rates that were influenced by tectonic processes and variation in sedimentation rates (e.g., Lash & Blood, 2004). We therefore suggest that tectonically induced methane venting events that potentially resulted in the formation of the eleven carbonate mud sequences within the sediments at Site U1379 might provide a“modern”analogue for the formation of carbonate con- cretions observed in ancient rock formations.
4. 5 Summary and Conclusions
As the upper plate began to uplift ~1.4 Ma, following subduction of the Cocos Ridge offshore of the Osa Peninsula off Costa Rica, the sediment package currently in the outer shelf shoaled above the gas hydrate stabilityfield by ~1.1 Ma. This process resulted in a sudden upward methaneflux driven by gas hydrate destabilization and migration of gas previously trapped beneath the gas hydrates. We postulate that the onset of authigenic carbonate sequences recovered by drilling at IODP Site U1379 marks the uplift out of the GHSZ. Under this assumption, our results provide additional constraints on the uplift history and a new esti- mate of uplift rate of ~400 m in the last 1 million years. As the sediment continued to shoal, methane was free to vent in sediments above the GHSZ, leading to the high density of seepage sites now known to occur in the outer shelf region (Kluesner et al., 2013). Methane discharge in this region is highly episodic, as has been
shown by analyses of carbonate mounds in this region (Kutterolf et al., 2008). Venting episodicity may have been modulated by periodic charge/release cycles from gas reservoirs that could have been affected by methane saturation changes during margin uplift. The episodicity of methane discharge in the outer shelf is revealed at Site U1379 by discrete carbonate layers as young as 0.63 Ma and by non‐steady state pore water profiles indicative of a recent waning of methane pulses.
The observed geochemical signals revealfluid release events in response to uplift and subsidence episodes associated with the Cocos Ridge subduction offshore the Osa Peninsula, with relevance to volatile recycling budgets. Using data collected at seep sites in the northern Costa Rica margin, Füri et al. (2010) concluded that the carbon released via submarinefluid venting at the outer forearc is less than 1% of the carbon input to the subduction zone and the output at the volcanic front. More recently, Barry et al. (2019) suggested that this carbon deficit can be resolved by incorporating the carbon sequestered as carbonate in the forearc in the budgets. These authors used helium and carbon isotope data from deep sourcedfluids to estimate that ~91%
of the forearc carbon is sequestered as calcite and that methane emissions contribute negligibly to the total carbon budget in the forearc. We agree that sequestration as carbonate minerals likely contributes signifi- cantly to the overall carbon inventories, but the analysis by Barry et al. (2019) did not include the carbon input from terrestrial material that rapidlyfilled the forearc basin following the subduction of the Cocos Ridge. The rapid burial of the sediments resulted in significant methane formation and accumulation in the margin wedge as documented by scientific drilling (Harris et al., 2013; Kimura et al., 1997; Vannucchi et al., 2012). The results presented here for Site U1379 illustrate how tectonic uplift processes in this margin allowed methane to migrate towards the SMT, where the increase in alkalinity driven by the anaerobic methane oxidation led to carbon sequestration as MDAC. These carbonates are consistent with the wide- spread gas seepage and carbonate deposition at, and shallower than, the upper edge of gas hydrate stability inferred from geophysical data (e.g., Kluesner et al., 2013). The arcuate shape of the shelf edge, the projection of the Quepos Ridge, and the high density of potential seep sites suggest that this area may be a zone of for- mer seamount/ridge subduction. If true, the processes described at Site U1379 may have been active over geologic time scales. Our integrated approach provides new insights into forearc volatile recycling in response to subduction of the Cocos Ridge beneath the Caribbean plate.
References
Aloisi, G., Pierre, C., Rouchy, J. M., Foucher, J. P., & Woodside, J. (2000). Methane‐related authigenic carbonates of eastern Mediterranean Sea mud volcanoes and their possible relation to gas hydrate destabilisation.Earth and Planetary Science Letters,184(1), 321–338.
Bangs, N. L., McIntosh, K. D., Silver, E. A., Kluesner, J. W., & Ranero, C. R. (2015). Fluid accumulation along the Costa Rica subduction thrust and development of the seismogenic zone. J. Geophys. Res.Solid Earth,120, 67–86. https://doi.org/10.1002/2014JB011265 Bangs, N. L., McIntosh, K. D., Silver, E. A., Kluesner, J. W., & Ranero, C. R. (2016). A recent phase of accretion along the southern Costa
Rican subduction zone.Earth and Planetary Science Letters,443, 204–215.
Barry, P.H., de Moor, J.M., Giovannelli, D., Schrenk, M., Hummer, D.R., Lopez, T., et al. (2019). Forearc carbon sink reduces long‐term volatile recycling into the mantle. Nature, 568(7753), p.487.
Blum, P. (1997). Physical properties handbook: A guide to the shipboard measurement of physical properties of deep‐sea cores.College Station, TX: Ocean Drilling Program; Ocean Drilling Project Technical Note.
Bohrmann, G., Heeschen, K., Jung, C., Weinrebe, W., Baranov, B., Cailleau, B., et al. (2002). Widespreadfluid expulsion along the seafloor of the Costa Rica convergent margin.Terra Nova,14(2), 69–79.
Borowski, W. S., Paull, C. K., & Ussler, W. III (1999). Global and local variations of interstitial sulfate gradients in deep‐water, continental margin sediments: Sensitivity to underlying methane and gas hydrates.Marine Geology,159(1‐4), 131–154.
Cline, J. D. (1969). Spectrophotometric determination of hydrogen sulfide in natural waters.Limnology and Oceanography,14, 454–458.
https://doi.org/10.4319/lo.1969.14.3.0454
Coleman, M. L. (1993). Microbial processes: Controls on the shape and composition of carbonate concretions.Marine Geology,113(1‐2), 127–140.
Coleman, M. L., & Raiswell, R. (1981). Carbon, oxygen and sulphur isotope variations in concretions from the Upper Lias of NE England.
Geochimica et Cosmochimica Acta,45(3), 329–340.
Cornwell, J. C., & Morse, J. W. (1987). The characterization of iron sulfide minerals in anoxic marine sediments.Marine Chemistry,22, 193–206. https://doi.org/10.1016/0304‐4203(87)90008‐9
Crémière, A., Lepland, A., Chand, S., Sahy, D., Condon, D.J., Noble, S.R., et al. (2016). Timescales of methane seepage on the Norwegian margin following collapse of the Scandinavian Ice Sheet. Nature Comm.s, 7, p.11509.
Dewangan, P., Basavaiah, N., Badesab, F. K., Usapkar, A., Mazumdar, A., Joshi, R., & Ramprasad, T. (2013). Diagenesis of magnetic minerals in a gas hydrate/cold seep environment off the Krishna–Godavari basin, Bay of Bengal.Marine Geology,340, 57–70.
Dickens, G. R., & Quinby‐Hunt, M. S. (1994). Methane hydrate stability in seawater.Geophysical Research Letters,21, 2115–2118.
https://doi.org/10.1029/94GL01858
Egger, M., Riedinger, N., Mogollón, J. M., and Jørgensen, B. B. (2018). Global diffusivefluxes of methane in marine sediments. Nature Geosci., 11(6), 421.
Evrenos, A. I., Heathman, J. K., & Ralstin, J. (1971). Impermeation of porous media by forming hydrates in situ.Journal of Petroleum Technology,23(09), 1–059.
Acknowledgments
We thank the officers and crew as well as the drilling personnel and the scientific parties of IODP Expedition 334 and 344. This research used samples and data provided by the IODP, which is sponsored by the U.S.
National Science Foundation and participating countries and universities under management of IODP Management International, Inc. All data analyzed on board the D/V Joides Resolution during expedition IODP 334 are available via the IODP database LIMS. All other data are available in the supplemental material and archived in the World Data Center PANGAEA.
This is an Oklahoma State University‐
Boone Pickens School of Geology contribution 2019‐106. The research was funded by USSSP post‐expedition (Expedition 334) awards T334B11 to Marta Torres and T344A28 to Elizabeth Screaton. Steffen Kutterolf kindly thanks the German Research Foundation for funding CRISP related research (Ku‐2685/2‐1&2). We are indebted to S. Bates and E. Goldbaum for their assistance in the lab and two anonymous reviewers are thanked for their valuable input, which improved the quality and clarity of this manuscript. Marta Torres and Natascha Riedinger gratefully acknowledge a fellowship of the Hanse‐
Wissenschaftskolleg (HWK, Institute for Advanced Studies), Delmenhorst, Germany, and Natascha Riedinger gratefully acknowledges the Shelia Seaman Writing Retreat: for women geoscientists. The authors declare that the research was conducted in the absence of any commercial orfinancial relationships that could be construed as a potential conflict of interest.