i
COST Action ES1405
Action Title: Marine gas hydrate – an indigenous resource of natural gas for Europe (MIGRATE)
Marine gas hydrate technology:
State of the art and future possibilities for Europe
February 2019
Cite as: Klar, A., Deerberg, G., Janicki, G., Schicks, J., Riedel, M., Fietzek, P., Mosch, T., Tinivella, U., De La Fuente Ruiz, M., Gatt, P., Schwalenberg, K., Heeschen, K., Bialas, J., Pinkert, S., Tang, A.M., Kvamme, B., Spangenberg, E., English, N., Bertrand, C., Parlaktuna, M., Sahoo, S.K., Bouillot, B., Desmedt, A., and Wallmann, K. (2019) “Marine gas hydrate technology: state of the art and future possibilities for Europe,” WG2 report, COST Action ES 1405, DOI: 10.3289/MIGRATE_WG2.2019
ii
Authors Institute, Country e-mail
Prof. Assaf Klar DTU, Denmark askla@byg.dtu.dk
Prof. Görge Deerberg Fraunhofer UMSICHT, Germany goerge.deerberg@umsicht.fraunhofer.de Dr. Georg Janicki Fraunhofer UMSICHT, Germany georg.janicki@umsicht.fraunhofer.de Prof. Judith Schicks GFZ Potsdam, Germany judith.schicks@gfz-potsdam.de
Dr. Michael Riedel GEOMAR, Germany mriedel@eps.mcgill.ca
Peer Fietzek Kongsberg, Germany peer.fietzek@km.kongsberg.com
Thomas Mosch Kongsberg, Germany thomas.mosch@km.kongsberg.com
Dr. Umberta Tinivella OGS, Italy utinivella@ogs.trieste.it
Maria De La Fuente Ruiz Univ. Southampton, United Kingdom mdlf1g15@soton.ac.uk
Dr Peter Gatt MCAST, Malta peter.gatt@mcast.edu.mt
Dr. Katrin Schwalenberg GFZ Potsdam, Germany Katrin.Schwalenberg@bgr.de Dr. Katja Heeschen GFZ Potsdam, Germany katjah@gfz-potsdam.de
Dr. Joerg Bialas GEOMAR, Germany jbialas@geomar.de
Dr. Shmulik Pinkert Ben-Gurion Uni. of the Negev, Israel pinkerts@bgu.ac.il Dr. Anh Minh Tang Ecole des Ponts ParisTech, France anhminh.tang @enpc.fr Prof. Bjorn Kvamme Univ. Bergen, Norway bjorn.kvamme@ift.uib.no Dr. Erik Spangenberg GFZ Potsdam, Germany erik@gfz-potsdam Prof. Niall English Univ. College Dublin, Ireland niall.english@ucd.ie
Dr. Chazallon Bertrand Univ. Lille, France Bertrand.CHAZALLON@univ-lille1.fr Dr. Mahmut Parlaktuna Dokuz Eylul University, Turkey mahmut@metu.edu.tr
Dr. Sourav Kumar Sahoo NOC Southampton, United Kingdom s.sahoo@noc.ac.uk Dr. Baptiste Bouillot Ecole des Mines de Saint-Etienne, France bouillot@emse.fr
Dr. Arnaud Desmedt CNRS - Univ. Bordeaux, France arnaud.desmedt@u-bordeaux.fr
Prof. Klaus Wallmann GEOMAR, Germany kwallmann@geomar.de
iii Contents
1 Introduction ... 1
2 Exploration ... 4
2.1 Basin Modeling ... 4
2.1.1 Petroleum Systems modeling and its premises for modeling gas hydrate scenarios ... 4
2.1.2 Characteristics of modeling gas hydrates... 5
2.1.3 Analyzing a petroleum system model showing gas hydrate accumulations ... 5
2.2 Geophysics ... 6
2.2.1 Seismic methods ... 7
2.2.2 2D & 3D high resolution reflection seismic imaging (P-Cable) ... 8
2.2.3 High resolution refraction seismic imaging (OBS) ... 10
2.2.4 Marine CSEM Methods... 12
2.3 Drilling ... 14
2.4 Logging techniques for marine gas hydrate occurrences ... 19
2.4.1 Basics and overview of field studies ... 19
2.4.2 Basic logging methods/proxies for gas hydrate ... 20
2.4.3 LWD and MWD operation ... 21
2.4.4 Wire-line logging operation ... 22
2.4.5 Vertical Seismic Profiling ... 22
2.5 Pressure coring and core-analysis devices ... 23
2.6 Core analysis and Petrophysics ... 25
3 Production technologies ... 27
3.1 Gas hydrate simulators and geomechanical aspects ... 28
3.1.1 Main features of the mechanical behavior of gas hydrate bearing sediments ... 30
3.1.2 Experimental investigations of geo-mechanical properties ... 32
3.1.3 Constitutive models for hydrate bearing sediments ... 34
3.1.4 Particle migration ... 39
3.2 Gas hydrates hosted in carbonate sediments ... 40
4 Monitoring ... 42
4.1 General ... 42
4.1.1 Basic Concepts of Modular and Scalable Monitoring Networks ... 43
4.1.2 Monitoring Technologies - Stationary Lander Systems and Point Sensors ... 44
4.1.3 Monitoring Technologies – Distributed Fiber Optic Sensing ... 47
5 Fundamental (multiscale analytical and experimental) research for progress towards future production ... 49
6 Summary, outlook and conclusions ... 51
7 List of figures ... 52
8 List of tables ... 54
9 References ... 54
1
1 Introduction
Interest in natural gas hydrates has been steadily increasing over the last few decades, with the understanding that exploitation of this abundant unconventional source may help meet the ever- increasing energy demand and assist in reduction of CO2 emission. The CO2 emission per energy unit produced by natural gas is significantly lower than similar energy produced by combustion of coal. The production of energy from hydrates requires special attention to the phase transition dynamics of hydrates and pore scale dynamics as well as higher reservoir dynamics. In any event, most of all conventional gas technology for completing the production system is well known technology. One of the main challenges is to address the dynamics of the hydrate phase transition as efficiently as possible. As such, the most important challenges related to production from hydrates is in the understanding of the multi scale coupled dynamics and how to perform efficient interactions with the in situ hydrates for technically, economically and environmentally safe production. Better understanding of the dynamic characteristics of the system within THMC simulations, will allow improvement of the technology chain, from exploration through production to monitoring; which appears to be less well developed for gas production from hydrate sediments. For any potential method of hydrate production or combined CO2 storage and production, it is critically important to develop a deeper understanding of the geomechanical implications. This would assist avoiding geohazards risks associated with future production wells, as well as assessment of natural occurring of geohazards situations.
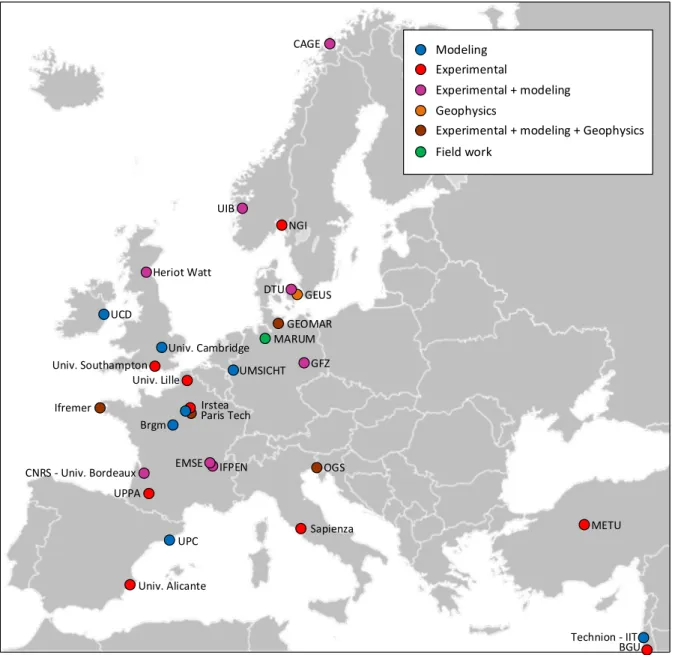
Various academic groups and companies within the European region have been heavily involved in theoretical and applied research of gas hydrate for more than a decade. To demonstrate this, Fig. 1.1 shows a selection of leading European institutes that are actively involved in gas hydrate research. A significant number of these institutes have been strongly involved in recent worldwide exploitation of gas hydrate. The most important worldwide tests and production sites are summarized in Table 1.1.
Despite the state of knowledge, no field trials have been carried out so far in European waters.
The MIGRATE project (COST action ES1405) aimed to pool together expertise of a large number of European research groups and industrial players to advance gas-hydrate related activity with the ultimate goal of preparing the setting for a field production test in European waters.
This MIGRATE report presents an overview of current technologies that are being used, and could be used, with relation to gas hydrate exploration (Chapter 2), production (Chapter 3) and monitoring (Chapter 4), with an emphasis on European activity. This requires covering various activities within different disciplines, all of which contribute to the technology development needed for future cost- effective gas production. The report points out future research and work areas (Chapter 5) that would bridge existing knowledge gaps, through multinational collaboration and interdisciplinary approaches.
2 Table 1.1: Completed field tests and production sites
Year Location Estimation of
hydrate saturation Description Duration
(h)
Total gas production (m3)
1970 Messoyakha Permafrost Pressure reduction Ongoing 5E9 (@1998)
2002 Mallik 5L-38, Canada
60-80% Thermal stimulation 124 470
2007 Mallik 2L-38, Canada
60-80% Short pre-test by depressurization 12.5 830
2008 Mallik 2L-38, Canada
60-80% Depressurization 144 13000
2011 Qilian Mountain, China
13-86% Depressurization + thermal stimulation 101 95
2012 Prudhoe Bay, Alaska
75% CO2-injection (N2:CO2 77:23%) by depressurization
936 24000
2013 Nankai Trough, Japan
40-70% Offshore field test by depressurization 144 120000
2017 Nankai Trough, Japan
40-70% Offshore field test by depressurization 288 200000
2017 Shendu, China 40-50% Offshore field test by depressurization 1440 300000
3
GEUS GEOMAR
UMSICHT GFZ
Univ. Southampton
Heriot Watt
UCD
NGI
MARUM
Ifremer
Technion - IIT BGU METU CAGE
Univ. Cambridge
Sapienza UIB
Modeling Experimental
Experimental + modeling Geophysics
Experimental + modeling + Geophysics Field work
UPC
Univ. Alicante UPPA
CNRS - Univ. Bordeaux Univ. Lille
EMSE Paris Tech Irstea
DTU
Brgm
IFPEN OGS
Figure 1.1: European institutes actively involved in gas hydrate research
4
2 Exploration
2.1 Basin Modeling
2.1.1 Petroleum Systems modeling and its premises for modeling gas hydrate scenarios Gas hydrates in sediments have a limited stability window controlled by pressure, temperature and concentration of all components in surrounding phases. This also includes the salt ions in water which so do not participate in fluid/hydrate phase transitions but affect water chemical potential and may also participate in geochemical reactions. Mineral surfaces always contain charged atoms which makes it impossible for hydrates to attach to mineral surfaces. However, mineral surfaces can act as catalyst in nucleation of hydrates. Hydrate existence and (distribution) is of interest for the oil and gas industry due to many reasons. Gas hydrate accumulations might become a source of energy. Other aspects of hydrates in reservoirs are related to their thermodynamic instability. This includes aspects of geohazard as well as natural hydrocarbon seepage through incoming ocean water through fractures.
Since hydrates in sediments are unable to reach thermodynamic stability they reside in a state of stationary situation of balance between thermodynamics and various regions of flow (diffusion and hydrodynamics). Their existence depends on sealing structures through layers of clay, shale and other impermeable sediment structures. In permafrost the existence of ice also slows down the hydrate dissociation although ice can form hydrate from hydrocarbons and other hydrate formers.
Most natural gas hydrates worldwide are of biogenic origin and generated from biological degradation of organic material in the upper crust. These hydrates are almost pure methane hydrates. The second source of hydrocarbon supply is from thermogenic degradation of old fossil material in deep sediments. These hydrates include various hydrocarbons and different structures of hydrates.
Frequently they also contain CO2 and H2S.
For hydrate production evaluation the dynamic supply of biogenic and/ or thermogenic hydrocarbons during the last couple of hundred years and prediction of future supply is more important than the geological time scale history.
The more historical development during the geological time scales will of course bring other types of information and may assist in explaining distributions of gas hydrates as well as connection to conventional hydrocarbon accumulations.
The ambition is to be able to simulate both the history of gas hydrate development to current state and to predict future changes. Comparison of predicted events versus retrospective actual historical data will allow for model validation. Future better understanding of the hydrate dynamics is imperative for successful basin modeling, and will allow jettisoning the currently used methods based heuristic understanding.
5 2.1.2 Characteristics of modeling gas hydrates
The thermal and pressure conditions which control the presence and extent of a gas hydrates stability zone (GHSZ) can change rapidly through geological time. As a result, a GHSZ can be created and then disappear again in cycles of thousands or even hundreds of years. In addition to this the geological sediments structure changes due to natural creation of faults and fractures that bring the hydrate in hydrate-bearing sediment in contact with the undersaturated phases. The most typical is that new fractures results in inflow of groundwater or seawater with little or no dissolved hydrate formers.
Hydrate can also dissociate by contact with gas which is undersaturated with water.
For the geological time scale evaluation there are modelling tools like for instance PetroMod. See section 2.1.3 for geological time scale and PetroMod specifically. For production strategy, studying case histories of the last few decades is far more important for future estimates.
The nature of charged atoms in mineral surfaces makes it impossible for hydrate to attach to mineral surfaces so hydrate will always be pore filling and can never be cementing in a true sense. That means that the impact of mineral surfaces and hydrate surfaces as well as molecular diffusion will result in free water separating hydrate and sediments. This is the reason that even permafrost hydrates rarely have more than 80% hydrate saturation.
When free gas migrates into the GHSZ, gas hydrates form in the pore space and change the bulk properties of the surrounding lithology. This affects the thermal properties, as the hydrate fills the available pore space with material that has different properties than water. That means that efficient porosity in the sense of available volume for fluid flow is a very complex balance between thermodynamically control factors and local flow. Similarly, permeability is far more complex than conventional hydrocarbon systems. At this point a multiscale modeling approach might be the best way to generate new correlations for the systems. Possible platforms for this could be hydrodynamic modeling with realistic sand packing models from fundamental experiments, like for instance CT scanning and kinetic models for hydrate phase transition. Alternative platforms could be density functional theory or phase field theory with included hydrodynamics and heat transport modeling.
Such more rigorous approach will help to improve basin modeling.
2.1.3 Analyzing a petroleum system model showing gas hydrate accumulations
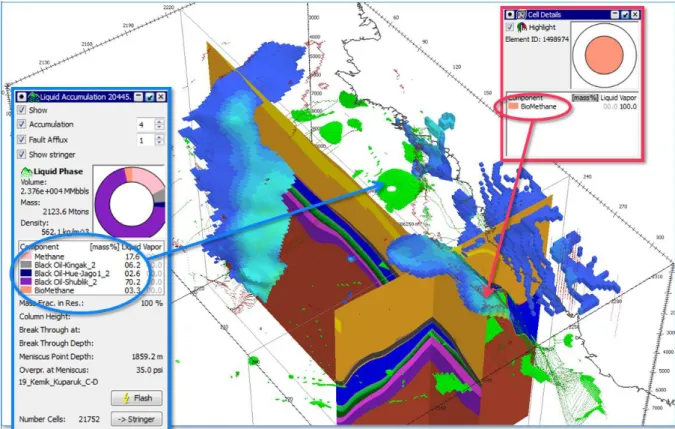
While significant work is still required to developed rigorous basin simulators, certain estimates can be made using modification of existing basin models. For example, PetroMod has been used for 3D modeling of the Alaska North Slope (Pinero et al., 2011). In principle, PetroMod can track the generation, migration and accumulation of single hydrocarbon components, and therefore it is also possible to follow the pathways of a hydrocarbon component of interest through space and time. Fig.
2.1 shows a PetroMod 3D model located within the Alaska North Slope. Therein conventional as well as gas hydrate accumulations can be observed. Furthermore, it is shown that a biogenic methane fills up the gas hydrate accumulations while the conventional accumulations are dominated by thermogenic methane.
6
Using PetroMod as a working example, there are several straightforward ways in which it could be improved pending the development of new models with greater physical rigour, as mentioned earlier.
For example, direct consideration of the hydrate as another phase in the system and adding hydrate dependent constitutive model for the mechanical response.
Figure 2.1: Alaska North Slope 3D petroleum systems model showing gas hydrate accumulations (blue) in the GHSZ, conventional accumulations (green) and tracked biogenically vs. thermogenically sourced methane.
2.2 Geophysics
Usually gas hydrate reservoirs are found at continental slopes where seafloor dips towards the abyssal plains (Kvenvolden, 1993; Wallmann et al., 2012). Natural gas expulsion points towards larger accumulations of free gas as a first hint for possible hydrate reservoirs (Judd and Hovland, 2007). Water column imaging capabilities developed for multibeam acquisition systems nowadays allow a rapid mapping of prospective areas (Schneider von Deimling and Papenberg, 2012). However production of hydrate reservoirs (Wallmann and Bialas, 2009) need to be well separated from natural leakage systems to avoid uncontrolled elusion of gas. A reasonable sealing overburden need to be confirmed to protect against formation of artificial leakage out of the reservoir once hydrate dissolution has been stimulated. With respect to optimal production rates of dissolved methane porosity of hydrate bearing layers is another issue. Therefore, coarse grained sandy reservoir rocks overlain by clay provide the best environment. Due to the unconsolidated sediment matrix of the host rock, slope stability is an issue in terms of seafloor installations and possible deepening of the seafloor above the production site (Zander et al., 2017).
7
Geophysical investigations provide a key technology aiming for lateral imaging of dedicated gas hydrate reservoirs, distribution of free gas and related migration pathways. Thereby geophysical techniques try to make use of the anomalous physical properties related to emplacement of gas hydrates (increased sound velocities, increased density, modified elastic modulus, increased resistivity) and free gas (reduced sound velocity, reduced density, modified elastic modulus, increased resistivity) compared to the unaltered matrix sediment. The most sensible tools available for the remote and areal observation of these physical parameters are seismic and controlled source electromagnetic measurements.
2.2.1 Seismic methods
A first identifier for gas hydrate occurrence is the bottom-simulating reflector (BSR) (Kvenvolden, 1988;
MacKay et al., 1994). The BSR is caused by the negative impedance contrast caused by free gas accumulated underneath the gas hydrate seal above (MacKay et al., 1994). Thereby the BSR documents the lower boundary of the gas hydrate stability zone (GHSZ). These events are visible in standard exploration configurations with low source frequencies (e.g. large airgun arrays, up to about 100 Hz) and standard multichannel streamer (MCS) configurations (min. 12.5 m group offset). However improved resolutions like vertical seismic profiles (VSP, onshore examples) show lateral variations in reflection strength and continuity of the BSR (Bellefleur et al., 2006). Due to increased source frequencies (up to about 350 Hz) and increased streamer resolution (group offset of 1.5 m) such effects become visible in marine data as well. Focusing on the production of gas hydrates the plumbing system of methane is of high importance. Not only the provision of free gas for the hydrate formation but also natural gas migration pathways are important to judge on the tightness of the desired reservoir (Koch et al., 2016; Krabbenhoeft et al., 2013). 3D high resolution seismic imaging tools like the recent P-Cable development are capable to provide migrated sub-bottom images down to 6 m by 6 m gridded volumes (Bialas, 2013; Bialas and Brückmann, 2009; Petersen et al., 2010). Such volume observations are required to estimate hydrate distribution and hence available volumes as well as to investigate vertical migration pathways through the GHSZ. Due to their gas content, such chimneys are described as blanking zones on seismic sections. They may link the BSR to active gas expulsion sites at the seafloor bypassing free gas through the hydrate stability field (Hustoft et al., 2009; Judd and Hovland, 2007;
Klaucke et al., 2015; Koch et al., 2016; Talukder, 2012). They may occur at the top termination of open fractures now originating within the GHSZ and they may be terminated by inverted reflection events well beyond the seafloor when the gas transport got stuck for various reasons (Koch et al., 2016; Plaza- Faverola et al., 2014). During gas production chimneys could result into uncontrolled gas emissions and need to be avoided. As the vertical orientation might not be straight, 3D images are required in order to not lose track of such structures when investigating a possible production site.
Another approach in 2D seismic investigations is the application of deep towed multichannel streamers. The idea is to increase resolution by reducing the offset between receiver and target (Breitzke and Bialas, 2003; Talukder et al., 2007) or both source with receiver and target (Gettrust et al., 2004; Marsset et al., 2014). Thereby reducing the Fresnel Zone the lateral resolution is increased.
In addition hybrid systems using surface towed sources and deep towed multichannel streamers provide wide-angle reflection surveys, which enable to undershoot strong reflecting near surface structures (Breitzke and Bialas, 2003). This ability allows to image vertical migration pathways
8
underneath possible gas accumulations in their chimney top. Combined systems of deep towed source and receiver on the other hand allow the use of higher frequent sources (Marsset et al., 2014), which usually provide lower energy than standard airgun sources. However, due to the reduced offset penetration it is good enough to image gas hydrate relevant structures with increased vertical resolution.
Besides reflection seismic characterization, sound velocity anomalies are a second criterion to judge on free gas and hydrate distribution in the sediment. While short active length multi-channel reflection seismic streamers (in 2D and 3D) are already capable to provide the required images, by use of mid size multi purpose vessels they are usually not sensible enough to velocity. This gap can be closed by use of ocean-bottom seismometers (OBS) (Crutchley et al., 2016; Petersen et al., 2007). Equipped with 4 component receivers they provide wide reflection and refraction observations not only for compressional waves (Vp) but for converted shear waves (Vs) as well (Bialas et al., 2017; Granli et al., 1999; Lee and Collett, 1999). Usually deployments of OBS take place together with 2D and 3D profiling above gas hydrate reservoirs. Depending on water depth and lateral offsets refraction events are usually expected for layers beyond the BSR and the interpretation of OBS events will concentrate on wide angle reflections. Correlations of OBS and MCS data enables safe identification of major interfaces and guides the definition of a starting model for the velocity-depth distribution used to invert for the observed travel times. Velocity anomalies coincident with increased reflection amplitudes provide first hints for possible hydrate or gas accumulations. Further information on physical parameters are available when converted shear wave events are provided by seismometer records. Different dependency on elastic moduli allow to further discretize on free gas and hydrate distribution (Yun et al., 2005). Increasing precision on navigation, dense shot coverage and observation of 3D airgun signal generation allow for 3D inversion of OBS data, supporting the volume analyses of velocity anomalies and implied gas and hydrate distributions. Modern parallel node computing clusters allow employment of new processing technologies like full-wave form inversion (Pecher et al., 1996;
Virieux and Operto, 2009) for OBS data as well. Hereby ray tracing based velocity models are required as detailed starting models in order to further improve the velocity depth resolution.
2.2.2 2D & 3D high resolution reflection seismic imaging (P-Cable)
A new high-resolution multichannel reflection seismic tool has been provided by the invention of the so called P-Cable (Plancke and Berndt, 2002) acquisition system. The P-Cable allows for three- dimensional seismic imaging of the shallow horizons with increased resolution (6 m by 6 m) operating from a non-specialized vessel with small crew.
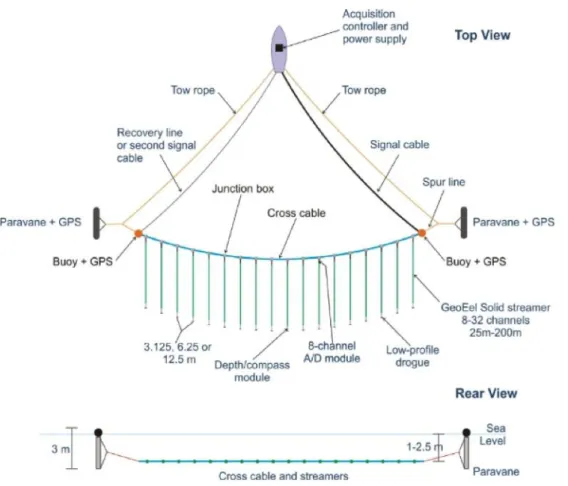
Compared to standard reflection seismic applications in 2-D and 3-D the basic difference is that the P- Cable is built by a cross cable towed perpendicular to the ships heading (Fig. 2.2). Instead of a few single streamers the P-Cable uses a large number of short streamer sections towed parallel from the cross cable. Drawback is the limited depth penetration due to the short offsets, which limits removal of multiple energy. This is well compensated by the reduced costs of the system and the ability to operate it even from small multi purpose vessels, the usual academic platform for marine research.
9
Figure 2.2: Schematic drawing of a P-Cable deployment. Descriptions in the figure identify the best grade of configuration in terms of navigation aids and hence resulting resolution. However minimum request are GPS recordings from the paravanes in order to calculate the cross cable layout. (courtesy of GEOMETRICS, USA).
Positions of the trawl doors with real coordinates and relative distance to the vessel are provided within an online navigation package. Autonomous GPS receivers were mounted on each trawl door together with a serial radio link to the vessel. Depending on the grade of configuration compass and/or depth readings at each streamer breakout point maybe provided as well. Based on these information navigation processing attempts to best calculated the layout of the cross cable and adjacent streamer sections for each shot. In general, a catenary geometry fits the curvature of the cross cable best.
Standard filter and deconvolution routines prepare the data volume for a 3D migration.
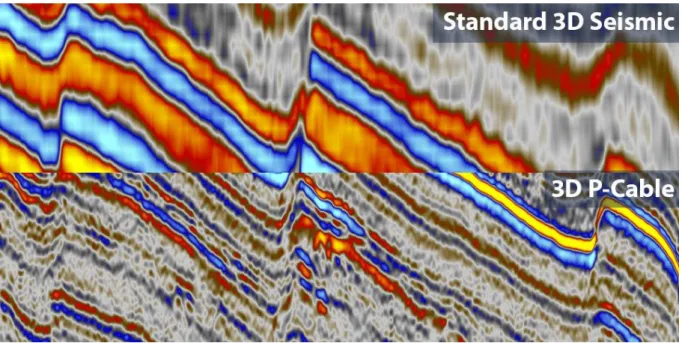
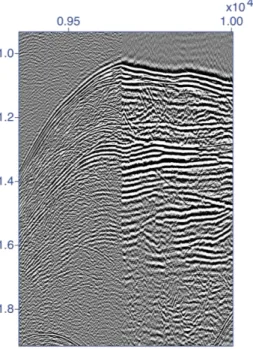
Resulting seismic sections from the 3D data volume provide a much more detailed image of subsurface structures like gas chimneys and sedimentary interfaces than conventional data do (Fig. 2.3 (Petersen et al., 2010)). Such resolutions are required to map out BSR distribution and continuity in the hydrate stability field. Knowledge of gas migration pathways is a prerequisite in description and safety assessment of a possible GH reservoir in order to avoid uncontrolled gas emissions during production.
10
No other system can provide such information with reasonable resolution. However, one drawback is the missing sensibility of the short offset streamer segments to the velocity field in the subsurface.
Stacking and migration of the data need to be done for near vertical reflection points only and hence can be completed with water sound velocities. Observation of the seismic signals by a suitable number of Ocean-Bottom Hydrophones (OBH) or four component Seismometers (OBS) can provide this information.
Figure 2.3: Comparison of standard 3D seismic and 3D P-Cable data from overlapping records (courtesy WPG exploration Ltd., http://www.wgp-group.com; p-Cable Spring Energy report)
2.2.3 High resolution refraction seismic imaging (OBS)
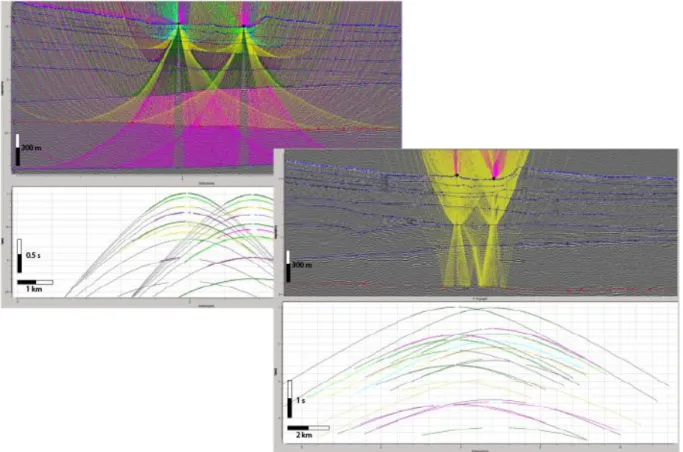
Besides reflection seismic events (increased amplitudes, inverted amplitudes, BSR, etc.) seismic velocity anomalies (p- and s-wave) and corresponding Poisson’s ratios may further support identification of gas or hydrate distribution (Tinivella and Accaino, 2000). Simultaneous recording of multichannel and ocean-bottom seismometer data allows correlation of events from reflection seismic images with near vertical reflection events from OBS records (Fig. 2.4). Thereby travel-time picks taken from the OBS records for velocity depth model development can be chosen to fit to the major sedimentation packages already. Overlay of the resulting velocity – depth model with multichannel seismic sections will further support the interpretation of hydrate and free gas distribution in a reservoir environment. Besides standard ray tracing and tomographic inversion routines full-waveform inversion (Virieux and Operto, 2009) has been extended to refraction seismic applications and supports more detailed inversion models in future time.
11
Figure 2.4: Correlation of near vertical reflection events recorded by an Ocean-Bottom Seismometer (OBS,; left hand) and the corresponding multichannel seismic section.
Based on significant impedance contrasts across sediment interfaces compressional waver energy converts partly into shear wave components, which were recorded by horizontal receivers of the seismometer components of the OBS. Due to the unknown orientation of the seismometer all three components need to be evaluated for their amount of shear wave energy, which results in energy rotation processing prior to analyses of the radial horizontal component (Wang et al., 2014). For the interpretation a p to s conversion is assumed to happen at the reflecting sediment interface (Zillmer et al., 2005). Other assumptions could solve the observed travel-times but require unreasonable low velocities. Due to the high attenuation of shear waves in unconsolidated sediments high Vp/Vs ratios are indicative for the expected low shear wave velocities. Consequently, angles of refraction and reflection are small compared to p-wave expansions and therefore the portion of sub-surfaces structures imaged by converted shear waves are smaller than by p-waves (Fig. 2.5). Usually the sensor distribution is optimized for p-wave recordings resulting in gaps of s-wave coverage. As a result, Vs
model development for the entire profile results in significant smoothing. Detailed analyses and interpretation of conventional shear wave data either request optimized (shorter offset) sensor distribution or localized analyses (Fig. 2.5).
Based on velocity anomalies first estimates on hydrate and free gas distributions along the BSR and within the hydrate stability zone are undertaken. Without additional information such estimates can be of qualitative value only as a deduction of hydrate saturations strongly depend on the formation process. In case of sediment matrix supporting hydrate formation the elastic moduli and hence Vp and Vs are much stronger influenced than with hydrate grains in the pore space (Chaouachi et al., 2015;
Priest et al., 2009). Making use of their different relation to physical parameters correlation of seismic velocity models with electromagnetic investigations (CSEM) provide additional information. Coupling
12
seismic and CSEM investigations by transverse functions for their model space enables joint inversion with much more detailed information about physical parameters (Heincke et al., 2017) in future time.
Figure 2.5: Examples of Vp (upper left) and Vs (lower right) ray coverage of subsurface structures. Ray paths used for the inversion of OBS data are overlain on reflection seismic images used to identify the relevant sediment interfaces. Due to the low shear wave velocity reflected converted waves can image smaller parts of the model space only. However they can contribute to detailed investigations of velocity anomalies and hence physical parameters. Picked (black) and computed (colored) travel-times are displayed beyond the seismic sections (Bialas et al., 2017).
2.2.4 Marine CSEM Methods
Additional information on hydrate and gas distributions are provided by application of marine controlled source electromagnetic (CSEM) methods (Attias et al., 2016; Hölz et al., 2015). Electrical resistivity derived from CSEM data is sensitive to porosity and the electrical properties of the pore fluid. As free gas and gas hydrate are electrically resistive, the replacement of saline and therefore conductive pore fluids by resistive gas and / or gas hydrate increases the formation bulk resistivity.
Discrimination between free gas and gas hydrate from electrical resistivity requires additional information from e.g. seismic and knowledge of the geological setting. Within the gas hydrate stability zone, free gas will be consumed by gas hydrate formation as long as the gas content exceeds the solubility of gas and sufficient water is supplied. According to Liu and Fleming (2007) free gas and gas hydrate may coexist within the GHSZ when i) the gas flow and gas pressure from below the GHSZ is
13
accordingly high, often indicated by sub-vertical chimney structures in reflection seismic images. ii) when all water is depleted due to concentrated hydrate formation, or iii) upward perturbation of the P-T boundary caused by advecting warm fluids.
Small gas and gas hydrate saturations (saturation defined as percentage of pore volume opposing to concentration defined as percentage of sediment volume) in the order of a few percent may scatter and blank out reflection seismic signals. In contrast, large volumes of gas and gas hydrate in the order of >10-20 % are required to significantly increase the bulk resistivity derived from CSEM leaving smaller saturations subject to possible misinterpretation due to lithology-controlled porosity changes.
Electromagnetic field propagation is a diffusive process. Thus, CSEM measurements provide volume information useful for resource assessment and lack detailed structural resolution. This promotes the combination of seismic and CSEM methods, as they are complementary with respect to their information content.
Marine CSEM Instrumentation
Both time domain and frequency domain CSEM systems have been developed using either magnetic or electric source and receiving dipoles close or on the seafloor. The first marine CSEM experiments for the exploration of submarine gas hydrates have been conducted with a time domain, seafloor- towed, electric dipole-dipole systems developed at the University of Toronto (Edwards, 1997) measuring the inline component of the electric fields at offsets of up to 600m sensitive to sediment depth of ~200-300m. First case studies have been reported by Yuan and Edwards (2000) and Schwalenberg et al. (2005, 2010a, 2010b). An advancement of the Toronto system is the HYDRA system developed at the Federal Institute for Geosciences and Natural Resources (BGR). HYDRA is a modular, seafloor-towed electric dipole-dipole system with four or more receiver dipoles at offsets up to 1000m.
It has been recently updated to allow online communication and data transfer during deployments.
Data have been collected over gas hydrate targets offshore New Zealand (Schwalenberg et al., 2017) and in the Black Sea (Schwalenberg et al., 2016).
A smaller seafloor-towed magnetic dipole-dipole system with short offsets up to 40m has been developed at the Woods Hole Oceanic Institute (WHOI), and has been used at a gas hydrate mound in the Gulf of Mexico (Ellis at al., 2008).
The advantages of the seafloor-towed systems are that they can be operated with a small team, surveys can be adapted to smaller scale targets, navigation errors are minimized, and data analysis is straight forward. The disadvantages are the risk of damage to or loss of the system or parts of it, thus surveys are limited to rather smooth sediment (which is typically the case along continental slope areas).
The nowadays most commonly used marine CSEM approach for gas hydrate research has been pioneered by Scripps Institution of Oceanography, and is an adaptation of the experimental setup used in the offshore oil and gas industry (Constable, 2010). This setup includes a number of stationary seafloor ocean bottom electromagnetic (OBEM) receivers deployed from the vessel along a survey line or on a 3D grid, and a CSEM transmitter with a horizontal electrical source dipole, typically 50-200m long, towed by the research vessel about 50 to 100m above the seafloor. Frequency domain data are collected using a modulated wave form (e.g. Myer et al., 2010), and inverted to 2D and 3D resistivity
14
models using various transmitter-receiver offsets corresponding to different penetration depth. Gas hydrate case studies using this setup have been published by e.g. Weitemeyer et al., (2006, 2010, 2011), Goswami et al., (2015), and Attias et al., (2016). The advantage of this setup is that large areas can be covered and penetration depth can be more than 1000 to 2000m below seafloor. Also inline and broadside data can be collected using both orientations of the OBEM receiver dipoles. The disadvantage is that navigation errors can be severe, particularly at smaller offsets, and small-scale features, i.e. local gas hydrate accumulations, may be overseen.
An advancement is the Vulcan system developed at Scripps (Constable et al., 2016) consisting of one or more three-axial electric dipole receivers towed in the water at offsets of some hundred meters behind the source dipole. This setup allows a quick survey progress and penetration depths down to
~1000m of sediments. Gas hydrate case studies have been reported in Weitemeyer et al. (2010), Goswami et al., (2015), Attias et al., (2016), Constable et al. (2016).
A rather unique CSEM setup for gas hydrate exploration has been developed at GEOMAR using stationary seafloor electromagnetic (OBEM) receivers deployed on a 2D line or 3D grid at short offsets, and a mobile CSEM source called Sputnik with two 10m long horizontal source dipoles. Sputnik is powered and communicates via the deep tow cable which is used to move it along the seafloor by lifting up and down the deep-tow cable. The advantage of this setup is a detailed and small-scale 2D or 3D data set focusing of target areas of particular interest. The disadvantage is the navigation, i.e.
transmitter receiver offsets and orientations must be known accurately.
In summary, various CSEM experimental setups exist capable to focus on different aspects of the gas hydrate stability field. CSEM data analysis and interpretation has been significantly improved since 2D inversion tools (e.g. Key et al., 2016) and 3D forward modeling codes have become available. Joint interpretation of marine CSEM and seismic data highly improves the conclusions on gas hydrate resource assessments. While density is a joint physical parameter in the equations solving model calculations for seismic velocity and CSEM data joint inversion of these data sets data is a key to further constrain resource assessments (Abubakar et al., 2012; Hu et al., 2009).
Laboratory experiments on hydrate formation models further guide how to translate velocity anomalies into hydrate and gas concentrations. As relations of velocity and concentration are significantly different depending on the relevant hydrate formation model (pore filling, matrix supporting) in situ calibration information is necessary (Jing and Xuewei, 2011; Lee and Collett, 1999).
2.3 Drilling
The drilling process itself is only a part of the final construction of a wellbore. The long-term use of the wellbore and its safe operation require pipes which are introduced and cemented within the sediment formation. The structure of the well must withstand the pressure difference between the wellbore (e. g. hydrostatic and drilling fluid pressure) and formation (formation pressure) which develops throughout the exploitation process. Along the wellbore path, both horizons with overpressure (potential fluid inflows from formation) and horizons with underpressure (drilling fluid losses to the
15
formation) may exist and must be managed specifically to adapt the drilling parameters accordingly.
The drilling of the well should therefore be planned in accordance with the anticipated conditions.
Common state-of-the-art drilling methods from the oil and gas industry are (i) rotary drilling, (ii) coiled tubing drilling (CTD), (iii) jetting and (iv) casing drilling. All of these drilling methods may be used for drilling a vertical well or in case of directional drilling. This document extends briefly on the first two methods.
The rotary drilling method is characterized by a rotating drill string and a circulating drilling fluid (liquid and gaseous and mixtures of fluids and solids). The drill string connects between the drilling tool at the downhole and the drilling rig at the surface. Typically, it consists of individual drill pipes and is, therefore, also called jointed pipe. A very simple drill string for a vertical well consists of (from the bottom up): drill bit, drill collars (DC), heavy weight drill pipes (HWDP) and drill pipe (DP). The drill pipe is connected to the rotary drive/drill floor of the drilling rig at the surface. The standard length of a drill string component is about 10 m (33 feet). A continuous circular motion of the drilling bit (fixed cutter, roller cone or hammer bits) causes breakage of the formation (cuttings) at the bottom of the borehole.
In a closed circuit, (fresh) drilling fluid is pumped down (inside) the drill pipe to the bit where it removes the cuttings from the borehole and carries them through the annular space between the pipe and borehole wall to the surface. Drilling fluid on the surface is processed and injected back into the drill pipe. Recycling, treatment and conditioning of drilling fluids are appropriate measures to minimize operational costs.
In contrast to standard rotary drilling with jointed pipes, during coiled tubing drilling (CTD) no assembling of individual drill pipe components is necessary. Therefore, once started, the drilling fluid flow cannot be interrupted. Thus, the CTD method is significantly faster than rotary drilling (two to three times) and reduces the running costs compared to the jointed pipe method. As the drill string of a CTD cannot be rotated, a bottom hole assembly (BHA) must be attached to control the drill head. In many cases, the BHA is similar to that for jointed pipe and consists of (from the bottom up): drill bit, drill motor (with orienting tool), usually MWD (measurement-while-drilling) and LWD (logging-while- drilling) devices (see below) and stabilizers. Drill collars or HWDPs can only be installed directly above the BHA. Therefore, it is difficult with directional drilling to apply pressure on the drill bit. The removal of cuttings through the annulus may be hampered by the lack of rotation especially in deflected wellbores, so that the tubing sections may get stuck. CT drill strings have substantially smaller diameter than jointed pipes. CTD is also ideal for underbalanced drilling as the drill string is a closed system and, therefore, produced reservoir fluids cannot escape to the string. A CT-well can only be as long as the tubing itself. The length of the tubing sections of the coil depends on the diameter. Thinner tubing decreases the horizontal drilling distance.
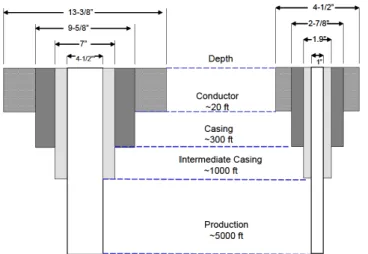
In general, wellbores are planned and completed according to the geological profile assuming a certain depth and diameter of the final casing. The geological profile is used to identify problematic horizons (aquifers, formations with overpressure or underpressure, unstable horizons etc.) that need to be isolated resulting in a specific well construction (Fig. 2.6). Normally, it consists of standpipe, conductor pipe, functional pipe strings as needed and production casing string.
16
Figure 2.6: Illustration of a vertical wellbore completion. Conventional (left) and CTD (right) (Perry et al., 2006).
In the well construction process, the selected pipe strings are cemented in the sediment one after the other, leading to a "tight" structure. Individual cement layers must overlap. The outer diameter of the string and the drill bit diameter are standardized by the API (American Petroleum Institute). While the initial diameter of the wellbore depends on the geology, the final depth and diameter are determined by the expected production rate and the specific application. For example, exploration wells are completed with special measuring devices at the depth of the deposit to be explored. Therefore, they usually have relatively large diameters. Oil and gas wells often have end diameters of 6 or 8½ inches.
Smaller diameters (e.g. 4") are mostly used for re-entry drilling (sidetrack). In addition, so called slim- hole or micro-hole wellbores with diameters of ~1 to 3 inches exist and have already been realized with CTD to a depth which is usually sufficient for the exploration of gas hydrate.
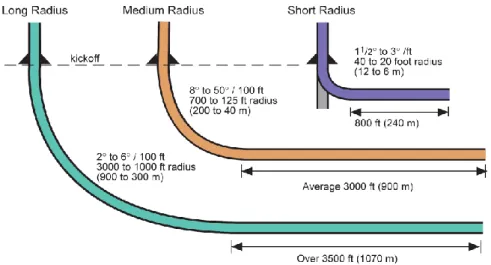
In the past, directional drilling became a state-of-the-art method to control a wellbore trajectory, to drill complex geological structures and to make previously unreachable reservoirs accessible. The directional drilling includes a controlled drilling to follow a desired wellbore pathway. This can be implemented differently, e.g. with steerable drill motors (Push-the-Bit, Point-the-Bit) or by mechanical devices within the drill string (whipstock). Due to the high costs of a deep well, new techniques are being developed to increase the productivity of a single wellbore. Fig. 2.7 shows possible well profiles (short, medium, long). However, drilling very small radii is restricted because of the limited ability to withstand the high forces (flexural and frictional) that develop. Very sensitive sensors may detect minimal deviations from the planned pathway and are adjustable to maintain the planned wellbore trajectory very accurately. In general, one may say that a larger well diameter increases the radius of a directional well.
17
Figure 2.7: Schematic diagram of directional drillings (Jahn et al., 2008, Hydrocarbon exploration and production).
Drilling through, and into, a gas hydrate formations entails special requirements on the drilling fluids and the sealing between the well and the formation. If directional drilling is the only feasible economic alternative, the formation structure has to be stable in both the drilling stage and later at the production phase. Currently, there is a lack of corresponding geological and geophysical evaluations.
Moreover, simulations of the mechanical stressing of gas-hydrate horizontal wells infer that the stressing mechanism may be significantly different from that of conventional horizontal wells (e.g. Klar et al., 2010).
In some cases, where the geomechanical properties of a gas hydrate deposit allow, the application of hydraulic stimulation might be considered. The effect of this would be to effectively create extra permeability around the existing wellbore allowing access to a greater volume of hydrate-rick sediment and also allowing faster production of released gas.
The navigation of the drill bit requires the availability of numerous measurement techniques and high- tech instruments. Among others, MWD and LWD are common. Usually, modern downhole instruments are optimized combinations of MWD and LWD devices, and include additional sensors for temperature, pressure and vibration, and others for data measurement allowing fast and safe drilling.
In addition to indirect methods, in-situ measurements during the drilling phase can give immediate information about geological properties of the sediment. Thus, required data for gas hydrates in the sediment can be collected. LWD and MWD are both tools that are installed within the drill string and take measurements at each survey. In contrast to MWD, which determines the position of the wellbore (geometrical navigation), LWD measures formation properties (formation evaluation). LWD allows an exact identification of the deposit, even if its position has been known only roughly before the beginning of drilling (e.g. from seismic surveys and exploration drilling). LWD also enables navigation within the deposit based on reservoir properties (geosteering). Geosteering, with horizontal well, is a state-of-the-art tool for the exploitation of thin deposit layers. Moreover, natural gamma ray, resistivity log as well as measuring devices with radioactive sources (gamma ray, neutron porosity tool) are standard tools for deep drilling. Due to the high safety requirements for using radioactive sources they are, however, only used when absolutely necessary. Other available equipment on the market
18
are the NMR (nuclear magnetic resonance), Sonic logs or Acoustic Well Log and formation tester and sampler as well as radar navigation and data transmission for control of the drill bit (for directional drilling). All of these methods are also suitable for detection of gas hydrates in sediments, and provide reliable results. Development of, modern technology will facilitate access to gas hydrate layers of several meters in shallow depths, either. In summary, one may say that a combination of several measuring method is crucial for a safe identification of gas hydrate layers. The required instruments are state-of-the-art and already available on the market for common wellbore diameters (~ 5'').
Possibly, special equipment must be built for slim-hole or short radius applications.
Since the drilling is one of the major cost factors in the production of natural gas and, in particular, from gas hydrates, new lightweight and very flexible subsea rigs need to be developed. Supposedly, none of the gas hydrate deposits will provide high coherent gas reserves, and low production rates can be expected only on a temporary basis. Consequently, appropriate considerations for effective drilling techniques need to be made, and Europe has at least two such systems:
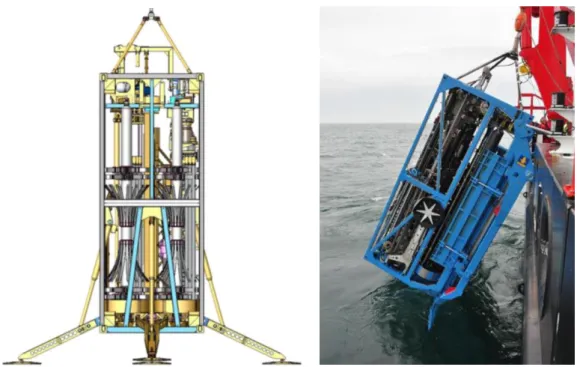
1) The MeBo200, developed by Bauer Maschinen GmbH and MARUM (Figure 2.8), may be valuable tool of an effective solution scheme.
Figure 2.8: Sketch of the MeBo200 developed by MARUM and BAUER Maschinen GmbH (left) and deployment of the MeBo200 (right) (Spagnoli et al., 2015).
In order to avoid the time-consuming assembly of a drill string from the drillship to the seafloor, it is preferable to use drill rigs placed on the seafloor, which safe time and costs. The MeBo200 drilling rig will may be lowered to the seafloor and operate remotely from the ship, drilling up to 200m into the seafloor. The MeBo200 does not require a special drill ship, as the rig itself has the size of a 20 ft container. It is equipped with a rotary drill head and a carousel storage and handling system for drill rods. The drill rods are taken from the carousel and inserted successively into the drill string. Thus, the wellbore can be drilled in several sections directly from the seafloor, and, consequently, the drilling process becomes more cost-effective
19
and independent from bad weather conditions (wind, currents, and waves). The MeBo200 has already been used successfully for coring sediments containing gas hydrates. (Spagnoli et al., 2015).
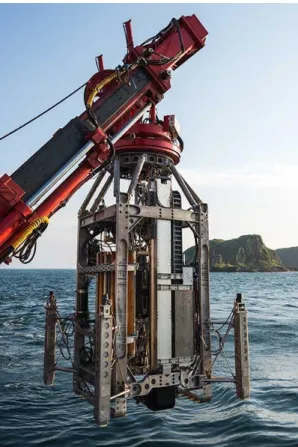
2) The BGS Rockdrill (RD2), seen in Fig. 2.9, is capable of coring up to 55m below sea floor in water depths up to 4000m and is operated via its own launch and recovery system (LARS). The system can continuously core in 1.7m sections, and can be outfitted with additional sensors such as gas-flow meters and down-hole logging tools. RD2 has been used to sample hydrate-entrained sediments from the Sea of Japan in 2013. The maximum coring depth achieved was 32m below sea floor and the system can operate for more than 50 hours on a single deployment
Figure 2.9: The BGS RD2 System being deployed using dedicated Launch and recovery system
2.4 Logging techniques for marine gas hydrate occurrences 2.4.1 Basics and overview of field studies
Dedicated gas hydrate drilling has started with the recognition of the wide-spread abundance of gas hydrate along most continental margins and their potential as future energy resource or a contributor global climate change. Academic drilling for gas hydrates was initially constrained to expeditions conducted under the umbrella of the Ocean Drilling Program (and its following successors Integrated Ocean Drilling Program, 2002-2012, and International Ocean Discovery Program, 2013-2023). Logging
20
tools and their operation onboard the drilling vessel ‘JOIDES Resolution’ are provided by contract to Schlumberger, the leading European provider of technology for the oil and gas industry.
The first dedicated wire-line logs for gas hydrates were acquired during ODP Leg 146 (Westbrook et al., 1994) and ODP Leg 164 (Paull et al., 1996) with the recognition of elevated p-wave velocity and electrical resistivity values as primary proxies for the occurrence of gas hydrate (e.g. Collett and Ladd, 2000; Collett and Lee, 2012). After ODP Leg 204 (Tréhu et al., 2003) and IODP expedition 311 (Riedel et al., 2006) along the southern and northern Cascadia margin, a series of semi-industrial drilling expeditions were conducted mostly for exploration of gas hydrates as an energy resource: (1) US Gulf of Mexico, Joint Industry Project (e.g. Ruppel et al., 2008; Collett and Boswell, 2012, and references therein), (2) Japan, Nankai Trough (e.g. Tsuji et al., 2009; Fujii et al., 2009) with the culmination in the first marine gas hydrate production test (e.g. Yamamoto et al., 2014; Yamamoto and Ruppel, 2015), (3) India, off the east and west coast of the Indian sub-continent (two expeditions in 2006 (e.g. Kumar et al., 2014; Collett et al., 2014) and in 2015 (e.g. Kumar et al., 2016)), (4) China, along the South China Sea (four expeditions between 2007 and 2016 (e.g. Shengxiong et al., 2017), see e.g. Matsumoto et al., (2011) and references therein), and (5) Korea, Ulleung Basin (two expeditions in 2007 and 2010, e.g.
Ryu et al., 2013). These expeditions often adapted the same procedures for gas hydrate drilling, coring, and logging as developed by ODP and IODP (as e.g. described in Collett et al., 2014; Ryu et al., 2013).
Operationally, many of these semi-industrial drilling legs were conducted on a contract basis by Fugro (with staff from Holland, UK, and US offices) in conjunction with GeoTek Ltd (UK).
In many of the modern (post-2000) drilling expedition, gas hydrate drilling starts with the acquisition of Logging-While Drilling (LWD) logs, often in combination with measurement-while-drilling (MWD) as primary safety control (as initially developed for IODP Expedition 311, Riedel et al., 2006). These LWD data are then used as the basis to develop coring and additional wire-line (WL) logging programs including vertical seismic profiling (VSP). Below, LWD, WL, and the VSP techniques are described and a general assessment of the different techniques with resolution limits and pitfalls are given. The ultimate use of the log-data is in a site-by-site core-log-seismic integration (e.g. Bahk et al., 2013a,b;
Tréhu et al., 2004; Fujii et al., 2009), seismic inversion (e.g. Lu and McMechan, 2004; Bellefleur et al., 2006), and as ground-truth for basin-wide resource assessments (e.g. Collett, 2004; Frye, 2008).
Approaches to drilling and logging in non-marine, i.e. permafrost environments, are often similar to marine environments, but operational challenges require special borehole conditioning efforts. Details on these issues can be found e.g. in Goldberg et al., (2010), Dallimore et al. (1999), Dallimore and Collett (2005), or Collet et al., (2011).
2.4.2 Basic logging methods/proxies for gas hydrate
The most commonly used logs to identify (and quantify) gas hydrates include electrical resistivity, p- wave and s-wave velocity (also referred to as sonic logs), and resistivity- imaging logs (e.g. Goldberg, 1997; Goldberg et al., 2010; Collett and Lee, 2011; 2012). Additional logs, such as electromagnetic (e.g.
Sun and Goldberg, 2005) and nuclear magnetic resonance (e.g. Kleinberg, et al., 2005), are used but are less common. Porosity, density, and natural gamma-ray logs are usually acquired combined with the above standard log-suite, but are only to be seen in the context of the basic-log data and core measurements to provide physical properties of the host-sediments containing gas hydrates. Electrical
21
resistivity logs often rely on the use of Archie’s equation (Archie, 1942) linking porosity of the sediments to the formation resistivity with the aim to detect gas hydrates (that act as electrical insulator in the sense of a pore-filling material), thus increasing the formation resistivity significantly above a (site-specific) background trend. Electrical resistivity logs can be acquired with various tools (see e.g. Goldberg et al., 2010 or the ODP logging manual (2004) for details). Borehole imaging is a technique in which the electrical resistivity of the borehole wall is measured and displayed as unwrapped image data. These image data are useful to detect gas hydrate in fractures and are also exploited for structural analyses of the fracture network and stress regime (e.g. Janik et al., 2004; Cook et al., 2008) Velocity/Sonic (p- and s-wave) logs are based on measuring the travel time of an emitted sonic pulse between a source and a series of receivers mounted on the drill/log string. Sonic data are less sensitive to the presence of gas hydrates (especially at low concentrations) than electrical resistivity logs, but elevated p-wave velocity values are often used to estimate gas hydrate saturations (e.g. Guerin et al., 1999; Shankar and Riedel, 2011). It should be noted that LWD and WL log data are susceptible to anisotropy in fracture-dominated environments (e.g. Cook et al., 2010). Most log data are naturally measured in a “vertical sense” between pairs of source- and receivers along the drill string. With the semi-vertical fracture network seen in some gas hydrate bearing settings (such as cold vents), measurements of resistivity and p-wave velocity are affected and yield artificially higher values and gas hydrate saturation estimates are too high and need to be corrected for this anisotropic effect (e.g. Lee and Collet, 2010; 2013). Porosity logs (measured with a neutron source) provide a basic measure of formation properties used to deduce gas hydrate saturations. Porosity is a basic input parameter for the Archie equation as well as the rock-physics model used for p- and s-wave velocity log data. Density logs measure the sediment bulk density by using a radioactive Cesium source and using Compton scattering and photo-electric absorption to link electron density of rocks/sediments to bulk density. If grain-density is known, the density-log can be converted to an independent porosity- log. Natural Gamma ray logs are measuring (passively) the natural gamma ray intensity of the sediments. Data are useful for sediment classification and sand-detection, but also as simple tool to detect borehole enlargements.
2.4.3 LWD and MWD operation
LWD tool strings can be operationally complex, and can be combined with different tools to make up a tool string often more than 30 meter in lengths. The basic advantage of LWD operations is that physical properties are measured directly during drilling (borehole advancement) and thus, sediments have not been significantly altered from the drilling process itself. The use of LWD is especially important for detecting gas hydrates, as the quality of wire-line logs may be hampered as the drilling (and coring) process could have resulted in gas hydrate dissociation, gas release from below the base of hydrate stability, or formation damage (hole enlargements). LWD was first implemented for gas hydrate research only during ODP Leg 204 in 2002 (Tréhu et al., 2003), but has since then become a standard part of all subsequent gas hydrate drilling operations. LWD data offer several other advantages: full 360° borehole coverage (e.g. for imaging and fracture detection), information of hydrate distribution prior to coring to optimize the use of special coring tools (e.g. pressure cores) or other downhole measurements (e.g. temperature or pressure), as well as providing direct means for
22
assessing drilling safety through the use of measurement-while-drilling (MWD) tools, that pulse log- data up the borehole to the rig-floor for immediate data recovery (though at a reduced sample rate).
2.4.4 Wire-line logging operation
Wire-line logging is used after a borehole has been drilled (and/or cored) and tools are inserted into the borehole using a separate wire-line for continuous measurements of the physical properties of the sediments. It should be noted that wire-line logging is typically depth-limited (as described below) to ensure drilling safety and tool-recovery. Wire-line logging tools used during the ODP and IODP programs are described in the ODP Logging Manual (2004). The “standard” tools deployed for a complete log-suite comprise the triple-combo (consisting of tools to measure natural gamma, porosity, density, resistivity, and borehole diameter or caliper) and the Formation-Micro-Scanner (FMS)-sonic tools (consisting of tools to measure natural gamma, shear- and p-wave velocity, and to acquire borehole resistivity images), combined sometimes with the well-seismic tool (WST) for conducting vertical seismic profiles. WL-tools are typically run from the bottom of the hole upwards. Heave- compensation as part of the wire-line operation ensures that the tool is pulled at a speed to measure the physical properties continuously and in regular depth intervals. In generalized terms WL-tools allow measuring physical properties at higher sampling rates and densities as LWD tools as the deployment speed is often much slower than used for LWD. However, as the measurements are made post-drilling of the borehole, data is highly dependent on hole-size (diameter) and shape. Also, the depth-coverage of WL-deployments is smaller than with LWD acquisition as the WL-tools are deployed not from the seafloor but from a suspended drill-pipe up to 60 meter below seafloor. Also, borehole instabilities may result in reducing of the overall borehole depth as tectonic forces or instable sediments fill the bottom of the hole gradually. Conditioning of the borehole (so called wiper-trips) may mediate this effect and the use of special borehole fluids (e.g. guar-gum, oil-based drill-muds, or heavy drill mud) may overcome these problems. However, the use of heavy mud increases the risk of artificially fracturing the formation, if the drill mud is heavier than the surrounding sediment yield strengths.
2.4.5 Vertical Seismic Profiling
One of the fundamental problems in geophysical imaging of gas hydrate is related to the different acquisition domains of the geophysical tools: seismic surveys image the subsurface and are acquired in time-domain. They can be depth-migrated, but velocity functions are often very smooth and coarsely sampled. Logging (and coring) is done by directly measuring data inside the borehole as function of meter below rig-floor (which due to heave-compensation of the drill string) is easily converted to meter below seafloor (mbsf). In order to provide a direct conversion of depth (in mbsf) to two-wave travel time (TWT) of the seismic data, so called check-shot or vertical seismic profile surveys are carried out. These surveys are based on deploying geophones inside the borehole (i.e. the WST) that are mechanically clamped to the borehole wall while emitting a sound source at the sea- surface above the borehole, typically with a single airgun deployed from the drill ship. The direct travel path of the seismic waves emitted are detected at the geophone and the airgun shots are repeated
23
per station until a stable measurement is achieved, followed by shifting the geophones inside the borehole to another depth interval. The WST tools may contain only a single geophone, but often a string of geophones is used for efficiency of the measurements. As the mechanical clamping of the geophones to the borehole wall damages the formation, the VSP is usually the last wire-line operation in a borehole. VSPs have been applied to almost all gas hydrate drilling during ODP, IODP Legs or other national hydrate drilling programs (e.g. Holbrook et al., 1996; Pecher et al., 1997; Tak et al., 2013) or Arctic drilling expeditions (Milkereit et al., 2005; Sakai, 1999; Walia et al., 1999). An extension of the VSP is possible by shooting the airgun at farther offsets from the borehole, so-called walk-away VSPs (e.g. Pecher et al., 2003; Milkereit et al., 2005). These surveys are demanding as a second vessel is required for conducting the airgun operation. However, walk-away VSPs are a powerful tool for advanced geophysical imaging of the gas hydrate reservoir and to extract additional properties of the sub-seafloor formation, foremost s-wave velocities (e.g. Pecher et al., 2010).
2.5 Pressure coring and core-analysis devices
As part of the Japanese government decision to expand the gas hydrate production research to deepwater conditions of Nankai Trough, pressure core sampling and analysis were considered as part of the logging program. These investigations were recently reported by Yamamoto (2016): In the program the pressure-core analysis and transfer system (PCATS) were used. These tools were developed as part of the European HYACE and HYACINTH projects (Schultheiss et al, 2009). Note that there were certain issues with compatibility between the European equipment and the supporting Japanese equipment, and certain devices and adjustment had to be made (Yamamoto, 2016). Core sampling took place in 2012 in Nankai Trough, between depths of 270 to 330 m below seabed. 15 cores of 3.5 m were extracted, out of which 7 lost pressure. The cores were placed in ice-water on board.
Nondestructive X-ray scanning, p-wave velocity and gamma ray density measurements were performed on the cores. Both onboard and post-cruise tests were performed on the core samples.
Fig. 2.10 shows the various investigation performed onboard and post-cruise, as reported by Yamamoto (2016).
Even if pressure and temperature of a core could be preserved at local conditions all the way to the top, the system is still removed from its original state of stationary balance between flow and thermodynamic (see section 2.1.1 and 2.1.2). This means that a certain disturbance to the sample occurs as it is approached and extracted, the magnitude of which depends on the field conditions (e.g.
soil type, permeability, salinity, hydrate saturation, etc.) as well as specific extraction method and operation. This topic, for itself, is of vital importance for sample representativity and requires specific research efforts.
24
Figure 2.10: Flowchart of test and analyses performed on PCATS core samples (Yamamoto, 2016).
Most interesting, from geomechanics point of view, are the PCATS Tri-Axial tests (Fig. 2.11). In these tests, a short “undisturbed” sample is transferred from the core into a triaxial apparatus without any hand-touch under the in-situ pressure conditions. The apparatus allows for both small strain and large strain geotechnical testing, as well as direct flow measurements of permeability (Priest et al., 2015).
The system allows for testing under hydrostatic (pressure cell) of 25 MPa. It is composed of several