Florian Weißofner
Essays on Momentum Strategies and Investor Sentiment
A dissertation submitted to the Faculty of Business, Economics, and Management Information Systems in partial fulfillment of the requirements for the degree of
Doktor der Wirtschaftswissenschaft (Dr. rer. pol.)
Advisors:
Prof. Dr. Klaus Röder Prof. Dr. Gregor Dorfleitner
Center of Finance
Faculty of Business, Economics, and Management Information Systems
Universität Regensburg
i
Content
2.1 Introduction . . . 10
2.2 Data and summary statistics . . . 13
2.3 Abnormal returns of MAX and MIN strategies . . . 16
2.4 Longer holding period returns . . . 29
2.5 A mispricing-based explanation . . . 31
2.6 Conclusion . . . 34
3.1 Introduction . . . 37
3.2 Data and summary statistics . . . 41
3.3 The CO-return relation . . . 43
3.4 Return Effects of High and Low CO Measures with Controls . . . 48
3.5 CO measures within different business conditions . . . 51
3.6 Conclusion . . . 55
4.1 Introduction . . . 58
4.2 Data and Variables . . . 63
4.3 Short-Term Persistence in Overnight Returns . . . 67
4.4 Higher Spread for HTV Firms . . . 74
4.5 Long-Term Reversal . . . 78
4.6 Application Test . . . 81
4.7 Conclusion . . . 84
1 Introduction 1
2 Separating Momentum from Reversal in International Stock Markets 9
3 Continuing Overreaction: European Evidence 36
4 Overnight Returns: An International Sentiment Measure 57
5 Conclusion 86
6 Bibliography 89
ii
List of Tables
2.1 Summary statistics, 1990-2017 . . . 15
2.2 Benchmark-adjusted returns of standard, MAX, and MIN momentum strategies . . . 18
2.3 Robustness of MAX and MIN momentum strategies . . . 22
2.4 Longer holding period returns of MAX and MIN momentum strategies . . . 30
2.5 Returns to MAX and MIN momentum strategies conditional on mispricing . . . 33
3.1 Summary statistics, 1990-2018 . . . 42
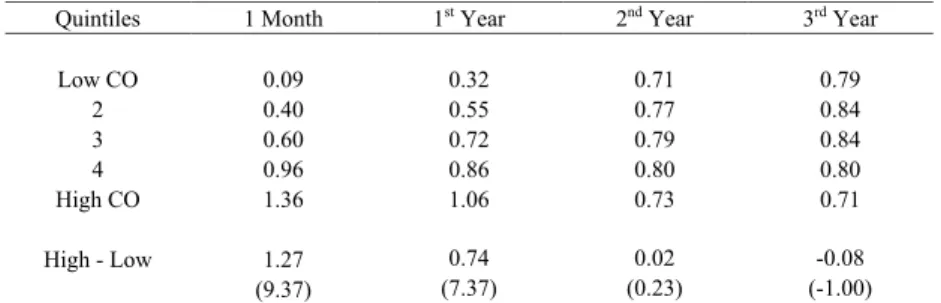
3.2 Continuing overreaction portfolios . . . 44
3.3 Robustness of CO measure . . . 45
3.4 Time series regressions . . . 47
3.5 Cross-sectional regressions . . . 49
4.1 Summary Statistics . . . 66
4.2 Persistence of Weekly Overnight Returns and Related Weekly Close-to-Close Returns . . . 68
4.3 Cross-Sectional Regressions of Weekly Overnight Returns on Overnight Return Indicators and Common Controls . . . 70
4.4 Cross-Sectional Regressions of Weekly Overnight Returns and Hard-to-Value Proxies . . . 74
4.5 Cross-Sectional Regressions for Longer Holding Period Close-to-Close Returns . . . 79
4.6 Cross-Sectional Regressions of Momentum Conditional on Sentiment . . . 82
iii
List of Figures
2.1 Momentum premiums conditional upon business conditions . . . 28
3.1 Premiums conditional upon business conditions . . . 54
1
Introduction
For several decades the capital asset pricing model (CAPM) of Sharpe (1964) and Lintner (1965) has been a fundamental component of finance. The standard CAPM contains only two types of risk, the systematic and the unsystematic. The unsystematic risk includes the individual stock specific risk that is not correlated with the market and can be eliminated by diversification. However, the systematic risk covers the market risks (e.g., recessions or interest rates) and is the only return component in the CAPM that cannot be diversified away.
Nevertheless, Basu (1977), Jegadeesh (1990), and Fama and French (1992) provide empirical evidence that cross-sectional return differences even occur by market capitalization, book- to-market, and past stock returns better known as size effect, value effect, and momentum.
The momentum anomaly and the consequential suffering from reversal is still one of the most examined anomalies in finance literature. Therefore, this dissertation analyzes novel momentum approaches in international settings which represent alternatives to the traditional momentum approach by Jegadeesh and Titman (1993).
Beside these very well-known anomalies, a large number of return predictive variables has been examined in finance literature. For example, McLean and Pontiff (2016) investigate 97 anomalies based on research history of cross-sectional relations between variables and stock returns. In general, there are two famous distinct explanations. On the one hand, Daniel et al.
(1998) were among the first to present a behavioral model based on investors’ overconfidence and on the other hand, Conrad and Kaul (1998) suggest a risk-based explanation. A substantial role within the behavioral models is played by the measure of investor sentiment.
Baker and Wurgler (2006) developed a sentiment measure for the U.S. equity market and present evidence that market-wide sentiment has effects on the cross-section of the expected returns. It is quite likely that the sentiment measure of Baker and Wurgler is still the most applied sentiment measure in finance literature. However, there are a few restrictions and
2
shortcomings of the measure, especially within an international test setting. Recent literature implemented a novel approach by measuring investor sentiment directly at the firm level.
Aboody et al. (2018) demonstrate the suitability of overnight returns as a firm-specific measure for investor sentiment. This dissertation empirically analyzes the novel approach by Aboody et al. (2018) in a broad set of international equity markets.
Momentum in the literature
DeBondt and Thaler (1985, 1987) were among the first to show that past losers outperform past winners in the long run. Specifically, they showed that stocks with low returns in the past three to five years have higher subsequent returns than vice versa. This effect later became known as the reversal effect in the long run.
The standard momentum approach that is still current today dates back to Jegadeesh and Titman (1993). They show that over a period of three to twelve months, past winners (based on the prior twelve-month stock return) outperform past losers, and therefore exhibit momentum in the intermediate term. Afterwards, Rouwenhorst (1998) examined momentum in a broad set of international equity markets. Besides the proof that momentum is also present in twelve sample countries, he points out that international momentum is likewise correlated to momentum in the United States. Later studies by Moskowitz and Grinblatt (1999) document momentum even within industries; furthermore Asness et al. (2013) deliver empirical evidence for momentum across different asset classes.
However, all momentum anomalies suffer from a return reversal, and specifically the momentum premium earned in the first year becomes negative in the subsequent years (Jegadeesh and Titman, 2001). Blackburn and Cakici (2017) provide further evidence for the return reversal pattern in a broad international sample of 23 developed countries. Recently, Conrad and Yavuz (2017) invented a method that separated momentum stocks from stocks that gain reversal. They argue that when risk-based characteristics such as size and book-to- market are taken into account by calculating winner and loser portfolios, a separation is
3
possible. Therefore, they construct a MAX momentum strategy that buys small value winners and sells large growth losers. Likewise, they build a MIN momentum strategy that buys large growth winners and sells small value losers. With their novel approach, they are not only able to gain higher momentum profits in the MAX strategy, but also no significant reversal occurs within this strategy. In contrast, the MIN strategy produces no momentum profits but significant negative returns over longer holding periods.
Overall, two famous attempts to explain momentum and reversal exist in literature. Daniel et al. (1998) explain short-term momentum and long-term reversal observed in a standard momentum approach within a behavioral model based on investors’ overconfidence. On the downside, Conrad and Kaul (1998) recommend a risk-based explanation for several market anomalies (including momentum). Jegadeesh and Titman (2002) object the view, arguing that if a risk-based explanation is true, momentum should not suffer from return reversals.
Jegadeesh and Titman (2011) contradict the risk-based explanations again by explaining that the magnitude and the persistence of the momentum anomaly over decades are too strong to be explained by risk and therefore favoring a behavioral approach. Recently, Conrad and Yavuz (2017) resume this debate again by arguing that stocks with momentum can be separated from stocks that gain reversal when risk-based characteristics are considered in the selection of winner and loser portfolios. In sum, the debate about whether returns are explained by risk factors or interpreted as a measure of mispricing is still ongoing. Thus, providing good reason for examining the question in this dissertation.
Within the overconfidence explanation an extensive body of literature documents theoretical evidence that momentum leads to higher trading volume. Initially, Odean (1998) demonstrated that trading volume increases when investors are overconfident. Furthermore, Statman et al. (2006) provide supporting evidence for higher trading volume in conjunction with biased self-attribution. Recent literature by Byun et al. (2016) resumes these findings and provides a novel measure that offers the possibility to use trading volume as a proxy for overconfidence, and therefore predict future stock returns. As the direction of overreaction is
4
not known, they argue that the trading volume itself does not predict future stock returns directly. Therefore, by multiplying the trading volume with the sign of the average stock return, they create a measure for continuing overreaction that displays a trend of investors’
overconfidence.
Investor sentiment and overnight returns in the literature
In their pioneering work, Baker and Wurgler (BW hereafter) (2006) challenge the view of the classical finance theory of efficient markets. They were among the first who demonstrated significant effects of investor sentiment on the cross-section of stock returns. Specifically, when sentiment is high, stocks that are more attractive for optimistic investors (e.g., stocks that were small, young, more volatile or unprofitable) gain low returns in the subsequent months while during low sentiment periods, this pattern becomes insignificant or even reverses. Besides the well-known BW sentiment measure, a broad set of literature focuses on market-wide measures for investor sentiment (e.g., Brown and Cliff, 2004 or Stambaugh et al., 2012). However, there is less international sentiment literature and no universal measure is available (Baker et al., 2012). Furthermore, the BW measure uses the exclusive datasets for IPOs from Jay Ritter’s website, which delivers data primarily for the U.S. market. Thus, proxies have to be used for international calculations.
Aboody et al. (2018) contribute to the U.S. literature by implementing a novel approach for a firm-specific sentiment measure. More precisely, they document the suitability of overnight returns as a measure of sentiment. Their new approach has the advantage that it is possible to measure sentiment directly at the firm level, and not as a market wide measure. Besides that, the calculations do not require special datatypes or databases, as the opening and closing prices are publicly available data.
Literature on overnight returns is quite young and mainly focuses on U.S. studies. Branch and Ma (2008) find a negative correlation between overnight returns and subsequent intraday returns. Berkman et al. (2012) deliver supporting evidence and show that this relation is due
5
to a high opening price compared to the intraday prices. Furthermore, they show this behavior is stronger among stocks that are more attractive to retail investors and stocks that are harder to value. Analyzing microsecond tick data, Lou et al. (2019) present new evidence about the cross-section of expected returns by paying particular attention to the exact time the returns accrue. Therefore, they evince that momentum profits on U.S. markets occur entirely overnight while the profits of all other trading strategies occur intraday.
In addition, sentiment against the background of different market anomalies is of special interest. Particularly because Stambaugh et al. (2012) demonstrate that a broad set of anomalies is stronger among high levels of sentiment, and weaker within low sentiment levels, while in their test setting the short leg is always more profitable than the long leg.
Contribution of this thesis
On the whole, there is still an ongoing debate about the explanation for the momentum anomaly and return reversal as well as about sentiment measures as a perennial issue of finance literature. However, previous literature predominantly focuses on the U.S. equity market, while studies on the European stock market as well as international studies are scarce.
This dissertation fills this gap and contributes to the literature by examining momentum anomalies and sentiment measures on a European or even an international stock market sample.
This thesis contributes to the literature in manifold ways. First, it sheds light into separating momentum stocks from stocks that suffer from reversal. Second, it examines a measure for overreaction that better predicts momentum stocks than a standard momentum approach. And third, it examines the suitability of overnight returns as a firm specific sentiment measure on the international stock market. This dissertation investigates different subsamples, i.e. time, size and regions. Besides that, different states of the economy, i.e. market volatility, market states, investor sentiment, market liquidity, default spread and a recession indicator are taken into account.
6
Previous literature often focuses on portfolio sorts to examine how average returns vary within different levels of the characteristics. This might be a very useful approach, but portfolio sorts have the potential shortcoming that some of the information is lost through aggregation. Therefore, the Fama and MacBeth (1973) methodology, which provides a test setting that easily allows for multiple control variables, is used additionally. Recent literature by Fama and French (2015) argues that the explanatory power of alternative factor models is superior or at least equal to the explanatory power of traditional models (e.g., the three-factor model by Fama and French (1993) or the four-factor model by Carhart (1997)). These models enable gaining valuable new insights into the cross-section of expected stock returns by studying the stocks at the individual firm level.
This thesis comprises three studies. The subsequent section gives a brief overview of the approach and the contribution of every single article to the literature. The remainder of this thesis is organized as follows. Chapter 2, 3 and 4 cover the three studies, and Chapter 5 outlines the main findings of the three studies and summarizes the thesis.
Separating Momentum from Reversal in International Stock Markets
It is well established that momentum portfolios suffer from a return reversal over longer holding periods. This paper demonstrates that stocks with momentum can be separated from those with reversal when risk-based expected return characteristics like firm size and book- to-market are taken into account in the selection of winners and losers.
Specifically, this study contributes to the literature by investigating the novel strategies in the broad cross-section of international firms drawn from 20 developed non-U.S. equity markets.
More precisely, what is examined is whether a strategy that buys small value winners and sells large growth losers, namely the MAX strategy, yields significantly larger benchmark- adjusted returns over holding periods up to one year, than the MIN strategy, that buys large growth winners and sells small value losers. To ex ante separate momentum stocks from stocks that display return reversal, the return behavior of the MAX and MIN strategies over
7
longer holding periods up to three years is further investigated. Given that the well-known firm characteristics used in this study can be interpreted as measures of mispricing (e.g., Lakonishok et al, 1994; Shleifer and Vishney, 1997; Hirshleifer and Jiang, 2010), that may add to our understanding of the varying return behavior of the MAX and MIN strategies.
Therefore, it is examined whether the performance of the two distinct strategies are the outcome of cross-sectional mispricing.
Continuing Overreaction: European Evidence
Building upon the insights that continuing overreaction causes momentum in the short run, Byun et al. (2016) construct a completely novel measure of continuing overreaction.
Motivated by their findings for the stock market in the United States, this study extends these findings for the European stock market.
In detail, this study contributes to the literature by examining the novel continuing overreaction measure introduced by Byun et al. (2016) in the broad cross-section of 15 European equity markets. Besides the past stock return, the measure includes the trading volume of a stock. First, this study tests whether a positive return relation exists between firms with a high measure of continuing overreaction and firms with lower continuing overreaction values. Second, the return behavior within the cross-section and added established return determinants is investigated. And third, it is tested whether the return premium is also present within different business conditions, as it is known that the momentum profits vary within different states of the economy. Therefore, the measure is tested in contracting/pessimistic business conditions and compared to expanding/optimistic business conditions.
Overnight Returns: An International Sentiment Measure
This study focuses on the suitability of overnight returns as a firm-specific sentiment measure in an international stock market sample. Previous literature by Aboody et al. (2018) finds strong evidence that overnight returns function as a measure of sentiment on the U.S. stock
8
market. The substantial contributions for the international equity markets are interesting especially for three reasons. First, there is still no ubiquitous sentiment measure at the firm- level. Second, until now, international literature has to use U.S. sentiment measures as proxies. And third, the existing measures mostly require special datatypes. The novel approach fills this gap and offers an international applicable measure.
Furthermore, to examine the suitability on the international stock market, the study first investigates whether overnight returns persist over the subsequent weeks. Second, it is examined whether the short-term return persistence is greater among stocks that are objectively harder-to-value. For the validity of the assumption, the overnight return persistence should be stronger among firms that are objectively harder-to-value. In the third step, the return behavior of stocks with high overnight returns in the long run is examined.
Temporary mispricing is a characteristic that would be expected of a sentiment measure;
consequently, in the long run, returns should be smaller among firms with high overnight returns. Finally, to examine the validity of overnight returns as a firm-specific sentiment measure, they are tested in the context of the momentum anomaly, and even the explanatory power beyond the well-known BW market-wide sentiment measure is investigated.
9
Separating Momentum from Reversal in International Stock Markets
This research project is joint work with Christian Walkshäusl and Ulrich Wessels. The paper has been published as: Christian Walkshäusl, Florian Weißofner and Ulrich Wessels (2019), Separating Momentum from Reversal in International Stock Markets, Journal of Asset Management 20(2): 111-123.
Abstract Taking into account expected return characteristics like firm size and book-to- market in the selection of winners and losers helps to ex ante separate stocks with momentum from those that exhibit reversal in international equity markets. A strategy that buys small value winners and sells large growth losers generates significantly larger momentum profits than a standard momentum strategy, is robust to common return controls, and does not suffer from return reversals for holding periods up to three years. The superior performance of the strategy is attributable to a rather systematic exploitation of cross-sectional mispricing among momentum stocks.
Keywords Momentum; Reversal; Return predictability; Mispricing; International markets
10 2.1 Introduction
Over the last three decades, the momentum effect has become one of the most examined return patterns in finance. In their seminal work, Jegadeesh and Titman (1993) demonstrate that a strategy that buys past winners and sells past losers produces large abnormal returns for holding periods up to one year. Since then, the momentum effect has been documented in international equity markets, within industries, and across different asset classes (Rouwenhorst, 1998; Moskowitz and Grinblatt, 1999; Asness et al., 2013). However, over longer holding periods, momentum portfolios, in general, suffer from a return reversal pattern, i.e., the abnormal returns earned over the first year after portfolio formation reverse or even turn negative in subsequent years (Jegadeesh and Titman, 2001; Blackburn and Cakici, 2017).
Despite the enormous body of literature on the momentum effect, explanations for the return behavior of momentum stocks remain an ongoing debate. Daniel et al. (1998) were among the first to present a behavioral model based on investors’ overconfidence that explains the short-term return continuation and long-term return reversal patterns of typical momentum strategies. Conrad and Kaul (1998) suggest a risk-based explanation that is, however, contradicted by Jegadeesh and Titman (2002) who argue that momentum portfolios should not suffer from return reversals if the risk-based interpretation is correct.1
Recently, Conrad and Yavuz (2017) take up again this debate by arguing that stocks with momentum can be separated from those that exhibit reversal when risk-based expected return characteristics like firm size and book-to-market are taken into account in the selection of winners and losers. Assuming that these firm characteristics are responsible for differences in expected returns (Fama and French, 1992), they construct two distinct momentum strategies that differ in their underlying risk characteristics. The MAX momentum strategy takes a long position in high-risk winners, i.e., small value winners, and a short position in
1 See, Jegadeesh and Titman (2011) for an extended review of the literature.
11
low-risk losers, i.e., large growth losers. Analogously, the MIN momentum strategy goes long in low-risk winners (large growth winners) and short in high-risk losers (small value losers).
Studying the U.S. equity market, Conrad and Yavuz (2017) find that the MAX strategy does not only yield larger momentum profits than the standard momentum strategy in the short run, it also does not display significant return reversals for holding periods beyond one year.
In contrast to that, the MIN strategy produces no significant momentum profits in the short run but suffers from substantial and significant return reversals in the long run. Thus, short- term return continuation and long-term return reversals are not necessarily linked. Taking into account expected return characteristics like firm size and book-to-market in the selection of winners and losers helps to ex ante separate stocks with momentum from those that exhibit reversal.
The approach of Conrad and Yavuz (2017) seems to be related to the style momentum of Chen and DeBondt (2004) who propose a strategy that goes long in firms with in-favor styles, e.g., being small value stocks, and short in firms with out-of-favor styles, e.g., being large growth stocks, based on the past price performance of these style characteristics. However, there exist clear differences. First, Chen and DeBondt (2004) document in their study that style momentum is distinct from pure price momentum by showing that both strategies possess unique information about subsequent stock returns that is not captured by the other strategy. Second, though the MAX and MIN strategies also take into account firm size and book-to-market in the selection of winners and losers, the focus of these strategies is on using these characteristics as risk measures for separating high-risk from low-risk momentum stocks. Consequently, the strategies’ long and short legs are uniformly defined. In contrast, the long and short leg portfolios of style momentum strategies can potentially also consist of mid-cap blend-style stocks or non-dividend-paying stocks, which are not in the center of attention of the MAX and MIN strategies. Third and finally, while the motivation of Chen and DeBondt (2004) is the improvement of style rotation strategies with respect to firm size
12
and value/growth, the MAX and MIN strategies are motivated by the idea that momentum can be separated from reversal for constructing enhanced momentum-based investment strategies.
In this paper, we contribute to the literature by studying the findings of Conrad and Yavuz (2017) outside the United States. As with any finding in empirical research, the decomposition of momentum and reversal could be the result of data snooping in the sense of Lo and MacKinlay (1990) and therefore be sample-specific. To address this concern, we independently examine in this study the novel MAX and MIN strategies in the broad cross- section of international firms drawn from 20 developed non-U.S. equity markets. Obtaining results similar to the previous U.S. evidence in Conrad and Yavuz (2017) would strengthen their findings and may lead to a better understanding of the momentum and reversal return patterns across equity markets.
From the previous U.S. evidence, we derive three hypotheses that we test out-of-sample in non-U.S. equity markets. The first hypothesis directly addresses whether international stock returns conform to the same pattern observed in the United States.
H1: A strategy that buys small value winners and sells large growth losers, the MAX strategy, yields significantly larger benchmark-adjusted returns over holding periods up to one year than a strategy that buys large growth winners and sells small value losers, the MIN strategy.
Showing that the short-term performance of the MAX strategy is superior to the MIN strategy is only the first part of the key results of Conrad and Yavuz (2017). Second and even more important may be the finding that considering expected return characteristics like firm size and book-to-market in the selection of winners and losers helps to ex ante separate momentum stocks that display return reversals from those that do not. Therefore, we further investigate the return behavior of the MAX and MIN strategies over longer holding periods up to three years and formulate our second hypothesis as follows.
13
H2: Over holding periods beyond one year, the MAX strategy displays no return reversal, while the MIN strategy exhibits significant return reversal.
The distinct return behavior of the MAX and MIN strategies may be attributable to the varying underlying risks associated with different levels of firm size and book-to-market, as argued by Conrad and Yavuz (2017). However, these well-known firm characteristics can also be interpreted as measures of mispricing (e.g., Lakonishok et al., 1994; Shleifer and Vishney, 1997; Hirshleifer and Jiang, 2010). Though Conrad and Yavuz (2017) reject that the level of market-wide mispricing as measured by market states and the investor sentiment is influential in the results observed, they do not rule out explanations based on cross- sectional mispricing. That is, the possibility that the different return behavior of the two strategies is the result of a rather systematic exploitation of existing mispricing among momentum stocks that is induced by taking into account mispricing-related measures like firm size and book-to-market in the stock selection procedure. Because mispricing at the individual firm level may add to our understanding of the varying return behavior of the MAX and MIN strategies, we formulate our third and final hypothesis as follows.
H3: The strong performance of the MAX strategy and the weak performance of the MIN strategy are the outcome of cross-sectional mispricing.
The remainder of the paper is organized as follows. The next section describes the data and variables used in this study. The subsequent sections test the outlined hypotheses and present the empirical results. The final section concludes the paper.
2.2 Data and summary statistics
The dataset used in this study consists of an international sample of firms from 20 developed non-U.S. equity markets. Our sample selection resembles the countries included in the well- known EAFE (Europe, Australia, and the Far East) stock market benchmark from MSCI which measures the foreign stock market performance outside of North America. We collect monthly total return data on common stocks from Datastream and firm-level accounting
14
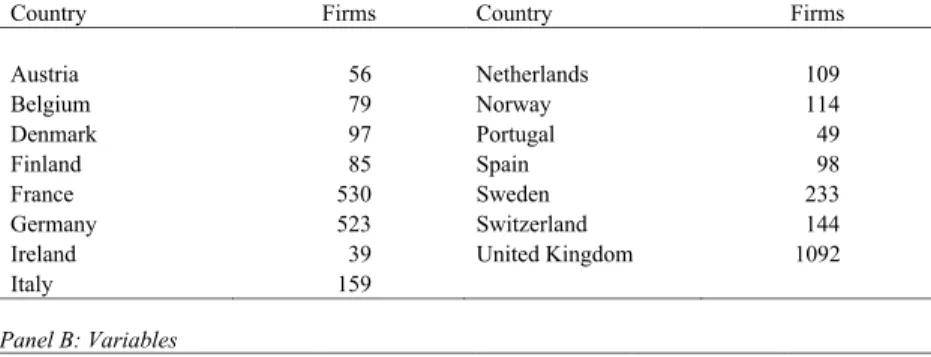
information from Worldscope. To ensure that accounting information is known before the returns are calculated, we match the latest accounting information for the fiscal year ending in the previous calendar year with stock returns from July of the current year to June of the subsequent year throughout the paper. All data are denominated in U.S. dollars. To ensure that tiny or illiquid stocks do not drive our results, we follow Ang et al. (2009) and exclude very small firms by eliminating the 5% of firms with the lowest market equity in each country. In addition, as in Fama and French (1992), we also exclude firm-year observations with negative book equity and financial firms with Standard Industrial Classification (SIC) codes between 6000 and 6999. The sample period is from July 1990 to June 2017 (henceforth 1990-2017), and the sample comprises on average 7652 firms per month. Distributional statistics for the sample firms across countries are given in Panel A of Table 2.1.
The variables used in this study are defined as follows. A firm’s size (SZ) is its market equity (stock price multiplied by the number of shares outstanding) measured as of June each year in million U.S. dollars. Book-to-market (BM) is the ratio of book equity to market equity at the fiscal year-end. Momentum (MOM) is the cumulative prior six-month stock return, skipping the most recent month (Jegadeesh and Titman, 1993). Following Fama and French (2015), operating profitability (OP) is revenues minus cost of goods sold and interest expense, all divided by book equity.2 Investment (INV) is the annual change in total assets divided by lagged total assets. To proxy for systematic mispricing in the later analysis, we employ a financing-based misvaluation measure that is based on Bradshaw et al.’s (2006) external financing (XFIN) variable. XFIN is the sum of net equity financing and net debt financing divided by lagged total assets. Net equity financing is the sale of common and preferred stock minus the purchase of common and preferred stock minus cash dividends
2 We do not include selling, general and administrative expenses, as this item is not broadly available among international firms. The return predictability of operating profitability is, however, not affected by this adjustment.
15
paid. Net debt financing is the issuance of long-term debt minus the reduction in long-term debt.3
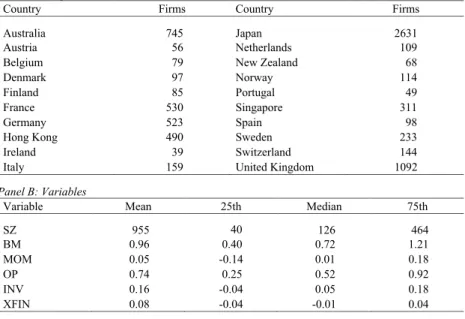
Table 2.1 Summary statistics, 1990-2017 Panel A: Sample countries
Country Firms Country Firms
Australia 745 Japan 2631
Austria 56 Netherlands 109
Belgium 79 New Zealand 68
Denmark 97 Norway 114
Finland 85 Portugal 49
France 530 Singapore 311
Germany 523 Spain 98
Hong Kong 490 Sweden 233
Ireland 39 Switzerland 144
Italy 159 United Kingdom 1092
Panel B: Variables
Variable Mean 25th Median 75th
SZ 955 40 126 464
BM 0.96 0.40 0.72 1.21
MOM 0.05 -0.14 0.01 0.18
OP 0.74 0.25 0.52 0.92
INV 0.16 -0.04 0.05 0.18
XFIN 0.08 -0.04 -0.01 0.04
This table presents summary statistics for the countries included in the international (EAFE) sample and the variables used in this study. Panel A reports the average number of firms per month in each country over the sample period from July 1990 to June 2017. Panel B reports the mean, 25th percentile, median, and 75th percentile of the variables. Firm size (SZ) is market equity (stock price multiplied by the number of shares outstanding) as of June of each year in million U.S. dollars. Book- to-market (BM) is the ratio of book equity to market equity at the fiscal year-end. Momentum (MOM) is the cumulative prior six-month stock return, skipping the most recent month. Operating profitability (OP) is revenues minus cost of goods sold and interest expense, all divided by book equity. Investment (INV) is the annual change in total assets divided by total assets. External financing (XFIN) is the sum of net equity financing and net debt financing divided by lagged total assets. Net equity financing is the sale of common and preferred stock minus the purchase of common and preferred stock minus cash dividends paid. Net debt financing is the issuance of long-term debt minus the reduction in long- term debt.
3 In line with Hirshleifer and Jiang (2010), we do not include the change in current debt, as it does not reflect market timing.
16
Panel B of Table 2.1 summarizes the distributional statistics of the variables over the 1990- 2017 sample period. A typical firm in our international sample has a size of $955 million in terms of market equity, an average relative valuation based on book-to-market of 0.96, and a mean past six-month return of 5%.
2.3 Abnormal returns of MAX and MIN strategies
In this section, we test hypothesis H1 that the MAX strategy yields larger benchmark- adjusted returns than the MIN strategy. To do so, we examine the returns to winners and losers on the MAX and MIN strategies at the individual firm level using the Fama and MacBeth (1973) methodology and conduct differences-of-means tests on the average coefficient estimates from the regressions. For comparison purposes, we also include the standard momentum strategy in the analysis to gauge the strength of the MAX and MIN momentum premiums in relation to the unconditional momentum investing approach in international equity markets.
In particular, we estimate three different specification variants nested within the following firm-level cross-sectional regression, where the future twelve-month holding period return of firm i in month t is regressed on two binary indicator variables, denoted Long and Short, in conjunction with common controls that are all available before the month in which the return measurement begins:
ri,t = a0,t + a1,tLongi,t + a2,tShorti,t + a3,tln(SZi,t) + a4,tBMi,t + a5,tOPi,t + a6,tINVi,t + Country Dummiesi,t + ei,t.
(2.1)
We apply Newey and West (1987) adjusted t-statistics here and in all subsequent regressions to correct for the holding period overlap in the statistical inference (Jegadeesh and Titman, 1993). An indicator variable takes the value of one if the underlying condition holds for a firm and zero otherwise. For the standard momentum strategy, Long and Short are equal to
17
one if the firm’s past six-month return is in the top or bottom tercile of the MOM distribution, respectively. Thus, the long leg describes winners, while the short leg denotes losers. When studying the MAX and MIN strategies, the indicator variables also take into account the firm’s size and book-to-market ratio as expected return characteristics in line with Conrad and Yavuz (2017). For the MAX strategy, Long is equal to one if the firm has a past-six month return in the top tercile of the MOM distribution and simultaneously a firm size in the bottom tercile of the SZ distribution and a book-to-market ratio in the top tercile of the BM distribution. Thus, classifying the firm as a small value winner. On the other hand, Short is equal to one if the firm has a past-six month return in the bottom tercile of the MOM distribution and simultaneously a firm size in the top tercile of the SZ distribution and a book- to-market ratio in the bottom tercile of the BM distribution. Thus, classifying the firm as a large growth loser. For the MIN strategy, the indicator variables are defined in an analogous manner using the tercile classifications based on SZ, BM, and MOM. In particular, Long is here equal to one if the firm is a large growth winner and Short is equal to one if the firm is a small value loser.4
Taking into account the most recent developments in asset pricing (Fama and French, 2015), the set of common control variables includes firm size, book-to-market, operating profitability, and investment for measuring benchmark-adjusted returns. Except for MOM, which is updated monthly, the other explanatory variables are updated each June.
Furthermore, since we combine firms from multiple countries in the analysis, we include country dummies here and in all subsequent regressions to control for possible country effects.
4 For each variable, we use the full SZ, BM, and MOM distribution across all sample firms, so that the stock selection procedure corresponds to independent sorts on the three variables, as in Conrad and Yavuz (2017).
18
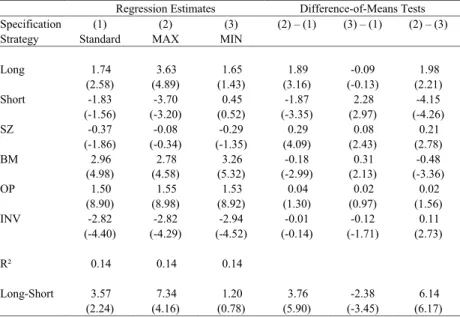
Table 2.2 Benchmark-adjusted returns of standard, MAX, and MIN momentum strategies Regression Estimates Difference-of-Means Tests
Specification (1) (2) (3) (2) – (1) (3) – (1) (2) – (3)
Strategy Standard MAX MIN
Long 1.74 3.63 1.65 1.89 -0.09 1.98
(2.58) (4.89) (1.43) (3.16) (-0.13) (2.21)
Short -1.83 -3.70 0.45 -1.87 2.28 -4.15
(-1.56) (-3.20) (0.52) (-3.35) (2.97) (-4.26)
SZ -0.37 -0.08 -0.29 0.29 0.08 0.21
(-1.86) (-0.34) (-1.35) (4.09) (2.43) (2.78)
BM 2.96 2.78 3.26 -0.18 0.31 -0.48
(4.98) (4.58) (5.32) (-2.99) (2.13) (-3.36)
OP 1.50 1.55 1.53 0.04 0.02 0.02
(8.90) (8.98) (8.92) (1.30) (0.97) (1.56)
INV -2.82 -2.82 -2.94 -0.01 -0.12 0.11
(-4.40) (-4.29) (-4.52) (-0.14) (-1.71) (2.73)
R² 0.14 0.14 0.14
Long-Short 3.57 7.34 1.20 3.76 -2.38 6.14
(2.24) (4.16) (0.78) (5.90) (-3.45) (6.17)
This table presents average coefficient estimates and associated Newey-West adjusted t-statistics (in parentheses) from monthly firm-level cross-sectional regressions along with difference-of-means tests on the average coefficients between the strategies. The dependent variable is the firm’s future twelve-month stock return. Long and Short are binary indicator variables that take the value of one if the underlying condition holds for a firm and zero otherwise. Depending on the considered strategy, the conditions are defined as follows. Standard (Long: winner, Short: loser), MAX (Long: small value winner, Short: large growth loser), MIN (Long: large growth winner, Short: small value loser). The classification of firms is based on terciles using the SZ, BM, and MOM distributions. The additional independent variables are firm size (SZ), book-to-market (BM), operating profitability (OP), and investment (INV) and all regressions include country dummies. R² is adjusted for degrees of freedom.
The last row provides the average return premium associated with the given strategy in percent per year based on the difference between the long and short leg coefficient estimates.
Table 2.2 presents average coefficient estimates from the outlined firm-level cross-sectional regression setting for the standard, MAX, and MIN momentum strategies along with difference-of-means tests to assess whether the strategies produce significantly different
19
momentum profits. The last row provides the economic and statistical significance of the average return premiums associated with the three strategies based on the difference between the long and short leg coefficient estimates.
To begin with, specification (1) reports the results for the standard momentum strategy. As indicated by the average coefficient estimates on Long and Short, past winners are associated with significantly positive subsequent returns (1.74% per year), while past losers are associated with subsequent negative returns (-1.83% per year). Though the strategy’s short- leg return is statistically somewhat weaker over the sample period, the spread in average returns is sufficient to obtain a significant (long-short) standard momentum premium of 3.57% per year after controlling for firm size, book-to-market, operating profitability, and investment.
Specifications (2) and (3) report the results for the novel MAX and MIN strategies. When the MAX strategy is considered, where the long leg consists of winners with high expected return characteristics (small and value) and the short leg is based on losers with low expected return characteristics (large and growth), the attainable momentum premium is economically and statistically greatly enhanced and amounts now to more than 7.34% per year. The average return premium is here equally driven by the strategy’s long leg (3.63% per year) as well as by the short leg (-3.70% per year). In contrast, when the MIN strategy is considered, where the long leg consists of winners with low expected return characteristics (large and growth) and the short leg is based on losers with high expected return characteristics (small and value), the attainable momentum premium is with its value of 1.20% per year statistically not reliably different from zero.
Comparing our international results to the previous U.S. evidence in Conrad and Yavuz (2017) indicates, in general, a similar return behavior across equity markets. In a related analysis that also controls for the Fama and French (2015) benchmark variables, they report significant MAX momentum premiums of 1.01% per month over the strategy’s first six months and 0.59% per month over the subsequent six-month period, which correspond to
20
about 10.03% on an annual basis (formally, (1+0.0101)6 x (1+0.0059)6 - 1) over their 1965- 2010 sample period. For the MIN strategy, they report insignificant premiums of 0.11% per month over the first six months and -0.23% over the following six months, which correspond on average to -0.72% per year.
The estimates on the control variables echo in general prior results in the literature and corroborate their importance as cross-sectional return determinants in non-U.S. equity markets. International stock returns are significantly positively associated with book-to- market and operating profitability, while they are significantly negatively related to investment. In contrast, we do not find that firm size has significant power predicting returns during the sample period. This result is, however, also in line with recent international evidence (e.g., Fama and French, 2012, 2017).
The difference-of-means tests in the last three columns show that the average return premiums associated with the MAX and MIN strategies are significantly different from the standard momentum premium and to each other. Relative to the standard strategy, the return spread between winners and losers is noticeably more pronounced when small value winners and large growth losers are considered (MAX), while it is less pronounced when large growth winners and small value losers constitute the strategy (MIN). Finally, the difference between the MAX and MIN momentum premiums is statistically highly significant and amounts to more than 6.14% per year.
An inspection of the individual difference-of-means tests reveals that both legs of the MAX strategy significantly contribute to its superior overall performance, regardless of which of the other two strategies is used for comparison.
Since the MAX strategy appears to be the most promising of the three from an investment perspective, we further investigate the strategies’ turnover and potential transaction costs to shed light on practical implementation issues. To begin with, though momentum-based investment strategies are often implemented with monthly rebalancing in the literature, we
21
primarily focus in our analysis on the performance over a twelve-month holding period to identify strategies that do not require frequent rebalancing in order to lower transaction costs.
Examining the turnover (across the long and short leg portfolios) of the standard, MAX, and MIN momentum strategies in terms of unique stock additions and removals, we find on average values of 33.63%, 39.56%, and 36.67% per year, respectively.5 However, since we study the strategies based on Fama and MacBeth (1973) regressions which are analogous to creating equal-weighted portfolios, the annual rebalancing to equal weights could potentially increase the turnover to 100% per year.6 Does this circumstance eliminate the superior performance of the MAX strategy after accounting for corresponding transaction costs?
We address this question by employing the novel insights of Frazzini et al. (2018) who have analyzed over 1.7 trillion dollars of executed trades across 21 developed equity markets over a 19-year period from AQR Capital, a large institutional asset manager that is well-known for its scientific and factor-based investing approach. Though their cost measures fully take into account bid-ask spreads, market impact costs, and commissions, they find that real-world trading costs are much smaller compared to the – typically assumed – costs used in previous studies.7 For instance, realized trading costs for long or short positions in non-U.S. stocks are on average 0.11% or 0.22% and range for small stocks from 0.23% (long) to 0.27% (short).
Using for simplicity the largest magnitude of 0.27% regardless of the given order type and an annual turnover of 100%, the roundtrip costs would only amount to 0.54% per year which seems negligible in light of the MAX strategy’s abnormal return of 7.34% per year.
Up to this point, our full sample results fall right in line with our first hypothesis. To further assess the robustness of our findings across time, firm size, and regions, we repeat our cross-
5 These magnitudes are similar to the average turnover of value-weighted U.S. momentum strategies (34.5%) that do not rebalance stocks to initial weights (Novy-Marx and Velikov, 2016).
6 Jegadeesh and Titman (1993) find that even when equal-weighted portfolios are used for momentum strategies, the average turnover is usually less than 100%. They report an average value of 84.8% on their strategy.
7 The most important determinant of trading costs is the price impact, as bid-ask spreads and trading commissions do not scale with trading size.
22
sectional regression analysis for the MAX and MIN strategies in two different sub-periods, among small and large firms, and in three different regions (Asia-Pacific, Europe, and Japan).
The corresponding results are presented in Table 2.3, where Panel A shows estimates for the MAX strategy and Panel B shows estimates for the MIN strategy.
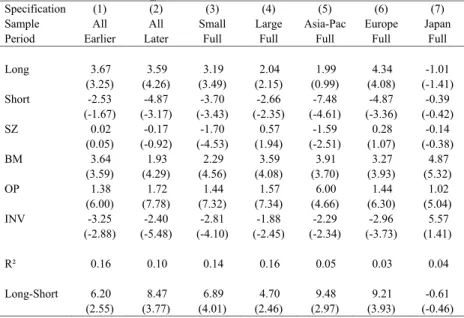
Table 2.3 Robustness of MAX and MIN momentum strategies Panel A: MAX momentum strategy
Specification (1) (2) (3) (4) (5) (6) (7)
Sample All All Small Large Asia-Pac Europe Japan
Period Earlier Later Full Full Full Full Full
Long 3.67 3.59 3.19 2.04 1.99 4.34 -1.01
(3.25) (4.26) (3.49) (2.15) (0.99) (4.08) (-1.41)
Short -2.53 -4.87 -3.70 -2.66 -7.48 -4.87 -0.39
(-1.67) (-3.17) (-3.43) (-2.35) (-4.61) (-3.36) (-0.42)
SZ 0.02 -0.17 -1.70 0.57 -1.59 0.28 -0.14
(0.05) (-0.92) (-4.53) (1.94) (-2.51) (1.07) (-0.38)
BM 3.64 1.93 2.29 3.59 3.91 3.27 4.87
(3.59) (4.29) (4.56) (4.08) (3.70) (3.93) (5.32)
OP 1.38 1.72 1.44 1.57 6.00 1.44 1.02
(6.00) (7.78) (7.32) (7.34) (4.66) (6.30) (5.04)
INV -3.25 -2.40 -2.81 -1.88 -2.29 -2.96 5.57
(-2.88) (-5.48) (-4.10) (-2.45) (-2.34) (-3.73) (1.41)
R² 0.16 0.10 0.14 0.16 0.05 0.03 0.04
Long-Short 6.20 8.47 6.89 4.70 9.48 9.21 -0.61
(2.55) (3.77) (4.01) (2.46) (2.97) (3.93) (-0.46)
23 Panel B: MIN momentum strategy
Specification (1) (2) (3) (4) (5) (6) (7)
Sample All All Small Large Asia-Pac Europe Japan
Period Earlier Later Full Full Full Full Full
Long 1.51 1.79 0.90 0.89 3.99 2.62 -1.94
(0.86) (1.38) (0.90) (0.89) (2.58) (2.24) (-1.67)
Short -0.41 1.32 0.55 -0.86 1.44 -1.40 0.81
(-0.31) (1.47) (0.48) (-0.85) (0.66) (-1.25) (1.00)
SZ -0.22 -0.36 -2.02 0.36 -1.83 -0.00 -0.04
(-0.62) (-2.00) (-6.01) (1.41) (-3.01) (-0.02) (-0.11)
BM 4.37 2.15 2.69 4.06 4.08 3.98 4.50
(4.56) (3.95) (5.17) (4.59) (3.67) (4.51) (4.86)
OP 1.37 1.69 1.44 1.54 5.66 1.40 1.04
(5.86) (7.89) (7.25) (7.20) (4.34) (6.18) (5.12)
INV -3.38 -2.50 -2.91 -1.94 -2.52 -3.12 5.36
(-3.04) (-5.65) (-4.27) (-2.53) (-2.49) (-3.94) (1.39)
R² 0.16 0.10 0.14 0.16 0.05 0.03 0.05
Long-Short 1.93 0.47 0.35 1.75 2.55 4.03 -2.74
(0.90) (0.24) (0.24) (1.06) (1.22) (2.02) (-1.72) This table presents average coefficient estimates and associated Newey-West adjusted t-statistics (in parentheses) from monthly firm-level cross-sectional regressions. The dependent variable is the firm’s future twelve-month stock return. See Table 2.2, for a description of the independent variables.
R² is adjusted for degrees of freedom. The last row provides the average return premium associated with the given strategy in percent per year based on the difference between the long and short leg coefficient estimates. The earlier and later half samples cover July 1990 to December 2003 and January 2004 to June 2017, respectively. The small (large) sub-sample consists of the bottom (top) 50% of firms in each country in terms of market equity, measured as of June of each year. Asia-Pac includes Australia, Hong Kong, New Zealand, and Singapore. With the exception of Japan, Europe encompasses the remaining sample countries (see Panel A of Table 2.1).
Specifications (1) and (2) report sub-period results. The earlier sub-period runs from July 1990 to December 2003 (162 months), while the later sub-period is from January 2004 to June 2017 (162 months). As documented by the average return premiums on the MAX and MIN strategies, the influence of the expected return characteristics on the realized momentum profits is persistent in the earlier and more recent half of the sample period. The MAX
24
momentum premium is large and significantly present in both sub-periods, while the MIN momentum premium remains insignificant across time.
A further cause for concern for anomalous return patterns is their pervasiveness across size.
Though we control for a possible size effect in the cross-section of average returns by including firm size as one of the control variables, it is interesting to know whether our main findings hold across small firms as well as large firms. To address this question, specifications (3) and (4) report size-segmented sub-sample results.8 The sub-sample of small (large) firms consists of the bottom (top) 50% of firms in each country in terms of market equity, measured as of June of each year. Though the MAX momentum premium is somewhat more pronounced among smaller firms, as it is the case for most other return anomalies, it is not limited to small firms but also significantly present among the largest and economically most important firms in international equity markets. In contrast, we do not find that the MIN strategy produces significant momentum profits among small firms or large firms.
Finally, specifications (5) to (7) provide regional evidence by dividing the EAFE international sample into three major regions in line with Fama and French (2012, 2017).
Asia-Pacific includes Australia, Hong Kong, New Zealand, and Singapore. With the exception of Japan, which represents a region of its own, Europe encompasses the remaining sample countries (see Panel A of Table 2.1). We observe that the MAX momentum premium is strong in terms of economic and statistical significance among Asian-Pacific and European equity markets. On the other hand, we do not find that taking into account expected return characteristics like firm size and book-to-market in the selection of winners and losers
8 To be consistent with the intended size segmentation, the MAX and MIN strategies use tercile classifications based on the SZ, BM, and MOM distributions among the bottom or top 50% of firms and not across all sample firms.
25
produces significant momentum profits in Japan.9 This result is, however, consistent with Asness (2011) and others who have documented that momentum-based investment strategies do not seem to work among Japanese firms. The regional results for the MIN strategy corroborate in general our international cross-country findings of insignificant momentum profits on this type of strategy. The only exception is Europe, where the MIN momentum premium tends to be statistically significant, but in terms of its economic magnitude, it is still less than half of the corresponding European MAX momentum premium.
After having addressed the robustness of our main findings across time, firm size, and regions, we further study the MAX and MIN momentum premiums conditional upon business conditions. It is well known that the profits of momentum strategies vary with the general state of the economy. They tend to be large during expanding/optimistic states and small during contracting/pessimistic states (Jegadeesh and Titman, 2011). To address whether the MAX and MIN strategies conform to the same pattern observed for standard momentum strategies, we estimate firm-level cross-sectional regressions based on equation (1) for two different specification variants that differ in the underlying state of the economy, i.e., contracting/pessimistic versus expanding/optimistic. We measure the two economic states using six different proxies based on market volatility, market states, investor sentiment, market liquidity, default spread, and the NBER recession indicator. The first two measures are based on international EAFE data, while the remaining measures are based on U.S. data in lack of appropriate cross-country proxies. The use of U.S.-based variables outside the
9 In light of this finding, we also have tested whether Japanese firms are influential in our inference that the MAX strategy is superior to the MIN strategy in international equity markets. For instance, the weighting of Japanese firms in the international MAX and MIN strategies could be responsible for the observed return difference. First, the average share of Japanese firms in the long leg portfolios is with values of 25.99%
(MAX) and 25.09% (MIN) very similar across the two strategies. Only the short leg portfolios show on average a greater exposure to Japanese firms for the MAX strategy of 37.98% in comparison to 25.16% for the MIN strategy. Second, replicating the performance analysis for the MAX and MIN strategies in an international sample that excludes Japan (EAFE ex Japan) in analogy to Table 2, yields an average MAX momentum premium of 10.23% per year (t-statistic of 4.45) and an average MIN momentum premium of 2.24% per year (t-statistic of 1.32). Thus, the lack of momentum profits among Japanese firms cannot account for the inference that the MAX strategy is superior to the MIN strategy.
26
United States can be motivated by Baker et al. (2012) who show that sentiment is contagious across countries and particularly driven by the U.S. sentiment. Furthermore, Rapach et al.
(2013) document that the United States possesses, as the world’s largest and most important equity market, a leading role for international markets.
The proxies are defined as follows. Market volatility is the annual standard deviation of the value-weighted EAFE market portfolio returns over the 12 months prior to the beginning of the strategies’ holding period (Baker and Wurgler, 2006). Following Cooper et al. (2004), the market state is measured based on the cumulative return on the value-weighted EAFE market portfolio over the 36 months prior to the beginning of the strategies’ holding period.
To capture investor sentiment, we rely on the monthly U.S. sentiment index constructed by Baker and Wurgler (2006).10 To measure market liquidity, we employ Hu et al.’s (2013) noise index, which is based on the aggregate noise in the prices of U.S. Treasury bonds, i.e., the differences between market and model-implied yields.11 In light of the fact that the U.S.
Treasury bond market is one of the most active and liquid markets in the world and one with the highest credit quality, the level of noise in this market can be used as a market-wide measure of liquidity. In line with Fama and French (1993), the default spread is the monthly difference between the yield on an index of 10-year U.S. corporate bonds and 10-year U.S.
Treasury bonds.12 Finally, the NBER recession indicator for the United States is used to separate crisis from non-crisis periods over the sample period. Except for market states and the NBER recession indicator, the median of the given economic state proxy over the sample period is used to define periods of low and high values on that measure. Positive (negative) 36-month market returns separate up (down) market states.
10 The sentiment index is available at Jeffrey Wurgler’s website: http://pages.stern.nyu.edu/~jwurgler/. The index time series runs until September 2015.
11 The noise index is available at Jun Pan’s website: http://www.mit.edu/~junpan/. The index time series runs until December 2016. The data is provided on a daily basis. We employ the index’s daily end-of-month values for our analysis.
12 An appropriate U.S. corporate bond index is available in Datastream from April 2002 on.
27
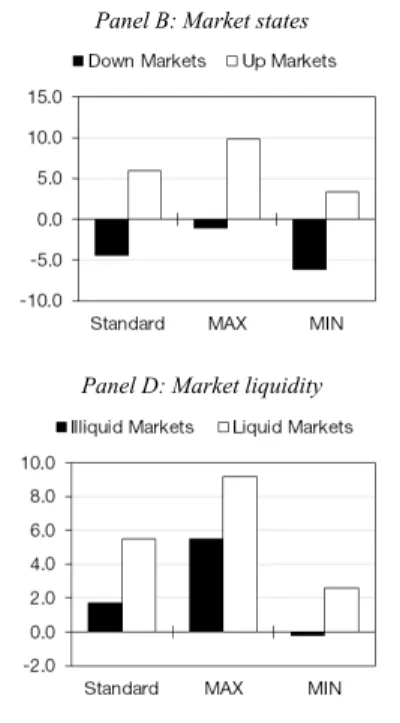
Figure 2.1 illustrates the average return premiums associated with the standard, MAX, and MIN momentum strategies during contracting/pessimistic business conditions (black bars) and expanding/optimistic business conditions (clear bars), as measured by the six different economic state proxies (Panels A to F). As before, the premiums are derived from the differences between the long and short leg coefficient estimates from the outlined firm-level cross-sectional regression setting that includes common return controls and country dummies.
First, regardless of the applied economic state proxy, the standard and MAX strategies are associated with significantly positive average return premiums during expanding/optimistic periods. Across the six proxies, the average momentum profits here amount to 5.56% per year on the standard strategy and 9.57% per year on the MAX strategy. During contracting/pessimistic periods, we do, however, not find that the standard and MAX momentum premiums are statistically significantly different from zero. The MIN momentum premium is in general insignificant in both states of the economy. The only two exceptions, where we find significantly positive momentum profits on this type of strategy are periods of low market volatility and after positive 36-month market returns (up markets).
Second, conducting difference-of-means tests on the strategies’ average momentum profits during a given economic state corroborates our previous inference on the superiority of the MAX strategy. Regardless of the applied economic state proxy and irrespective of the given economic state, the differences between the MAX and standard momentum premiums are always significantly positive and statistically significant. The same is true for the differences between the MAX and MIN momentum premiums. Hence, the MAX strategy is superior in comparison to the standard and MIN momentum strategies during contracting/pessimistic as well as expanding/optimistic periods. Comparing the MIN strategy relative to the standard strategy, we observe that the differences in premiums are persistently significantly negative during expanding/optimistic periods, while they are in general insignificant during contracting/pessimistic periods.
28
Figure 2.1 Momentum premiums conditional upon business conditions
Panel A: Market volatility Panel B: Market states
Panel C: Investor sentiment Panel D: Market liquidity
Panel E: Default spread Panel F: NBER recession indicator
This figure illustrates the average return premiums associated with the standard, MAX, and MIN strategies in percent per year during contracting/pessimistic business conditions (black bars) and expanding/optimistic business conditions (clear bars), as measured by six different economic state proxies (Panels A to F).
29
In sum, the results in this section are consistent with hypothesis H1. Similar to the prior U.S.
evidence, we observe that the MAX strategy produces significantly larger benchmark- adjusted returns than the MIN strategy and the standard momentum strategy in non-U.S.
equity markets over holding periods up to one year.
2.4 Longer holding period returns
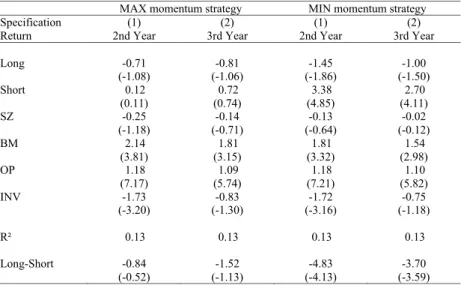
Following the insights of Conrad and Yavuz (2017), we test in this section hypothesis H2 that the MAX strategy displays no return reversal, while the MIN strategy exhibits significant return reversal over holding periods beyond one year. To explore whether their U.S. findings carry over to international equity markets, we estimate different firm-level cross-sectional regressions nested within equation (1), where the dependent variable now is the longer holding period return computed over the second and third year after the measurement of the strategies’ underlying firm characteristics.
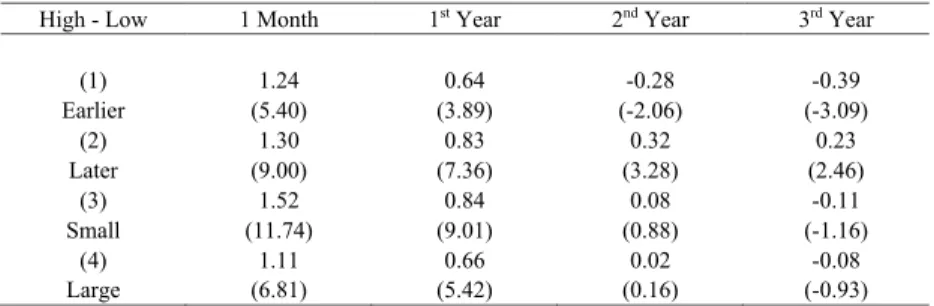
Table 2.4 presents average coefficient estimates from the outlined firm-level cross-sectional regression for the two year-to-year holding periods. The results document that selecting winners and losers conditional upon their expected return characteristics based on firm size and book-to-market also has a major impact on the behavior of longer holding period returns.
While the MAX strategy yields strong momentum profits in the first year (see Table 2.2), it does not display significant return reversals in the following two years. The average coefficient estimates on Long and Short as well as the resulting (long-short) MAX momentum premium are all statistically indistinguishable from zero. This is in sharp contrast to the MIN strategy which does not produce significant momentum profits in the first year but suffers from substantial return reversals in the subsequent years. The average MIN momentum premium is -4.83% per year in the second year and -3.70% in the third year. As indicated by significantly positive short-leg returns, the reversal is primarily driven by the rebound of the strategy’s short leg that generates benchmark-adjusted returns of around 3%
per year.
30
Table 2.4 Longer holding period returns of MAX and MIN momentum strategies MAX momentum strategy MIN momentum strategy
Specification (1) (2) (1) (2)
Return 2nd Year 3rd Year 2nd Year 3rd Year
Long -0.71 -0.81 -1.45 -1.00
(-1.08) (-1.06) (-1.86) (-1.50)
Short 0.12 0.72 3.38 2.70
(0.11) (0.74) (4.85) (4.11)
SZ -0.25 -0.14 -0.13 -0.02
(-1.18) (-0.71) (-0.64) (-0.12)
BM 2.14 1.81 1.81 1.54
(3.81) (3.15) (3.32) (2.98)
OP 1.18 1.09 1.18 1.10
(7.17) (5.74) (7.21) (5.82)
INV -1.73 -0.83 -1.72 -0.75
(-3.20) (-1.30) (-3.16) (-1.18)
R² 0.13 0.13 0.13 0.13
Long-Short -0.84 -1.52 -4.83 -3.70
(-0.52) (-1.13) (-4.13) (-3.59)
This table presents average coefficient estimates and associated Newey-West adjusted t-statistics (in parentheses) from monthly firm-level cross-sectional regressions. The dependent variable is the firm’s second-year or third-year return after the measurement of the strategies’ underlying firm characteristics. See Table 2.2, for a description of the independent variables. R² is adjusted for degrees of freedom. The last row provides the average return premium associated with the given strategy in percent per year based on the difference between the long and short leg coefficient estimates.
Taken together, the results in this section strongly support hypothesis H2. Short-term return continuation and long-term return reversals are not necessarily linked. Taking into account expected return characteristics like firm size and book-to-market in the selection of winners and losers helps to ex ante separate momentum stocks that display return reversals from those that do not.
31 2.5 A mispricing-based explanation
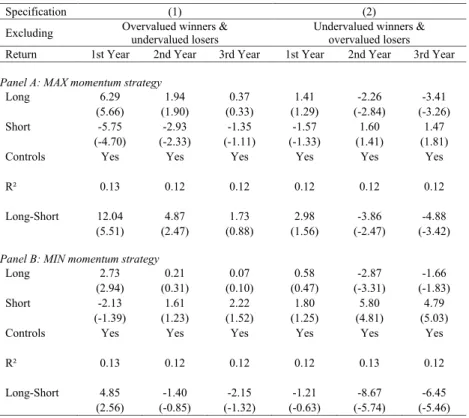
In this section, we test our final hypothesis H3 that the strong performance of the MAX strategy and the weak performance of the MIN strategy are the outcome of mispricing. Even though Conrad and Yavuz (2017) argue in favor of a risk-based explanation, they do not rule out the possibility that the varying MAX and MIN momentum premiums may be attributable to cross-sectional mispricing. In particular, they only study whether the U.S. premiums are related to market states and investor sentiment. Lagged market returns and the investor sentiment index are commonly used as market-wide proxies for mispricing that reflect aggregate investor confidence or risk aversion which may cause delayed overreaction among investors and therefore provide an explanation for the observed momentum pattern in average stock returns. However, both explanations fall short to explain the MAX and MIN momentum premiums. Though the level of market-wide mispricing may explain the varying strength of the momentum premium across time, existing mispricing at one point in time can also vary across firms (Hirshleifer and Jiang, 2010; Walkshäusl, 2016).
Following this reasoning, we explicitly investigate the aspect of cross-sectional mispricing as an explanation for the significantly different return behavior of the MAX and MIN strategies. To proxy for systematic mispricing, we employ the firm’s external financing behavior as measured by Bradshaw et al.’s (2006) XFIN variable. Positive values on XFIN indicate issues, while negative values indicate repurchases. The opportunistic financing hypothesis (Ikenberry et al., 1995; Loughran and Ritter, 1995) suggests that firms issue additional capital when prices are high and repurchase outstanding capital when prices are low. Thus, issues (repurchases) provide signals of potential overvaluation (undervaluation) based on the management’s private assessment of the firm’s intrinsic value relative to the market. Thus, if cross-sectional mispricing drives the return behavior of the MAX and MIN strategies, the realized momentum profits on the two strategies should consequently differ when the underlying momentum stocks are either perceived as overvalued or undervalued.