1
MATLAB
www.mathworks.de
The MathWorks (Natick/MA/USA) Studentenversion < 100 $
SCILAB
www.scilab.org
Scilab Consortium (École Polytechnique ... ... Renault) kostenloses Download
MATLAB als Taschenrechner
>> 3+2 ans = 5 Funktionen
>> sqrt(25) ans = 5 Konstanten
>> pi
ans = 3.1416 Hilfe
>> help
HELP topics ...
>> help sqrt
SQRT Square root
3
Wertzuweisungen
>> a=1 a = 1
>> a=a+1 a = 2
Name = Datentyp (Wert)
>> x=int32(9.6) x = 10
>> y=3.5+2.1i
y = 3.5000 + 2.0000i
>> wort='quatsch' wort = quatsch
Datentypen:
int32 4 Byte double 8 Byte
char 2 Byte
...
Vektoren und Matrizen
>> v1=[1, 2, 3]
v1 = 1 2 3
>> v2=[1; 2; 3]
v2 = 1 2 3
>> v2'
ans = 1 2 3
>> mat=[1, 2; 3, 4]
mat=
1 2 3 4
Semikolon unterdrückt Ausgabe
>> x=x+1;
5
Verzeichnis der Variablen
>> who
a mat v1 v2 wort x y
>> whos
Name Size Bytes Class
a 1x1 8 double array mat 2x2 32 double array
v1 1x3 24 double array v2 3x1 24 double array
wort 1x7 14 char array x 1x1 4 int32 array
y 1x1 16 double array (complex)
Variablen löschen
>> clear v1
>> clear all
>> clear global
Alternative: Wird auch im Matlab workspace angezeigt
Verzeichnisse und m-Dateien
>> pwd
ans = C:\My Documents
>> dir My Music My Pictures My Videos matfiles
>> ls My Music My Pictures My Videos matfiles
>> cd 'My Music'
>> cd ..
>> cd matfiles
>> helloworld text =
Hello World
C:\My documents\matfiles\helloworld.m text = 'Hello World'
7
Rechenoperationen
>> e1=a+a e1 = 4
>> e2=a*e1 e2 = 8
>> e3=e1–e2 e3 = –4
>> e4=e2/e1 e4 = 2
>> e5=e2^2 e5 = 64
>> e6=v1*v2 e6 = 14
>> e7=v1'*v2' e7 =
1 2 3 2 4 6 3 6 9
aber
>> e8=v1*v1
??? Error using ==> mtimes
Inner matrix dimensions must agree.
aber:
>>e9=v1.*v1 e9=1 4 9
Ausgabe
>> cd matfiles
>> helloworld Hello World
>> fprintf('x = %d \n', 5) x = 5
>> fprintf('x = %f \n', 5) x = 5.000000
>> fprintf('x = %e \n', 5) x = 5.000000e+000
>> fprintf('x = %f4.2 \n', 5) x = 5.00
>> fprintf('x = %g \n', 5) x = 5
>> fprintf('x = %g \n', 0.0000005) x = 5e-007
>> text = 'aua'
>> fprintf('%s \n', text)
C:\My documents\matfiles\helloworld.m
text = 'Hello World';
disp(text) oder
fprintf('Hello World \n');
9
Eingabe
>> cd matfiles
>> wurzel
Bitte Wert eingeben: 5
Danke, die Wurzel ist 2.236068 Datei schreiben
>> fid = fopen('Wichtige_Daten.dat', 'w');
>> fprintf(fid, '%f \n',pi);
>> fclose(fid);
>> save –ascii Unwichtige_Daten.dat v1 Datei lesen
>> fid = fopen('Wichtige_Daten.dat', 'r');
>> wert = fscanf(fid,'%f');
>> fclose(fid)
>> load –ascii Unwichtige_Daten.dat
>> Unwichtige_Daten
Unwichtige_Daten = 1 2 3
C:\My documents\matfiles\wurzel.m
wert=input('Bitte Wert eingeben: ');
antwort=sqrt(wert);
fprintf('Danke, die Wurzel ist %f \n',antwort);
Schleifen
>> for k=1:5 x(k)=k^2;
end
>> x
x = 1 4 9 16 25
>> for k=1:2:5 k^2
end ans = 1 ans = 9 ans = 25
>> z=10;
>> while (z > 0) z=z–1
end z = 9 ...
z = 0
Vergleichsoperatoren
<
<=
>=
>
==
~=
11
Bedingungen
>> k = 5;
>> if (k >= 0)
fprintf('Heureka! \n') end
Heureka!
>> k = 5;
>> if (k=0) || (k>0) fprintf('Heureka! \n') end
Heureka!
>> if (k = 0) ...
elseif (k=1) ...
else
if(k>0) ...
end end
Logische Operatoren
&& und || oder ~ nicht
Matrizen erzeugen
>> mat = [1, 2; 3, 4]
mat=
1 2 3 4
Es geht auch anders
>> a(2,4) = 5 a = 0 0 0 0 0 0 0 5
>> b = zeros(2,4) b = 0 0 0 0
0 0 0 0
>> b = ones(2,4) b = 1 1 1 1
1 1 1 1
>> c = eye(2,4) c = 1 0 0 0
0 1 0 0
>> d = rand(2,4)
d = 0.93 0.79 0.46 0.63
Zufallszahlen zwischen 0 und 1
rand
rand(n,m)
normal ("Gauß-")verteilte Zufallszahlen randn(n,m)
oder auch
rand + rand + rand + rand + rand + rand + ...
rand + rand + rand + rand + rand + rand – 6.
13
Der Doppelpunkt
>> for k = 1:6 x(k)=2*k–1;
end
>> x
x = 1 3 5 7 9 11
>> x = 1:2:11
x = 1 3 5 7 9 11
>> mat = eye(4) mat = 1 0 0 0 0 1 0 0 0 0 1 0 0 0 0 1
>> y = mat(3,:) y = 0 0 1 0
>> plot( mat(3,:))
Grafik plot
>> x = 1:0.1:50
>> y = sin(x)
>> plot(y)
>> plot(x,y)
>> axis( [3.0 12.0 -1.5 1.5])
>> xlabel('time')
>> ylabel('amplitude \alpha')
>> title('\alpha = sin \omega t')
>> text(7,1.1,'peak')
>> text(5,-1.2,'valley')
15
Grafik plot
>> x = 1:0.1:50
>> y = sin(x)
>> plot(x)
>> plot(y)
>> plot(x,y)
>> axis( [3.0 12.0 -1.5 1.5])
>> grid on
>> xlabel('time')
>> ylabel('amplitude \alpha')
>> title('\alpha = sin \omega t')
>> text(7,1.1,'peak')
>> text(5,-1.2,'valley')
>> y2 = sin(x-1)
>> hold
>> plot(x,y2,'r-o')
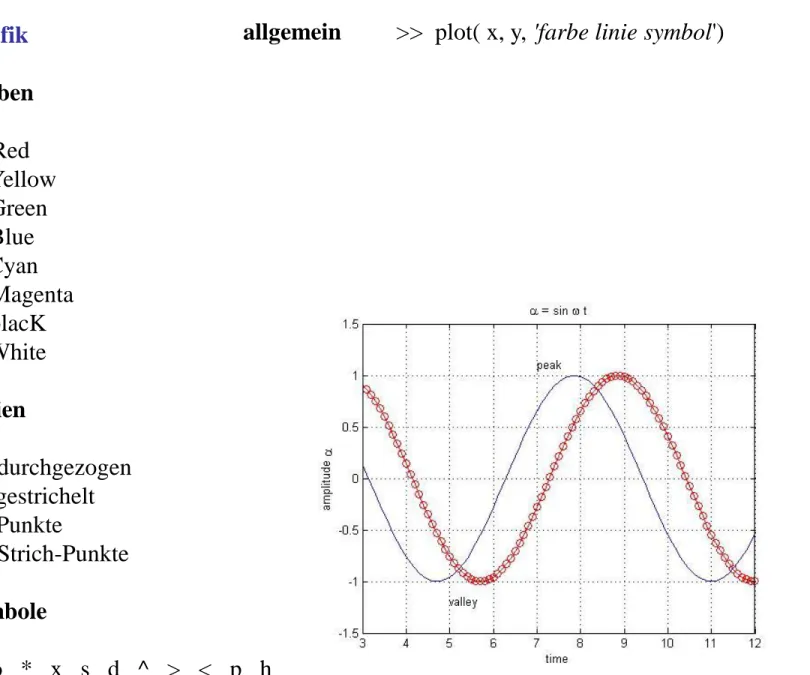
Grafik Farben
r Red y Yellow g Green b Blue c Cyan m Magenta k blacK w White Linien
- durchgezogen _ gestrichelt : Punkte
-. Strich-Punkte Symbole
+ o * x s d ^ > < p h
allgemein >> plot( x, y, 'farbe linie symbol')
17
3d-Grafik
>> plot(v)
>> mesh(v)
>> waterfall(v)
3d-Grafik
>> surf(v)
>> view( [0 90] )
>> shading interp
19
3d-Grafik
>> x = 0:0.1:20
>> plot3(cos(x),sin(x),x,'r–s')
Weitere Spielereien Ein Ton (ca. 500 Hz)
>> y = ones(10000,1);
>> for k = 1:5000 y(2*k) = -1;
end
>> sound(y,1000)
Angenehmere Töne
>> load handel
>> sound(y,Fs)
Mehrere Bilder mit subplot
>> subplot(2,1,1)
>> plot(y)
>> subplot(2,1,2)
Ha- le- luja ha- le- luja haleluja haleluja ha- le- lu- jaaa
![Grafik plot >> x = 1:0.1:50 >> y = sin(x) >> plot(y) >> plot(x,y) >> axis( [3.0 12.0 -1.5 1.5]) >> xlabel('time') >> ylabel('amplitude \alpha')](https://thumb-eu.123doks.com/thumbv2/1library_info/3776390.1513370/14.1080.566.915.39.772/grafik-plot-plot-plot-xlabel-ylabel-amplitude-alpha.webp)