Impact of Hydroxyglutarate on Dendritic Cell Activation
DISSERTATION ZUR ERLANGUNG DES
DOKTORGRADES DER NATURWISSENSCHAFTEN (DR. RER. NAT.) DER FAKULTÄT FÜR BIOLOGIE UND VORKLINISCHE MEDIZIN
DER UNIVERSITÄT REGENSBURG
vorgelegt von
Zugey Elizabeth Cárdenas Conejo Aus
Lázaro Cárdenas, Michoacán México
im Jahr 2018
II The present work was carried out from November 2013 to December 2017 at the Department of Internal Medicine III at the University Hospital Regensburg.
Die vorliegende Arbeit entstand im Zeitraum von November 2013 bis December 2017 an der Klinik und Poliklinik für Innere Medizin III des Universitätsklinikums Regensburg.
Das Promotionsgesuch wurde eingereicht am:
27 March 2018
Die Arbeit wurde angeleitet von:
Prof. Dr. Marina Kreutz
Prüfungsausschuss:
Vorsitzender: Prof. Dr. Stephan Schneuwly Erstgutachter: Prof. Dr. Marina Kreutz
Zweitgutachter: Prof. Dr. Wolfgang Müller-Klieser
Drittprüfer: Prof. Dr. Wolfram Gronwald
Ersatzprüfer: Prof. Dr. Richard Warth
--- Signature
III
Table of Contents
Table of Contents ... III List of Figures ... VI List of Tables ... VIII List of Abreviations ... IX
1. Introduction ... 1
1.1 GLIOMA ... 1
1.2 GLIOBLASTOMAS ... 2
1.2.1 Molecular basis for the development of GBMs ... 3
1.3 GLIOBLASTOMA AND METABOLISM ... 4
1.3.1 Warburg Effect ... 4
1.3.2. Isocitrate dehydrogenase (IDH) and tumor cell metabolism ... 5
1.4 THE ROLE OF TUMOR STROMA IN MALIGNANT GLIOMAS ... 7
1.5 IMMUNE BIOLOGY ... 7
1.5.1 Innate Immunity ... 8
1.5.2 Adaptive Immunity ... 8
1.5.3 Antigen Presenting Cells (APCs) ... 9
1.5.4 Cytokines ... 10
1.6AIM ... 13
2. Material ... 14
2.1EQUIPMENT ... 14
2.1.1 Cell Culture ... 14
2.1.2 Elutration ... 14
2.1.3 Lysate, Isolation and PCR ... 15
2.1.4 Western Blot ... 15
2.1.5 Flow Cytometry ... 16
2.1.6 Respirometry ... 16
2.2CONSUMABLES ... 16
2.2.1 Cell Culture ... 16
2.2.2 Lysate, Isolation and PCR ... 17
2.2.3 Western Blot ... 17
2.3REAGENTS ... 17
2.3.1 Cell Culture ... 17
2.3.2 Elutration ... 18
2.3.3 Lysate, Isolation and PCR ... 18
2.3.4 Western Blot ... 18
2.3.5 Flow Cytometry ... 18
2.3.6 Respirometry ... 19
2.3.7 Inhibitors and Metabolites ... 19
2.3.8 Antibodies for Western Blot ... 19
2.3.9 Molecular Kits ... 20
2.3.10 Molecular weight standard proteins ... 21
2.3.11 Primers for qRT-PCR ... 21
2.3.12 Antibodies for Flow cytometry ... 21
2.4CELL LINES ... 22
2.5SOFTWARE ... 22
2.5.1 Software for qRT-PCR ... 22
3. Methods ... 23
IV
3.1STANDARD CELL CULTURE PROCEDURES ... 23
3.1.1 Freezing and Thawing ... 23
3.1.2 Splitting of adherent cells ... 23
3.2CELL TYPES AND CULTURE CONDITIONS ... 23
3.2.1 Cancer cell lines U87, TP365 ... 23
3.2.2 Immune Cells ... 24
3.3MEASUREMENT OF CYTOKINES AND LACTATE ... 25
3.3.1 Enzyme Linked Immunosorbent Assay (ELISA) ... 25
3.3.2 Enzymatic determination of lactate ... 26
3.4CELL COUNTING WITH A CELL ANALYZER (CASY SYSTEM) ... 26
3.5RNA/PROTEIN LYSATES ... 26
3.5.1 RNA ... 26
3.5.2 Protein ... 27
3.6WESTERN BLOT ANALYSIS ... 28
3.6. 1 Preparation of Sodium Dodecyl Sulfate (SDS) Gel ... 28
3.6.2 Western Blot ... 30
3.6.3 Immunodetection ... 31
3.6.4 Loading control ... 32
3.7RNAISOLATION AND DETERMINATION ... 33
3.7.1 Preparation of RNA lysate ... 33
3.8REAL-TIME QUANTITATIVE PCR(RT-QPCR) ... 34
3.8.1 Reverse Transcription PCR (RT-qPCR) ... 34
3.8.2 Quantitative Real-Time PCR (qPCR) ... 34
3.9RESPIROMETRY ... 35
3.10FLUORESCENCE ACTIVATED CELL SORTING ... 36
3.10.1 Extracellular Staining ... 37
3.10.2 Intracellular staining. ... 37
4. Results ... 38
4.1IMPACT OF HG ON DENDRITIC CELLS ... 38
4.1.1 Effect of HG on cytokines production. ... 38
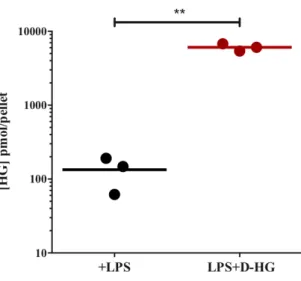
4.1.2 Uptake of D-HG by Dendritic Cells. ... 40
4.1.3 The role of D-HG in TLR signaling pathway ... 41
4.1.4 The impact of HG on Mitochondrial Respiration ... 54
4.1.5 Gene Expression in DCs treated with D-HG. ... 65
4.1.6 The role of HG on LPS-induced DC maturation ... 67
4.1.7 The impact of HG on the differentiation of DCs ... 68
4.2GLIOBLASTOMA CELL LINES ... 72
4.2.1 U87 ... 72
4.2.2 TP365 ... 74
5. Discussion ... 76
5.1EFFECT OF HG ON THE SHORT TERM LPS RESPONSE OF IMMATURE DCS ... 77
5.2.LONG TERM EFFECTS OF HG ON DC DIFFERENTIATION ... 78
5.3.IMPACT OF HG ON TLR SIGNALING ... 79
5.3.1 Impact of G-Protein-coupled receptors and cAMP on IL-12 production ... 80
5.4THE ROLE OF HG ON MITOCHONDRIAL RESPIRATION AND LACTATE PRODUCTION OF DENDRITIC CELLS ... 81
5.5EFFECT OF HG ON THE RNA EXPRESSION OF DENDRITIC CELLS ... 83
6. Summary ... 86
7. Zusammenfassung ... 88
8. References ... 90
9. Index ... 106
V
9.1EFFECT OF D-HG AND Α-KETOGLUTARATE ON THE RNA EXPRESSION OF DENDRITIC CELLS ... 106 Acknowledgements ... 109
VI
List of Figures
Figure 1.1. Astrocytoma classification in the updated 2016 Central Nervous System WHO
classification ... 2
Figure 1.2. The role of IDH in metabolism of gliomas ... 6
Figure 1.3. LPS-stimulated pathways associated with IL-12 regulation ... 12
Figure 4.1. Effects of D-HG on IL-12 subunits ... 39
Figure 4.2. Impact of D-HG and L-HG on IL-12 and IL-10 secretion of dendritic cells ... 40
Figure 4.3. Uptake of HG by DCs ... 41
Figure 4.4. Schematical representation of TLR signaling pathways and their relation with IL-12 production by DCs ... 42
Figure 4.5. NF-κB stimulates IL-12 production in DCs ... 43
Figure 4.6. Expression of IκB protein in DCs ... 43
Figure 4.7. HIF involvement in IL-12 production by DCs ... 44
Figure 4.8. Expression of HIF-1α in DCs ... 45
Figure 4.9. PI3-Kinase pathway and IL-12 production by DCs ... 46
Figure 4.10. Expression of P-Akt and Akt in DCs ... 47
Figure 4.11. Expression of p38 protein in DCs ... 48
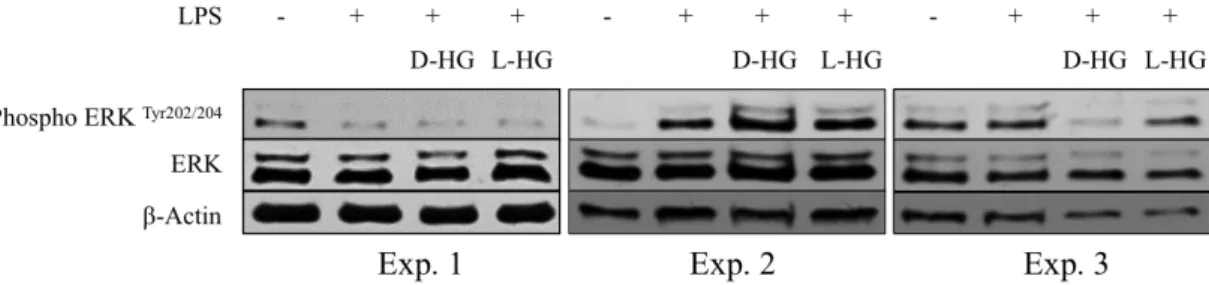
Figure 4.12. Expression of ERK protein in DCs ... 49
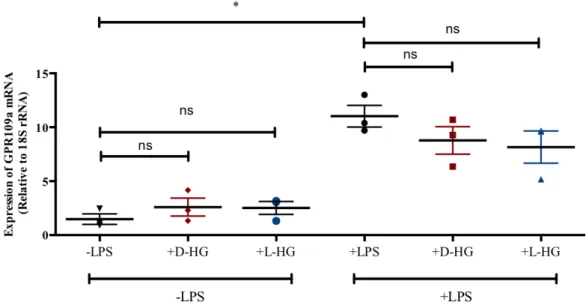
Figure 4.13. Effect of HG on GPR109a expression ... 50
Figure 4.14. Effect of nicotinic acid on IL-12 production by DCs ... 51
Figure 4.15. IL-12 production by DCs under HG and nicotinic acid treatment ... 51
Figure 4.16. Effect of cAMP and cAMP modulators on IL-12 production by dendritic cells . 52 Figure 4.17. Effect of D-HG on cAMP levels ... 53
Figure 4.18. Oxygen consumption of DCs in the presence of D-HG ... 54
Figure 4.19. Oxygen consumption of DCs in the presence of D-HG ... 55
Figure 4.20. Routine respiration of DCs in the presence of D-HG ... 56
Figure 4.21. Correlation of LPS induced inhibition in ROUTINE respiration in relation to IL-12 secretion by DCs ... 56
Figure 4.22. Impact of D-HG on Leak and ATP related oxygen consumption in DCs ... 57
Figure 4.23. Electron Transfer System capacity (ETS) is affected by D-HG in DCs ... 58
Figure 4.24. Respiratory complexes on DCs treated with D-HG ... 59
Figure 4.25. Effect of oligomycin and rotenon on IL-12 production by DCs ... 60
Figure 4.26. Effect of CsA on IL-12 production by dendritic cells ... 61
Figure 4.27. Routine respiration and oxygen consumption related to ATP production of DCs in the presence of CsA ... 62
VII Figure 4.28. Percentual representation of LPS inhibition on DCs treated with CsA and D-
HG ... 63
Figure 4.29. Routine respiration of DCs in the presence of CsA after 2hrs ... 63
Figure 4.30. Impact of D-HG on lactate secretion in supernatants of activated DCs ... 64
Figure 4.31. Effect of D-HG on DC maturation ... 68
Figure 4.32. Effect of HG on DC IL-12 secretion ... 69
Figure 4.33. Impact of D-HG on the differentiation of monocytes into immature DC ... 70
Figure 4.34. Impact of D-HG on DC maturation ... 71
Figure 4.35. Routine respiration of U87 in the presence of D-HG ... 72
Figure 4.36. Impact of D-HG on ATP related oxygen consumption U87 cells ... 73
Figure 4.37. Routine respiration of TP365 in the presence of D-HG ... 74
Figure 4.38. Impact of ATP related oxygen consumption in TP365 cells ... 75
VIII
List of Tables
Table 1.1 Glioblastoma classification based on the presences of IDH mutation ... 3
Table 3.1 Elutriation parameter and cell types ... 24
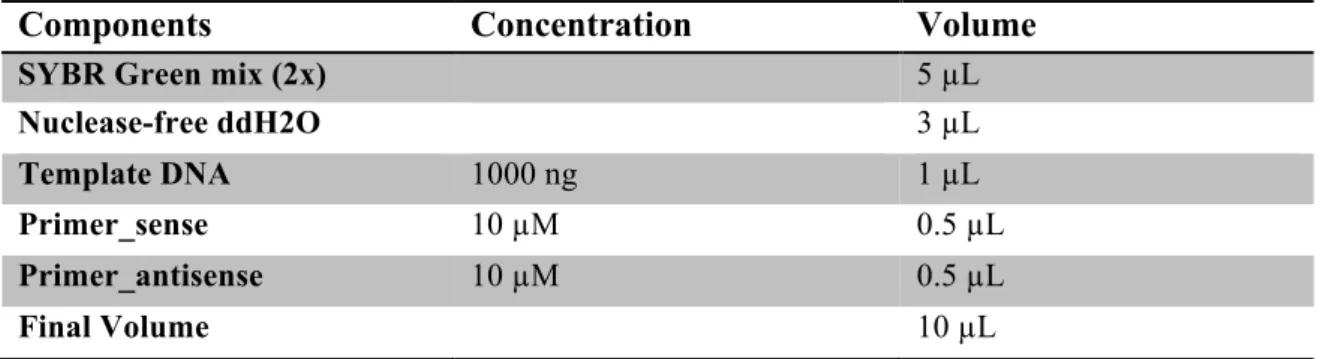
Table 3.2 RT-qPCR reaction composition ... 35
Table 3.3 Cycling protocol for RT-qPCR ... 35
Table 4.1 Genes Upregulated in DCs by D-HG ... 66
Table 4.2 Genes Downregulated in DCs by D-HG ... 67
Table 9.1 Top 30 genes up regulated by the effect of D-HG and Di-Keto ... 106
Table 9.2 Top 30 genes downregulated by the effect of D-HG and Di-Keto ... 107
IX
List of Abreviations
Abreviations Definition
Acetyl-CoA Acetyl coenzyme A
Akt Protein Kinase B
AMP Adenosine Monophosphate APC Antigen-Presenting cell
APS Ammonium persulfate
ATP Adenosin triphosphate
BSA Bovine Serum Albumin
CD Cluster of differentiation
cDNA Copy DNA
CIMP CpG island methylator phenotype
CO2 Carbon dioxide
COX Cyclo oxygenase
CREB cyclic AMP response element-binding CSF Colony-stimulating factor
CTLA-4 Cytotoxic T lymphocyte-associated protein 4 CXCL2 Chemokine (C-X-C motif) ligand 2
DAPI 4',6-diamidino-2-phenylindole DCs Dendritic cells
D-HG D-2-Hydroxyglutarate
DMEM Dulbecco Modified Eagle Medium DMSO Dimethyl sulfoxide
DNA Deoxyribonucleic acid
dNTPs 2’-deoxyribonucleosid-5’-triphosphates dsDNA double-stranded DNA
DSMZ Deutsche Sammlung von Mikroorganismen und Zellkulturen ECL Enhanced chemiluminescence
ECM Extracellular matrix
EDTA Ethylene diamine tetraacetate EGFR Epidermal growth factor receptor EGTA Ethylene glycol tetraacetic acid ELISA Enzyme-linked immunosorbent assay ETC Electron Transport Chain
ETS Electron Transport System F-FDG 18F-fluorodeoxyglucose
FACS Fluorescence-activated cell sorting
FCCP Carbonyl cyanide-p-trifluoromethoxyphenylhydrazone FCS Fetal calf serum
FDH Formate Dehydrogenase
FH Fumarate hydratase
FITC Fluorescein isothiocyanate
18F-FLT 18F-fluorothymidine
X
FSC Forward scatter
GBM Glioblastoma Multiforme GLUT Glucose transporter
GM-CSF Granulocyte-macrophage colony-stimulating factor GTP Guanosine triphosphate
H2O2 Hydrogen peroxide H2Obidest Double-distilled water
H2OUSB Diethylpyrocarbonate treated RNAse-free water (USB Corporation) HCl Hydrochloric acid
HG 2-Hydroxyglutarate
HIF Hypoxia-inducible factor HLA Human Leukocyte Antigen
HPLC High-performance liquid chromatography HRP Horse raddish peroxidase
IDH Isocitrate dehydrogenase
IFN Interferon
Ig Immunoglobulin
IGF Insulin-like growth factor
IL Interleukin
IRF-1 Interferon regulatory factor 1
JAK Janus Kinase
JHDM JmjC-domain-containing histone demethylase proteins JNK c-Jun N-terminal kinase
KG Ketoglutarate
LBP LPS-binding Protein L-HG L-2-Hydroxyglutarate LOH Loss of hererozygosity LPS Lipopolysaccharide
M-MLV Murine moloney leukemia virus MAP mitogen- activated protein MAPK mitogen- activated protein kinase MCT Monocarboxylate transporter MDSCs Myeloid-derived suppressor cells MHC Major histocompatibility complex
miR Micro RNA
MMP Matrix Metalloprotease
mRNA Messenger RNA
NAD Nicotinamide adenine dinucleotide
NADP Nicotinamide adenine dinucleotide phosphate
NADPH Nicotinamide adenine dinucleotide phosphate-oxidase
NF-κB Nuclear factor kappa-light-chain-enhancer of activated B cells NFAT Nuclear factor of activated T cells
NK Natural killer
NMR Nuclear Magnetic Resonance
NO Nitric oxide
XI NOS Nitric oxide synthase
OXPHOS Oxidative phosphorylation PBS Phosphate buffered saline
PBST Phosphate buffered saline with Tween 20 PCR Polymerase chain reaction
PD-1 Programmed cell death 1 PD-L1 Programmed cell death ligand 1
PDGFRA Platelet Derived Growth Factor Receptor α PDH Pyruvate dehydrogenase
PDK1 Pyruvate dehydrogenase kinase 1
PE Phycoerythrin
PET Positron emission tomography PHDs Prolyl hydroxylases
PI3K Phosphoinositide 3-kinase PTEN Phosphatase and tensin homolog PVDF Polyvinylidene difluoride qRT-PCR Quantitative real-time PCR
RNA Ribonucleic acid
ROCK RhoA/Rho kinase ROS Reactive oxygen species ROX Residual Oxygen consumption
RPMI Roswell Park Memorial Institute medium
RT Room Temperature
SDH Succinate dehydrogenase
SDS-PAGE Sodium dodecylsulfate polyacrylamide gel electrophoresis SEM Standard error of the mean
shRNA Short hairpin RNA siRNA Small interfering RNA
SSC Side scatter
STAT3 Signal transducer and activator of transcription 3 TAMs Tumor-associated macrophages
TBS Tris buffered saline TBST TBS buffer + Tween 20 TCA Tricarboxylic acid TCR T cell receptor
TEMED N,N,N’,N’-tetramethylethylenediamine TET2 Tet oncogene family member 2
TGF Transforming growth factor
Th T helper
TIR Toll/interleukin 1 receptor
TIRAP TIR domain containing adaptor protein TLR Toll-like Receptor
TMZ Temozolomide
TNF Tumor necrosis factor
TP53 Tumor protein p53
XII TRAM TRIF-related adaptor molecule
TRIF TIR-domain-containing adapter-inducing interferon-β VEGF Vascular endothelial growth factor
WB Western Blot
WHO World Health Organization
Introduction
1
1. Introduction
1.1 Glioma
Gliomas are brain tumors originated from glial cells1, which are non-neuronal cells whose main functions are myelin formation, support and maintenance of neurons. Glial cells can be grouped in microglia and macroglia2.
Microglia are specialized macrophages derived from hematopoietic precursors localized on the brain. They originate from the ectodermal layer and have a large and star-like morphology. Their principal function is to phagocytose damaged neurons and glial cells.
Macroglia are subdivided into three principle types, namely astrocytes, oligodendrocytes and ependymal cells. Each of them has special functions:
• Astrocytes: the provision of nutrients, oxygen, and mechanical support; the development guidance, waste disposal and immune functions.
• Oligodendrocytes: the production of myelin sheath, a modified plasma membrane surrounding the nerve axon, enhancing the efficiency of electrical signal propagation.
• Ependymal cells: create and secrete cerebrospinal fluid (CSF) and assist in their circulation through the brain ventricles and the spinal cord 3.
Glial cells divide and multiply by asymmetric cell division. When the control of this ability is lost, the formation of gliomas takes place. Astrocytomas are tumors derived from astrocytes and constitute 75% of all gliomas4. Other less common types of gliomas are oligodendroglioma (9%) and ependymoma (6%), which originate from oligodendrocytes and ependymal cells, respectively 5,6. Tumors derived from mixed cell types constitute the remaining cases. Traditionally, astrocytomas have been subdivided depending on their malignancy grade. An established histological grading created by the World Health Organization (WHO) assigned grades from I to IV, with I being the least aggressive and IV being the most aggressive5.
The updated classification of the WHO is based on morphology, molecular and genetical factors of astrocytomas. Two of the principal changes on the updated WHO classification is the incorporation of Isocytrate Dehydrogenase (IDH) mutations, and a characteristic
2
translocation of the p arm of chromosome 1 with the arm of chromosome 19 (1p/19q codeletion) as important factors for the subdivision of gliomas 7,8.
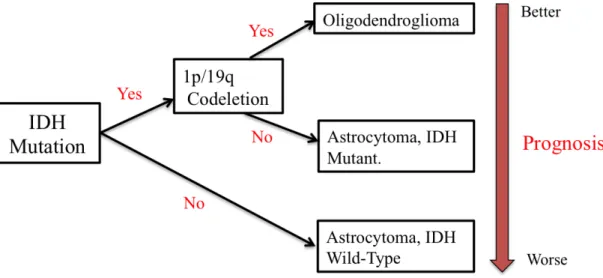
Astrocytomas with IDH mutations show no 1p/19q codeletion, whereas oligodendriogliomas carries both IDH mutation and 1p/19q codeletion. Astrocytomas with no IDH mutation (IDH wild-type) show a worse prognosis in comparision with astrocytomas with IDH mutations (Figure 1.1)7,8.
Figure 1.1 Astrocytoma classification in the updated 2016 Central Nervous System WHO classification (adapted from Johnson et al., 2016)8.
1.2 Glioblastomas
The highest-grade astrocytoma, the glioblastoma multiforme (GBM, astrocytoma WHO grade IV) is the most common and most aggressive nervous system tumor. It can be divided in primary and secondary GBM. The “primary” (de novo) GBMs are common and display no signs of a preceding low-grade tumor. They develop predominantly in elderly patients 5,9. In contrast, secondary GBMs develop in younger patients through progression from lower-grade diffuse astrocytoma (WHO grade II) or anaplastic astrocytoma (WHO grade III)5,10.
The current treatment for GBM patients consists of surgery, radiotherapy and chemotherapy. Complete surgical resection is practically impossible. Radiotherapy in combination with the adjuvant temozolomide (TMZ) represents the standard treatment for newly diagnosed GBM and the overall survival after 5 years of diagnosis is less than 5%
6,11.
Introduction
3
1.2.1 Molecular basis for the development of GBMs
Genetic alterations are commonly assumed to be the basis of tumor development. These mutational events trigger the activation of genes related to tumor formation (oncogenes) or the silencing of tumor suppressor genes9. Several mutations, for example TP53, PDGFRA, EGFR, and NF1, have been described in the context of GBM development 12. Depending of the subtype of GBM, the presence of IDH1 mutations varies. IDH1 mutations are more frequent (80%) in secondary GBMs, progressed from anaplastic astrocytomas, whereas in primary GBMs the incidence of this mutation is only 5%
13,1415,16. The small fraction of primary GBMs with IDH1 mutations is only found in younger patients 13,17.
Interestingly, a rare fraction of secondary GBMs lacks IDH1 mutations. These GBMs have progressed from grade III glioma, while the majority of secondary GBMs, that exhibit IDH1 mutations, have developed from grade II gliomas15.
Remarkably, IDH mutations do not result in a complete loss of function as only one IDH1 gene copy is altered. This specific mutation leads to a single amino acid exchange, namely arginine 132 to histidine, in the IDH1 active site 18.
The updated WHO classification, incorporate the traditional “primary” and “secondary”
glioblastomas classification into two new subtypes based on the presence of IDH mutations 7.
Table 1.1 Glioblastoma classification based on the presences of IDH mutation 8. Glioblastoma, IDH Mutant Glioblastoma, IDH Wild-type
10 % of GBMs 90% of GBMs
Younger median age Older median age
Good Prognosis Poor Prognosis
Secondary GBMs Primary GBMs
4
1.3 Glioblastoma and metabolism
Several imaging studies used in brain tumor diagnosis have their basis in the metabolic activity of tumor cells.
Positron emission tomography (PET) is an imaging technology that is able to detect and characterize tumors based on their molecular and biochemical properties, as it is the case of glucose uptake, nucleoside or amino acid metabolism. During a PET scan a small amount of e.g. radioactive glucose is injected, which is uptaken by the tumor cells depending on malignancy19,20. Studies with fluoro-2-deoxyglucose (18F-FDG) have demonstrated differences in 18F-FDG uptaking between brain tumor subtypes, being higher in GBM than in meningioma or surrounding gray matter 21,22.
Analogical, studies with amino acid tracers focus principally on 11C-methionine 23 and the thymidine analog 3´-18F-fluorothymidine (18F-FLT) to track the proliferation of brain tumors in vivo 24. Amino acid imaging is based on the observation that amino acid transport is generally increased in cells undergoing malignant transformation 25.
1.3.1 Warburg Effect
Otto Warburg observed that cancer cells present an altered glucose metabolism compared with non-cancerous cells26. Warburg demonstrated that cancer cells displayed an increase in their glycolytic activity, taking up glucose and producing higher levels of lactic acid even in the presence of sufficient levels of oxygen, which would allow energy production via oxidative phosphorylation (OXPHOS)27.
Glycolysis is a sequence of chemical reactions where one molecule of glucose is converted into two molecules of pyruvate; these reactions occur in the cytosol of the cell.
The overall energy release from this process is two ATP and two NADH molecules per molecule of glucose 28. Pyruvate is further metabolized into acetyl-CoA, which enters the mitochondrial matrix where the tricarboxic acid cycle (TCA) takes place. In contrast, in cancer cells high amounts of glucose are taken up and metabolized to pyruvate, but instead of entering into the TCA, most of the pyruvate is converted to lactate, which later is secreted from the cell 29. It has been reported that “aerobic” glycolysis supports tumor growth and proliferation due to fast generation of ATP and biomolecules 30,31.
Introduction
5
Warburg considered that the functions of mitochondria were impaired in cancer cells;
nevertheless several studies observed that in many cancer types, mitochondrial oxidative phosphorylation is intact 32–35.
The Warburg effect has been associated with several oncogenic factors, which include HIF-1, MYC, GTP-binding proteins, RAS, tyrosine kinase pathway, p53 and IDH mutations 30,36.
1.3.2. Isocitrate dehydrogenase (IDH) and tumor cell metabolism
IDH is an important enzyme of the TCA. Three isozymes of IDH are known in humans:
IDH1, IDH2 and IDH3. These isozymes are encoded by five genes: IDH1, IDH2, IDH3A, IDH3B and IDH3G37. All isozymes are metabolic enzymes that catalyze the interconversion of isocitrate into alpha-ketoglutarate (α-KG). IDH1 is located in the cell cytoplasm and peroxisomes, whereas IDH2 and IDH3 are found in the mitochondrial matrix37.
α-KG is a ketone, which can be generated via glutaric acid from glutamine, and is involved in nitrogen transportation, oxidation reactions, and amino acid formation37. Mutated IDH gains the new ability to convert α-KG into D-2-hydroxyglutarate (D-HG)
38,39. IDH mutations have not only been described in glioblastoma but also in other tumor entities such as acute myeloid leukemia 40. D-HG can be detected in culture supernatants of mutant cells and acute myeloid leukemia patient sera41. It has been reported that the serum HG levels did not differ between IDH1/2 allelic variants. In addition to this, high HG levels were also detected in some patients without IDH mutations in acute myeloid leukemia and thyroid carcinoma41. Importantly, high concentrations of HG predicted shorter overall survival in patients with acute myeloid leukemia 42. In contrast, patients with malignant gliomas and anaplastic astrocytomas that harbor IDH mutations show improved survival in comparison with patients whose tumors lack these mutations 43,44. The presence of HG in cell lines that lack IDH mutations raises the question what mechanism leads to HG production in these cells. In conditions of hypoxia, mitochondrial glutamate levels are high, favoring the reverse TCA reaction, a process replenished through glutaminolysis. In this case glutamine is converted into glutamate, which subsequently is metabolized into α-KG by glutamate dehydrogenase (GDH). Then IDH converts α-KG into isocitrate using NADP+ as an electron acceptor leading to the production of NADPH. Isocitrate is further metabolized to acetyl-CoA for lipid
6
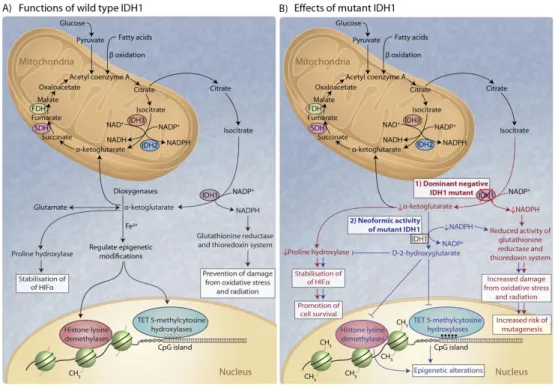
metabolism 45. This inverse catalytic reaction by IDH has been reported in a SF188 glioblastoma cell line under hypoxic conditions, along with an increase in HG levels46. In line with these results, high levels of cellular HG have been reported to drive the hydroxylation of HIF-1α, leading to decreased HIF expression and increased glioma transformation. Additionally, HG has been reported to competitively inhibit α-KG binding to several histone demethylases, including JmjC-domain-containing histone demethylase proteins (JHDM) leading to a widely aberrant histone methylation profile. Furthermore, HG is an inhibitor of hydroxymethylases TET methylcytosine dioxygenases (TET) 1 and 2, enzymes that catalyze the conversion of methylcytosine to 5-hydroxymethylcytosine, inducing DNA demethylation. The epigenetic dysregulation caused by altered levels of HG and α-KG in IDH1 and IDH2 mutant cells may contribute to aberrant regulation of gene expression in cancer47 (See Figure 1.2).
Figure 1.2. The role of IDH in metabolism of gliomas. The figure shows schematically that mutated IDH1 enzyme gains the ability to produce HG from α-ketoglutarate; this could lead to HIF stabilization through impairment of PHD activity. The stabilization of HIF promotes cell survival. In addition, the buildup of HG in IDH1- and IDH2-mutated cells has been linked to epigenetic changes through the inhibition of TET and JHDMs 48. Abbreviations: isocitrate dehydrogenase (IDH), hypoxia inducible factor (HIF), formate dehydrogenase (FDH), ten-eleven translocation (TET), prolyl hydroxylase domain (PHD), succinate dehydrogenase (SDH). Adapted from Gupta et al., 201148.
Introduction
7
1.4 The role of tumor stroma in malignant gliomas
T cells have been reported to infiltrate gliomas, and could be linked with an survival improval in patients with malignant gliomas 49,50. Genome microarray analysis supported the theory that host immunity can control tumor growth of high-grade gliomas. T cell- associated genes were shown to be enriched in high-grade astrocytoma from long-term versus short-term survivors51.
High intratumoral numbers of CD4+ and CD8+ T cells have been related with prolonged survival in other tumor entities. In melanoma, CD4+ T cells has been proved to control tumor invasion and metastasis 52, whereas in hepatic metastases of colorectal cancer high intra-tumoral CD8+ T cell infiltration predict better response to chemotherapy and prolonged survival 53. Interestingly, in renal cell carcinoma as well as in head and neck cancers T cell infiltration seems to be controlled by the metabolic phenotype of the tumor, as an accelerated glucose metabolism was shown to be associated with a low CD8 effector T cell infiltration 54.
Fibroblasts are an heterogenous population of stromal cells, with multiple functionalities, as wound-healing regulation, immune modulators production (growth factors, cytokines, chemokines) and play an important role in chronic inflammation 55. Numerous reports have identified stromal fibroblasts as important players in the induction of angiogenesis and metastasis in brain tumors 56,57, and tumor-associated macrophages are involved in fibroblast recruitment 58,59. The interaction of these stromal cells with brain tumor cells induced the production and activation of matrix metalloproteinase leading to glioma progression 60–64. Microglia cells/ macrophages play also an important role in the production of cytokines, particularly IL-10 65. The expression levels of IL-10 can significantly be related with tumor cell proliferation, migration and the promotion of metastasis in gliomas 66,67. The expression of proinflammatory cytokines in glioblastomas is associated with typical immune signaling cascades as is the case of p38 MAPK; an inhibition on p38 MAPK cascade results in the incapacity of glioma cells to metastasize 68.
1.5 Immune biology
The immune system is a complex interactive network of cells, humoral factors and cytokines. The principal function is the host’s protection from harmful environmental agents 69.
8
The immune response is divided into two types of responses, determined by the speed and specificity of the reaction. These responses are innate and adaptive immunity 70.
1.5.1 Innate Immunity
The innate immunity is the faster reaction against infectious agents. The main components of this type of response are: 1) physical, chemical, and microbiological barriers, 2) phagocytes (neutrophils, monocytes, macrophages and dendritic cells (DCs)), 3) acute phase proteins, 4) complement factors, and 5) natural killer cells 69,70.
This type of immunity occurs in the same magnitude all the time regardless of repeated encounters with the infectious agent 71.
The primary function of mononuclear phagocytes, like monocytes, macrophages and DCs, is phagocytosis. Phagocytosis is defined as the engulfment of antigens, a process in which a remodelling of actin is necessary, leading to the formation of the so-called phagosome.
Phagocytic macrophages manage the defense against bacteria via surface receptors, which are able to recognize and bind several components of bacterial surfaces. The binding of bacterial molecules to the surface receptors of phagocytic macrophages induces the absorption of the bacterium and the secretion of biological active molecules, such as cytokines. This leads to a cell to-cell communication during the immune responses and promotes the migration of cells towards sites of inflammation, infection and trauma 72–74. In the central nervous system, monocyte-derived macrophages are called microglial cells
70. Several studies investigated monocytes as an important component of the glioblastoma microenvironment. GBM cells attract circulating monocytes to the tumor parenchyma, where these monocytes adopt immunosuppressive properties 75–78.
1.5.2 Adaptive Immunity
The adaptive immunity is composed of different types of lymphocytes, namely B cells and T cells, which are capable of reacting highly specific to foreign antigens. In addition, the adaptive immunity is able to “remember” infectious agents due to the induction of so- called “memory” cells. This leads to a faster response upon secondary exposure of the infectious agent 70.
B cells are capable of producing antibodies. They recognize extracellular antigens and differentiate into antibody-secreting plasma cells. T lymphocytes recognize antigens presented on MHC molecules via their specific T cell receptor (TCR). There are different types of T lymphocytes: CD4+ helper T cells, CD8+ cytotoxic T cells (CTLs) and
Introduction
9
regulatory T cells. The CD4+ helper T cells secrete cytokines in response to an antigenic stimulation and thereby activate macrophages, DCs or other T cells. Cytotoxic CD8+ T cells are responsible for the killing of virus-infected cells and can also destroy tumor cells.
In contrast, regulatory T cells represent “the brake” of the immune system and can inhibit activated CD4+ T cells 70, CD8+ T cells and B cells, thereby limiting the immune response
79.
1.5.3 Antigen Presenting Cells (APCs)
Antigen presenting cells (APCs) are a heterogeneous group of immune cells that mediate the cellular immune response by taking up, processing and presenting antigens to T lymphocytes. The principal APCs in the immune system are dendritic cells (DCs), macrophages, and B cells.
APCs capture infectious antigens through several mechanisms:
• receptor-mediated endocytosis
• pinocytosis
• phagocytosis
As previously mentioned, phagocytosis is based in the remodelling of actin and the formation of a phagosome. Recent studies have shown that phagosome maturation is regulated by signals originating from pattern recognition receptors discriminating between self and non-self antigens 80.
1.5.3.1 Dendritic cells
Dendritic cells (DCs) are the most potent APCs of the immune system and act as link between innate and adaptive immunity 81. To become potent T cell stimulators, DCs have to mature. This process is accompanied by functional and phenotypic changes.
DCs are competent inducers of B and T cell responses 82,83. TCRs recognize peptides attached to molecules of the major histocompatibility complex (MHC) on the surface of APCs. There are two types of MHC: MHC class I and MHC class II, which stimulate CTLs and helper T cells, respectively 82.
DCs capture and process antigens, and display large amounts of MHC-peptide complexes at their surface. In contrast, the amounts of antigen-MHC complexes and costimulatory molecules on tumours are often small.
10
Immature DCs (iDCs) are unable to stimulate T cells due to the absence of costimulatory signals such as CD40, CD54 and CD86 that are needed for proper T cell activation.
Nevertheless, iDCs are able of capturing and processing antigens to form MHC peptide complexes. iDCs show large amounts of MHC class II-rich compartments (MIICs), which are endosomal structures, that include HLA-DM or H-2M, which enhance and rearrange peptide binding to MHC class II molecules83–87.
iDCs reside in peripheral tissues until they are exposed to inflammatory stimuli and take up antigen. After being stimulated, iDCs migrate to the peripheral lymph nodes where they mature and express additional molecules that induce T cell stimulation 83. Mature DCs (mDCs) produce high levels of IL-12 88–90, a cytokine that enhances both innate and adaptive immunity. During the maturation process the expression of co-stimulatory molecules such as CD83, CD80 and CD86 is upregulated 91. Maturation can be influenced by diverse factors: bacteria, microbial cell wall components like lipopolysaccharide (LPS)84, and cytokines like IL-1, GM-CSF, and TNF-α. In contrast, IL-10 inhibits the maturation process 92.
To generate anti-tumoral immune responses, APCs have to present peptides bound to MHC molecules. Mature and functional active DCs seem to be absent in many tumour types, resulting in a failure in the generation of a tumor-specific T cell response; a possible underlying mechanism is the accumulation of immunosuppressive factors such as IL-10, TGF-ß and vascular endothelial growth factor in the tumor environment, that reduce DC development and function 83,93.
1.5.4 Cytokines
Cytokines are a group of proteins involved in the regulation of the innate and adaptive immunity. Their synthesis is induced by cellular activation, differentiation and proliferation signals of immune cells 70.
Mononuclear phagocytes are mainly stimulated by bacterial compounds and secrete inflammatory cytokines like tumor necrosis factor alpha (TNF-α), IL-6 and IL-1. As a feedback regulation mononuclear phagocytes can also produce anti-inflammatory cytokines like IL-10, which suppress the immune response; for example the production of TNF-α is inhibited by IL-10 94.
IL-6 is secreted by macrophages and T cells and is able to cross the blood brain barrier 95. It mediates pro-inflammatory and anti-inflammatory responses 96.
Introduction
11
After stimulation, DCs produce IL-12. IL-12 is a prerequisite for the initiation of a CD4+ T helper 1 (TH1) response, which consequently activates CTLs. IL-10 counteracts the effects of IL-12 70. A reduction in the production of IL-12 and IFN-γ has been related with the inhibition of tumor- infiltrating T cells in ovarian cancer 97.
1.5.4.1 IL-12 regulations
iDCs become activated through the stimulation of their pattern-recognition receptors (PRRs). In this context, toll like receptors (TLR) play a crucial role in the activation of DCs. Ten functional TLRs have been identified in humans 98. Each TLR detects specific molecular structures of pathogens as their ligand (pathogen-associated molecular patterns (PAMPs)) 72. After the ligand binds to its typical TLR, pro-inflammatory activities take place 99. All TLRs but TLR3, bind to the adaptor protein myeloid differentiation primary- response protein (MyD88) 100.
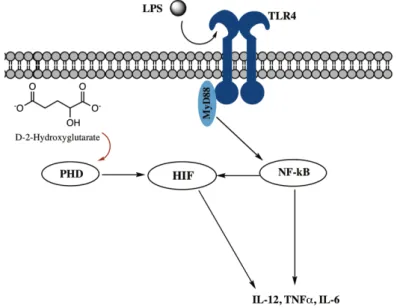
TLR4 is localized on the cell surface and is generally stimulated by LPS, the cell wall component of Gram-negative bacteria. In the serum, LPS is connected to LPS-binding Protein (LBP) which interacts with a receptor complex of TLR4, CD14 and associated proteins 101. After stimulation, signalling cascades (see figure 1.3), mediated by TLR4, modulate gene expression and subsequently the production of several pro-inflammatory cytokines such as IL-6, TNF-α and IL-12. IL-12 production is modulated mainly under 3 different pathways, each one with their own kinetics.
Pathway 1 “Canonical Pathway”
This pathway consists in a series of phosphorylations of IκB proteins by a multiple IκB kinases complex (IKK complex), which consists of two catalytic components (IKKα and IKKβ) and a regulatory component (IKKγ)102. After the phosphorylation of IκB proteins, IκB is degradated through an ubiquitin system by the 26S proteasome. The free unbound Nuclear Factor κB (NF-κB) can then translocate to the nucleus and activate the transcription of specific target genes 103 .
Pathway 2 “PI3K induced-signalling pathway”
IL-12 production has been also linked to mitogen-activated protein (MAP) kinases pathway. Three subgroups of MAP kinases have been identified: extracellular signaling regulated kinases ERKs, c-Jun N-terminal kinase (JNK) and the p38 MAPK 104. After stimulation of TLR4 by LPS, phosphoinositide-3 kinases (PI3Ks) pathway is activated
12
leading to a downstream phosphorylation of serine/threonine kinase Akt and extracellular signal-regulated protein kinases 1/2 (ERK1/2) 105. Akt activation modulates the activation of p38 MAPK and JNK. The production of IL-12 is regulated by PI3K in a negatively manner while p38 MAPK and JNK are positively regulated 106.
Pathway 3 “G proteins and cAMP”
Heterotrimeric G proteins participate in the activation of MAPK and Akt signaling pathways. G i/o-mediated activation of the MAPK is independent of the canonical signaling cascade. Heterotrimeric G proteins inhibit adenylate cyclase activity and the cAMP accumulation in human monocytes. High cAMP levels are able to hamper IL-12 production. It has been reported that Gαi-protein suppresses IL-12 production via Akt signaling (JNK, and ERK 1/2 pathway, but not p38) independently of PI3 kinase (see figure 1.3) 107,108.
Figure 1.3 LPS-stimulated pathways associated with IL-12 regulation. LPS stimulates the TLR4-mediated activation of the NFĸB-pathway and thereby the production of TNF-α, IL-6 and IL-12p40. Gαi-mediated inhibition of adenylate cyclase and cAMP accumulation, Gβγ-mediated activation of Akt pathway but not p38. Adapted from Hildebrand et al.,109.
Aim
13
1.6 Aim
During my Masters thesis we found that IL-12 production was strongly decreased in dendritic cells after incubation with D-HG whereas IL-10 production was increased. As these two cytokines are important players in the regulation of an anti-tumour response, D- HG could be involved in the immunosuppression in the tumour environment.
The aim of this thesis was to further characterize the effects of HG on immune cells and tumor cells (differentiation, effects on metabolism) and to evaluate possible mechanisms which are involved in the suppression of IL-12 production in dendritic cells (regulation of transcription factors and signalling pathways).
14
2. Material
2.1 Equipment
2.1.1 Cell Culture
Equipment Company
AMG Microscope Evos xl Fischer Scientific, Darmstadt Germany CASY Cell Counter and Analyzer System
Model TT
Roche Innovatis AG, Reutlingen Germany
Centrifuge Biofuge fresco Heraeus, Osterode, Germany Centrifuge Megafuge 3,0 R Heraeus, Osterode, Germany
Hemocytometer Marienfeld, Lauda-Königshofen, Germany
Incubator BBD 6220 Heraeus, Osterode, Germany
Laminar Flow Air HA 2472 Heraeus, Osterode, Germany
pH-Meter Hanna Instruments, Kehl am Rhein,Germany
Vortex Scientific Industries, New York, USA
Wellwash™ Microplate Washer Thermo Electron Corporation, Darmstadt Germany
2.1.2 Elutration
Equipment Company
Centrifuge Avanti J-20XP; Rotor JE 5.0 Beckmann, München, Germany Elutriator Avanti J-20XP Beckmann Coulter, Krefeld, Germany
Waterbath Julabo, Seelstadt, Germany
Material
15
2.1.3 Lysate, Isolation and PCR
Equipment Company
Heat sealer Eppendorf, Hamburg, Germany
Multipipette Multipette plus Eppendorf, Hamburg, Germany Multipipettor Multipette plus Eppendorf, Hamburg, Germany
NanoDrop ND1000 Thermo Fisher Scientific, Schwerte, Germany PCR-Thermocycler Modell PTC-200 MJ-Research/Biometra, Göttingen, Germany Realplex Mastercycler epGradient S Eppendorf, Hamburg, Germany
Rotilabo® mini centrifuge Carl Roth, Karlsruhe, Germany Welding machine for PCR plates Fermant
400 Josten & Kettenbaum, Bensberg, Germany
2.1.4 Western Blot
Equipment Company
Electrophoresis Device Biometra,Göttingen, Germany
Forceps Aesculap, Tuttlingen, Germany
ImageQuant LAS4000 GE Healthcare, Freiburg, Germany
Pipetboy Integra Biosciences, Fernwald, Germany
Power supplies Biometra, Göttingen, Germany
Pulsed field electrophoresis GE Healthcare, Chalfont St Giles, UK Pulsed field gel electrophoresis equipment Biostep, Jahnsdorf, Germany
Test tube shaker IKA® Sigma-Aldrich, St. Louis, MO, USA
Thermomixer Eppendorf, Hamburg, Germany
Water purification system Millipore, Eschborn, Germany
Western-Blot-camera Biometra, Göttingen, Germany
16
2.1.5 Flow Cytometry
Equipment Company
FACS Calibur flow cytometer BD Biosciences, Franklin Lakes, NJ, USA
2.1.6 Respirometry
Equipment Company
Gastight 1700 Syringes (10,25,50µl) Hamilton, Bonaduz, Switzerland Hot-Air Disinfectable Gassed Incubator BBD
6220
Termo Fisher, Langenselbold, Germany
OxoDish® PreSens, Regensburg, Germany
Oxygraph-2k Oroborus Instruments, Innsbruck, Austria
SDR SensorDish® Reader PreSens, Regensburg, Germany
2.2 Consumables
2.2.1 Cell Culture
Material Company
Cell Culture Flask Costar, Cambridge, USA
Cell culture plates BD, Franklin Lakes, NJ, USA
Cryo tubes Corning, Corning, NY, USA
Microtiter plates (6, 12, 96 wells) Falcon, Heidelberg, Germany
Pipette Tips Eppendorf, Hamburg, Germany
Pipettes (2, 5, 10, 25, 50ml) Costar, Cambridge, USA
Plate for ELISA Costar, Cambridge, USA
Polystyrene test tubes Falcon, Heidelberg, Germany Polystyrene test tubes with cell strainer cap Corning, Corning, NY, USA
Sterile Filter Millipore, Eschborn, Germany
Material
17
2.2.2 Lysate, Isolation and PCR
Material Company
Cell scrapers Sarstedt, Nümbrecht, Germany
Cell strainer (70µm, 100µm) Falcon, Heidelberg, Germany Combitips for Eppendorf multipette Eppendorf, Hamburg, Germany
Heat sealing film Eppendorf, Hamburg, Germany
Micro test tubes (0.5ml, 1.5ml, 2ml) Eppendorf, Hamburg, Germany
Micropore filters Sartorius, Göttingen, Germany
PCR plate Twin.tec 96 well Eppendorf, Hamburg, Germany Syringe Filters, sterile Sartorius, Göttingen, Germany
Syringes and needles Becton Dickinson, Heidelberg, Germany Twin Technology PCR plates (96 wells) Eppendorf, Hamburg, Germany
2.2.3 Western Blot
Material Company
Filter paper 3MM Whatman, Dassel, Germany
Fotofilm HyperfilmTM ECL Amersham, Braunschweig, Germany HyperfilmTM ECL GE Healthcare, Chalfont St Giles, UK Immobilon-P PVDF membrane Millipore, Schwalbach, Germany
2.3 Reagents
2.3.1 Cell Culture
Reagent Company
Bovine serum albumine Sigma-Aldrich, St. Louis, MO, USA
CasyTON Roche, Basel, Switzerland
Dimethyl Sulfoxide (DMSO) Sigma-Aldrich, SHDB7695v, St. Louis, MO, USA
Dulbecco´s Modified Eagle Medium (DMEM) High Glucose
GIBCO, 21969-035 Paisley, UK Dulbecco´s Modified Eagle Medium (DMEM) Low
Glucose
GIBCO, 31885 023, Paisley, UK
Fetal Calf Serum, FCS PAA, A11102, Freiburg, Germany
Granulocyte-macrophage colony-stimulating factor, GM-CSF
Peprotech, 300 03, Hamburg, Germany
Interleukin- 4 (IL-4) Peprotech, 200 04, Hamburg, Germany
L-Alanyl-L-Glutamine Biochrom, K0302, Berlin, Germany
Lipopolysaccharides, LPS ENZO, ALX-581-009, Lörrach,