IDH mutations as immune target and their effect on dendritic cell differentiation and metabolism
Dissertation
zur Erlangung des Doktorgrades der Biomedizinischen Wissenschaften
(Dr. rer. physiol.)
der
Fakultät für Medizin der Universität Regensburg
vorgelegt von Kathrin Hammon
aus
Freiburg im Breisgau
im Jahr 2018
Dekan: Prof. Dr. Dr. Torsten E. Reichert
Betreuer: Prof. Dr. Wolfgang Herr
Tag der mündlichen Prüfung: Noch nicht bekannt
SELBSTÄNDIGKEITSERKLÄRUNG
“Ich, Hammon. Kathrin geboren am 12.04.1989 in Freiburg im Breisgau, erkläre hiermit, dass ich die vorliegende Arbeit ohne unzulässige Hilfe Dritter und ohne Benutzung anderer als der angegebenen Hilfsmittel angefertigt habe.
Die aus anderen Quellen direkt oder indirekt übernommenen Daten und Konzepte sind unter Angabe der Quelle gekennzeichnet. Insbesondere habe ich nicht die entgeltliche Hilfe von Vermittlungs- bzw. Beratungsdiensten (Promotionsberater oder andere Personen) in Anspruch genommen.
Die Arbeit wurde bisher weder im In- noch im Ausland in gleicher oder ähnlicher Form einer anderen Prüfungsbehörde vorgelegt.
Ort, Datum eigenhändige Unterschrift des Promovenden
Die vorliegende Arbeit entstand im Zeitraum von September 2014 bis September 2018 an der Klinik und Poliklinik für Innere Medizin III des Universitätsklinikums Regensburg.
The present work was carried out from September 2014 to September 2018 at the Department of Internal Medicine III at the University Hospital Regensburg.
“Science never solves a problem without creating ten more.”
George Bernard Shaw
I
Table of content
SELBSTÄNDIGKEITSERKLÄRUNG ...
List of Figures ... VI List of Tables ... VIII List of Abbreviations ... IX
1 Introduction ... 1
1.1 Acute Myeloid Leukemia ... 1
1.1.1 Mutations in AML ... 1
IDH mutation ... 2
1.1.1.1 1.1.1.1.1 Prognosis in AML patients with IDH mutation ... 3
Production of 2-hydroxyglutarate ... 3
1.1.1.2 Effects of 2-hydroxyglutarate ... 4
1.1.1.3 1.2 Epigenetic ... 5
1.2.1 DNA Methylation ... 5
1.3 Immunological background ... 5
1.3.1 T cells ... 5
1.3.2 Antigen presenting cells ... 6
Dendritic cells ... 7
1.3.2.1 HLA class II molecules ... 7
1.3.2.2 1.4 Cellular therapy as cancer treatment ... 8
1.4.1 Target antigen for cellular therapy ... 9
1.5 Metabolites interfere with immune cells ... 10
1.5.1 Glucose metabolism ... 10
1.5.2 Citric acid cycle ... 10
1.5.3 Oxidative phosphorylation... 11
1.5.4 Metabolism of dendritic cells ... 12
1.5.5 Oxidative stress ... 13
Production of reactive oxygen species ... 13
1.5.5.1 1.5.5.1.1 Role of ROS in DCs ... 13
1.6 Project aims ... 14
2 Material and Methods ... 15
2.1 Material ... 15
2.1.1 Equipment and consumables ... 15
2.1.2 Chemicals ... 16
2.1.3 Fluorescence probes and antibodies ... 17
2.1.4 Cell culture material ... 18
2.1.5 Kits ... 19
2.1.6 Software ... 20
2.2 Methods ... 21
2.2.1 IDH2Mut specific stimulation of T cells ... 21
In silico Peptide prediction ... 21
2.2.1.1 2.2.1.1.1 SYFPEITHI ... 21
2.2.1.1.2 BIMAS ... 21
II
2.2.1.1.3 NetMHCPan ... 21
2.2.1.1.4 IDH2 R140Q specific Peptides ... 21
Preparation of IDH mRNA ... 22
2.2.1.2 2.2.1.2.1 Digestion ... 22
2.2.1.2.2 Agarose gel ... 22
2.2.1.2.3 PCR Purification with High pure PCR product purification kit ... 23
2.2.1.2.4 Dephosphorylation of phosphates on the ends of the linearized vector... 23
2.2.1.2.5 Ligation of insert in the vector ... 23
2.2.1.2.6 Transformation of Plasmid DNA ... 24
2.2.1.2.7 Plasmid isolation out of bacteria ... 24
2.2.1.2.8 Concentration measurement with nano drop ... 25
2.2.1.2.9 Sequencing of inserts ... 25
2.2.1.2.10 Mutagenese Quickchange ... 25
2.2.1.2.11 Linearization of vector ... 27
2.2.1.2.12 Phenol-Chlorophorm extraction ... 27
2.2.1.2.13 In-vitro transcription and purification of mRNA ... 28
2.2.1.2.14 RNA gel ... 28
General cell culture ... 29
2.2.1.3 2.2.1.3.1 Counting of cells ... 29
2.2.1.3.2 Thawing of cells ... 29
2.2.1.3.3 Freezing of cells... 29
Isolate Peripheral blood mononuclear cell from blood samples of healthy donors 29 2.2.1.4 2.2.1.4.1 Pancoll separation ... 30
2.2.1.4.2 Isolation of CD8 positive cells from PBMCs by Magnetic-activated cell separation (MACS) ... 30
2.2.1.4.3 Isolation of CD4 and CD8 positive cells from PBMCs ... 31
2.2.1.4.4 Isolation of CD45RA positive cells from PBMCs ... 31
2.2.1.4.5 Fluorescent associated cell sorting ... 31
Generating of mature FAST-DC for T cell stimulation ... 32
2.2.1.5 2.2.1.5.1 Transfection of in vitro transcribed mRNA and T cell stimulation with DCs expressing IDH2 R140Q ... 32
T cell stimulation with Peptide loaded APCs ... 33
2.2.1.6 Measurement of IFNγ secretion by ELISpot ... 33
2.2.1.7 2.2.2 Analyzing effect of D-2-HG on monocyte maturation and differentiation to DCs ... 34
Isolation of monocytes by elutriation ... 34
2.2.2.1 Generation of monocyte-derived DCs ... 34
2.2.2.2 Electron microscopic analyses of DCs treated with D-2-HG ... 35
2.2.2.3 Phagocytosis Assay ... 35
2.2.2.4 Allogeneic mixed lymphocyte reaction ... 36
2.2.2.5 Enzyme-linked immunosorbent assay (ELISA) ... 36
2.2.2.6 Measurement of cAMP level by ELISA ... 37
2.2.2.7 Flow cytometric analyses ... 37
2.2.2.8 2.2.2.8.1 Staining of surface molecules ... 37
2.2.2.8.2 Intracellular staining ... 37
2.2.2.8.3 Measurement of cytosolic ROS with 2′,7′-Dichlorofluorescin diacetate ... 38
2.2.2.8.4 Cystine staining ... 38
2.2.2.8.5 Measurement of mitochondrial ROS with MitoSox red ... 38
2.2.2.8.6 Staining of mitochondria with Mitotracker Green ... 39
Determining mitochondrial respiration by high-resolution respirometry ... 39
2.2.2.9 2.2.2.9.1 Oxygen measurement in whole cells ... 39
2.2.2.9.2 Oxygen measurement in permeabilized cells ... 40
Analyze of pH value and oxygen concentration of DCs ... 41
2.2.2.10 Lactate and glucose determination ... 42
2.2.2.11 Methylation analysis ... 42
2.2.2.12 2.2.2.12.1 Culture and treatment of DCs for methylation analysis ... 42
III
2.2.2.12.2 Isolation of DNA with DNeasy Blood and tissue ... 42
Protein isolation ... 43
2.2.2.13 Fractionized protein isolation ... 43
2.2.2.14 Protein determination by Lowry ... 44
2.2.2.15 Analyzing protein of interest by western blot ... 44
2.2.2.16 2.2.2.16.1 SDS gel electrophoresis... 44
2.2.2.16.2 Western blot ... 45
2.2.2.16.3 Protein transfer on membrane ... 45
2.2.2.16.4 Detection of protein of interest ... 46
2.2.2.16.5 Elimination of antibodies bound on membrane... 46
3 Results ... 47
3.1 Generation of IDH 2 R140Q specific T cell ... 47
3.1.1 HLA binding prediction by in silico programs ... 47
3.1.2 T cell stimulation with peptide loaded antigen presenting cells ... 48
T cell stimulation with peptide loaded PBMC ... 48
3.1.2.1 T cell stimulation with peptide loaded DCs ... 49
3.1.2.2 3.1.2.2.1 Stimulation with peptide pools in 96-well format ... 50
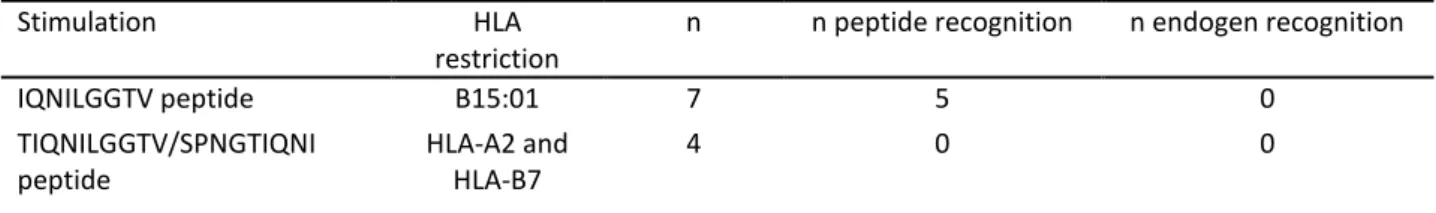
Summary of stimulation with peptide loaded antigen presenting cells ... 51
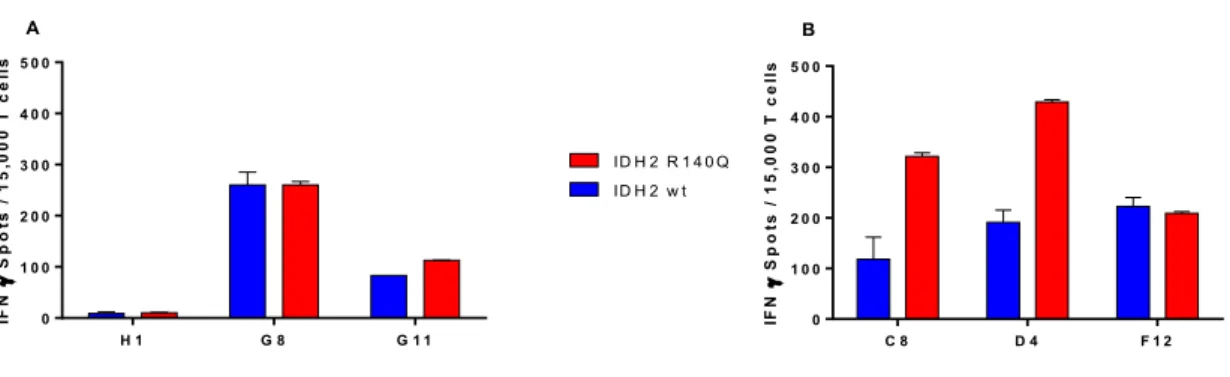
3.1.2.3 3.1.3 T cell stimulation with electroporated DC ... 52
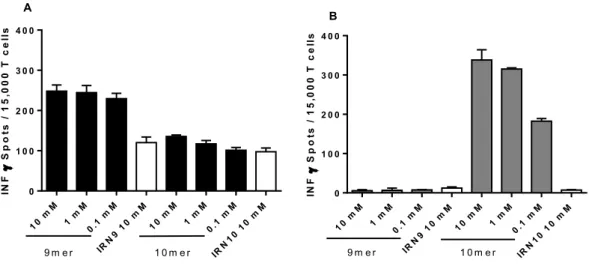
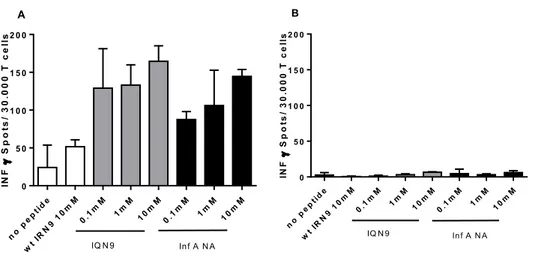
3.1.4 Stimulation of T cells with Influenza peptide ... 53
3.2 Effect of D-2-HG on metabolism and differentiation of monocyte-derived dendritic cells ... 55
3.2.1 Uptake of D-2-HG in monocytes ... 55
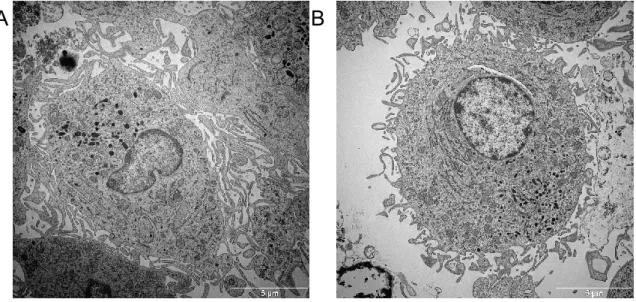
3.2.2 Changes of DC morphology upon D-2-HG treatment ... 56
3.2.2.1.1 Dendritic cell structures analyzed by electron microscopy ... 57
3.2.2.1.2 Vesicle structure of D-2-HG treated DCs analyzed by electron microscopy ... 58
Expression analyze of late endosome marker Rab9 by western blot ... 60
3.2.2.2 Expression analyze of the autophagy marker LC-3B by western blot ... 61
3.2.2.3 HLA-class II expression of bafilomycin A1 treated DCs ... 63
3.2.2.4 3.2.3 Effect of D-2-HG differentiation and maturation of DCs ... 63
CD14 and CD1a expression of D-2-HG treated DCs ... 63
3.2.3.1 DC-SIGN expression on D-2-HG treated DCs ... 64
3.2.3.2 HLA class I molecules of D-2-HG of DCs ... 65
3.2.3.3 3.2.3.3.1 Surface expression of HLA class II molecules ... 66
3.2.3.3.2 Intracellular staining of HLA class II molecules ... 67
3.2.3.3.3 Western blot analyses of HLA class II molecules ... 68
Expression of co-stimulatory molecules CD80/CD86 ... 69
3.2.3.4 3.2.4 Effects of D-2-HG on DC function ... 69
Effect of D-2-HG on cytokine production in DCs ... 69
3.2.4.1 Effect of D-2-HG on T cell stimulatory capacity of DCs ... 70
3.2.4.2 3.2.4.2.1 IFN secretion and proliferation of bulk and naïve enriched T cells ... 70
3.2.4.2.2 Impact of D-2-HG on differentiation of regulatory T cells ... 71
Expression of inhibitory molecules on D-2-HG treated DCs ... 72
3.2.4.3 Effect of D-2-HG on phagocytosis activity of immature DCs ... 73
3.2.4.4 3.2.5 Effect of D-2-HG on G protein receptor signaling ... 74
3.2.6 Impact of D-2-HG on DC metabolism ... 76
Lactate production and glucose consumption of D-2-HG treated DCs ... 76
3.2.6.1 Effect of D-2-HG on mTOR phosphorylation in DCs ... 77
3.2.6.2 Effect of D-2-HG on respiration of DCs ... 78
3.2.6.3 Determination of mitochondrial content in DCs ... 81
3.2.6.4 Measurement of ATP content of DCs ... 82
3.2.6.5 3.2.6.5.1 Effect of mutant IDH1/2 protein expression on respiration of DCs ... 83
Effect of D-2-HG on mitochondrial structure of DCs ... 85
3.2.6.6 3.2.7 Effect of D-2-HG on reactive oxygen species of DCs ... 85
Establishment of measurement of cytosolic ROS by DCFDA ... 86 3.2.7.1
IV
Short-term effects of D-2-HG on cytosolic ROS in DCs ... 87
3.2.7.2 Short-term effect of D-2-HG on mitochondrial ROS of DCs ... 88
3.2.7.3 Long-term effect of D-2-HG ROS levels and cystine uptake in DCs ... 88
3.2.7.4 3.2.8 Effect of oxidants and antioxidants on DCs ... 89
Analyses of peroxide treatment on HLA-DP, -DR and CD1a expression on DCs . 89 3.2.8.1 Antioxidant treatment to rescue D-2-HG treated DCs ... 90
3.2.8.2 3.2.8.2.1 HLA class II expression on trolox and vitamin C treated DCs ... 90
3.2.8.2.2 DC-SIGN and CD1a expression of trolox and vitamin C treated DCs... 91
3.2.8.2.3 IL-12 secretion of trolox and vitamin C treated DCs ... 92
3.2.8.2.4 Reactive oxygen species of Vitamin C treated DCs ... 93
3.2.9 Rescue experiments with modulator of metabolism ... 94
Respiration of metformin and pioglitazone treated DCs ... 94
3.2.9.1 HLA class II expression of metformin and pioglitazone treated DCs ... 95
3.2.9.2 DC-SIGN expression after pioglitazone treated DCs ... 96
3.2.9.3 IL-12 secretion of metformin and pioglitazone treated DCs ... 97
3.2.9.4 ROS levels in metformin and pioglitazone treated DCs ... 98
3.2.9.5 3.2.10 Methylation analysis of DC differentiation ... 99
3.2.11 Primary AML blast from IDH mutated leukemias ... 102
RNAseq data of primary AML IDHMUT blasts from the cancer genome atlas... 102
3.2.11.1 HLA class II protein expression of primary AML IDHMUT blasts ... 103
3.2.11.2 HLA expression on AML blasts analyzed by western blot ... 103
3.2.11.3 4 Discussion ... 105
4.1 Generation of IDH2 R40Q specific T cells... 105
4.1.1 T cell stimulation with peptide and protein of mutant IDH2 R140Q ... 105
4.1.2 Peptide prediction with in silico algorithms ... 105
4.1.3 Influenza peptide is similar to mutant IDH2 R140Q derived peptide IQN9 ... 106
4.2 Effects of D-2-HG on differentiation and metabolism of monocytes derived dendritic cells . 107 4.2.1 Uptake of D-2-HG ... 107
4.2.2 D-2-HG inhibits DC differentiation ... 107
4.2.2.1 T cell stimulation activation in an allogeneic MLR ... 108
4.2.3 Multi-laminar vesicles in DCs ... 108
4.2.4 Impact of D-2-HG on autophagy ... 108
4.2.4.1 Intracellular signaling of D-2-HG ... 109
4.2.5 Effect of D-2-HG on metabolism ... 111
4.2.5.1 Effect of D-2-HG on glycolytic activity ... 111
4.2.5.2 Effect of D-2-HG on respiration ... 112
4.2.6 IDH mutant cells and D-2-HG addition interfere with ROS level... 112
4.2.6.1 Rescue of D-2-HG effects with trolox treatment ... 113
4.2.6.2 Rescue of D-2-HG effects on metabolism with metformin ... 113
4.2.6.3 Rescue of D-2-HG effects on metabolism with pioglitazone ... 114
4.2.7 Effect of D-2-HG on DNA methylation and vitamin C treatment... 114
4.2.8 Expression of mutant IDH protein versus exogenous D-2-HG ... 115
3.2.12 Conclusion ... 116
5 Summary ... 118
5.1 Generation of IDH2 R140Q specific T cells... 118
5.2 Effect of D-2-HG on metabolism and differentiation of monocyte-derived dendritic cells .... 118
6 Zusammenfassung ... 121
6.1 Generierung von IDH2 R140Q spezifischer T Zellen ... 121
6.2 Effekt von D-2-HG auf den Metabolismus und die Differenzierung von DZs ... 121
V References ... 124 Danksagung ...
Lebenslauf ...
VI
List of Figures
Figure 1.1: Production and effects of 2-HG on -ketoglutarate dependent dioxygenases ... 4
Figure 1.2: Compartments containing HLA molecules ... 8
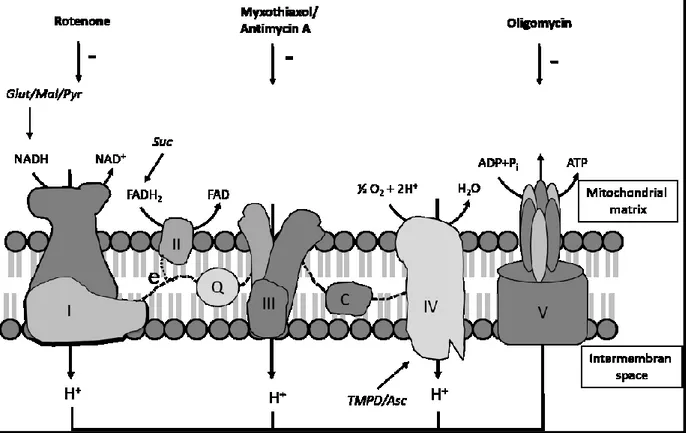
Figure 1.3: Complexes of electron transport chain in the inner mitochondrial membrane ... 12
Figure 2.1: Map of pGEM4Z-65A vector containing the region of IDH2 R140Q ... 27
Figure 2.2: Phase separation after pancoll density separation. ... 30
Figure 3.1: CD8 T cells stimulation with autologous IDH2 R140Q specific peptide loaded PBMCs. ... 48
Figure 3.2: CD8 T cells stimulation with autologous IDH2 R140Q specific peptide loaded DCs ... 49
Figure 3.3: CD8 T cells stimulation with autologous IDH2 R140Q specific peptide pool loaded DCs ... 51
Figure 3.4: Transfection efficiency 4 and 24h after electroporation.. ... 52
Figure 3.5: CD4 T cells stimulation with autologous IDH2 R140Q protein expressing DCs ... 53
Figure 3.6: CD8 T cells stimulation with autologous IDH2 R140Q or influenza peptide loaded DCs ... 54
Figure 3.7: 2-HG concentration in cell pellets of monocytes (MO) ... 55
Figure 3.8: Viability (A), cell yield (B) and mean diameter (C)of D-2-HG treated DCs on day 7. ... 56
Figure 3.9: Bright field pictures of DCs (A) and DCs treated 7 days with D-2-HG (B) ... 56
Figure 3.10: Electron microscope images of day 8 DCs treated with D-2-HG ... 57
Figure 3.11: EM images of day 8 mature DCs treated and activated with LPS ... 58
Figure 3.12: EM image of control (A) and D-2-HG treated DCs (B) ... 59
Figure 3.13: EM images of d8 DCs treated with D-2-HG ... 60
Figure 3.14: Rab9 expression analysis in DC treated with D-2-HG by western blot ... 61
Figure 3.15: LC-3B expression analysis in DC treated with D-2-HG by western blot ... 62
Figure 3.16: LC-3B expression analysis in DC treated with D-2-HG by western blot ... 62
Figure 3.17: HLA-DP (A) and HLA-DR (B) expression of bafilomycin treated DCs ... 63
Figure 3.18: CD14 (A) and CD1a (B) expression of D-2-HG treated DCs ... 64
Figure 3.19: Surface expression of DC-SIGN after 7d incubation with D-2-HG ... 65
Figure 3.20: Impact of D-2-HG on surface expression of HLA-class I molecules after 7 days of culture ... 65
Figure 3.21: Analyses of HLA-DR expression of D-2-HG treated DCs (titration) ... 66
Figure 3.22: HLA-DQ (A), -DP (B) and -DR expression of D-2-HG treated DCs ... 67
Figure 3.23: Intracellular staining of HLA class II molecules in D-2-HG treated DCs ... 68
Figure 3.24: HLA class II expression analysis in DC treated with D-2-HG by western blot ... 68
Figure 3.25: Expression of CD80 (A) and CD86 (B) in D-2-HG treated immature and mature DCs.. ... 69
Figure 3.26: IL-12, IL-10, TNF and IL-6 secretion of mature DCs treated with D-2-HG ... 70
Figure 3.27: IFNγ secretion of bulk CD4 and CD4/CD45RA enriched T cells ... 71
Figure 3.28: CD4/CD25 (A) and CD4/CD25/FoxP3 (B) positive T cells ... 72
Figure 3.29: Expression of inhibitory molecules on D-2-HG treated DCs. ... 73
Figure 3.30: Phagocytose positive cells of D-2-HG treated DCs on day 7 ... 74
Figure 3.31: Western blot Analysis of PKC protein in cytosol and membrane fractions of DCs ... 75
Figure 3.32: cAMP levels of D-2-HG treated DCs ... 76
Figure 3.33: Lactate production (A) and glucose consumption (B) of D-2-HG treated DCs ... 77
Figure 3.34: Online measurement of pH value during 7 days of culture ... 77
VII
Figure 3.35: mTOR phosphorylation (Ser2448) of monocytes ... 78
Figure 3.36: Oxygen concentration over time in DC cultures treated with D-2-HG ... 79
Figure 3.37: Oxygen consumption of D-2-HG treated DCs after 16 hours, 4 and 7 days ... 80
Figure 3.38: OXPHOS the presence and absence of D-2-HG in DCs (A) and T cells (B). ... 81
Figure 3.39: Mitochondrial mass (A) and maximum capacity of electron transport chain (B) ... 82
Figure 3.40: ATP content (A) and oxygen consumed to produce ATP (B) ... 83
Figure 3.41: Oxygen consumption of DCs electroporated with IDH ... 84
Figure 3.42: Oxygen consumption of DCs derived from monocytes electroporated with IDH ... 84
Figure 3.43: EM images of d8 DCs treated with D-2-HG (Donor1) ... 85
Figure 3.44: Oxygen consumption after inhibition of electron transport chain with rotenone ... 86
Figure 3.45: DCFDA staining of monocytes after addition of H2O2. ... 87
Figure 3.46: Short-term effects of D-2-HG on ROS levels in monocytes. ... 87
Figure 3.47: Short-term effect of D-2-HG on mitochondrial ROS in monocytes ... 88
Figure 3.48: DCFDA, MitoSox and cystine staining of 7 days cultured DCs ... 89
Figure 3.49: HLA class II expression of peroxide treated DCs ... 90
Figure 3.50: HLA class II expression after trolox treatment DCs ... 91
Figure 3.51: CD1a (A) and DC-SIGN (B) expression after trolox and vitamin C treatment ... 92
Figure 3.52: IL-12 secretion after trolox treatment. ... 93
Figure 3.53: Mitochondrial (A) and cytosolic (B) ROS levels of vitamin C treated DCs ... 93
Figure 3.54: Basal respiration of DCs treated with metformin ... 95
Figure 3.55: HLA-DP (A) and HLA-DR (B) expression on metformin treated... 96
Figure 3.58: CD1a (A) and DC-SIGN (B) expression on metformin and pioglitazone treated DCs ... 97
Figure 3.56: IL-12 secretion of DCs treated with metformin and pioglitazone ... 98
Figure 3.57: Mitochondrial (A) and cytosolic (B) ROS levels in metformin and pioglitazone treated DCs... 99
Figure 3.59: Methylation analysis of DC differentiation. ... 101
Figure 3.60: RNAseq Data of the Cancer Genome Atlas ... 102
Figure 3.61: HLA-DP (A), -DQ (B) and -DR (C) expression of AML blasts ... 103
Figure 3.62: HLA class II expression of IDH mutant and wild type blasts analyzed by western blot ... 104
VIII
List of Tables
Table 2.1: List of equipment ... 15
Table 2.2: List of plastic consumables ... 15
Table 2.3: Equipment and consumables used for respiration analysis ... 15
Table 2.4: List of chemicals ... 16
Table 2.5: Reagents used for flow cytometry analyses ... 16
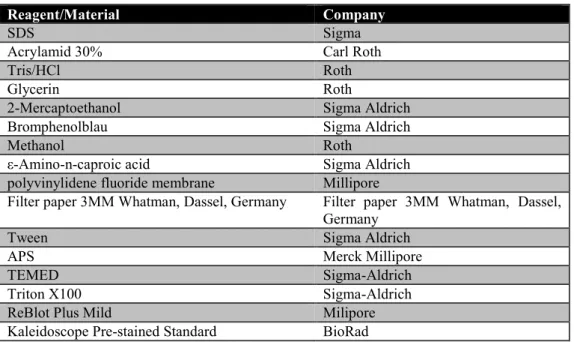
Table 2.6: Material and reagents used for SDS gels and western bloting ... 17
Table 2.7: Components of agarose gel to analyze RNA ... 17
Table 2.8: List of antibodies used for flow cytometry analyses ... 17
Table 2.9: List of fluorescence probes used in flow cytometry... 18
Table 2.10: List of antibodies used for western blot analyses ... 18
Table 2.11: Cell culture media and supplementaries... 18
Table 2.12: List of cytokine used in cell culture ... 18
Table 2.13: Other substances ... 19
Table 2.14: Material for magnetic-activated cell separation ... 19
Table 2.15: Material and reagents used for ELISpot ... 19
Table 2.16: Enzymes ... 19
Table 2.17: List of kits ... 19
Table 2.19: Peptide sequences of IDH2 and IDH2 R140Q specific peptides ... 22
Table 2.20: Dephosphorylation reaction ... 23
Table 2.21: Reagents for ligation ... 23
Table 2.22: Components of lysogeny broth (LB) media ... 24
Table 2.23: Values for DNA/RNA purity ... 25
Table 2.24: Sequencing primer ... 25
Table 2.25: Reagents used for quickchange mutagenese ... 26
Table 2.26: Cycler protocol for quickchange mutagenesis ... 26
Table 2.27: Components for linearization of plasmid ... 27
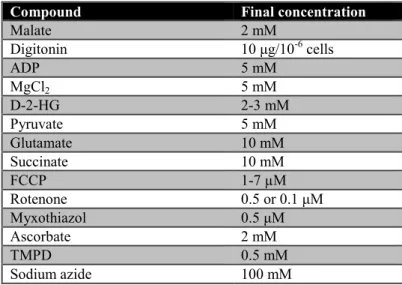
Table 2.28: Substances used to modulate oxygen consumption ... 40
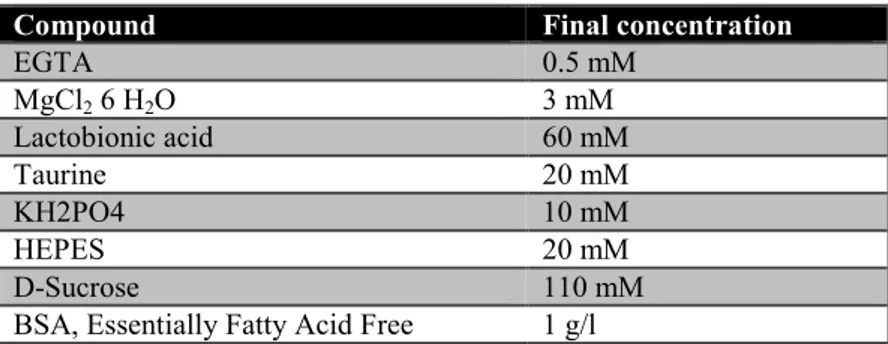
Table 2.29: Components of MIRO5 used for permeabilzed cells in oxygraph ... 40
Table 2.30: Substrates used to measure activity of different complexes of electron transport chain ... 41
Table 2.31: Genomic position of analyzed CpG residues ... 43
Table 3.1: Result scores of in silico HLA binding prediction ... 47
Table 3.2: Peptides used for peptide pool stimulation in 96-well format ... 50
Table 3.3: Summary of results of stimulation with peptide loaded antigen presenting cells ... 52
IX
List of Abbreviations
°C Degree celcius
AC Adenylyl cyclase
AEC 3-Amino-9-Ethyl-carbazole
AKT Protein kinase B
AML Acute myeloid leukemia
APC Antigen presenting cell
ATP Adenosintriphosphate
BafA1 Bafilomycin A1
bp Base pairs
BSA Bovine serum albumin
BTLA LAG-3
B and T lymphocyte attenuator Lymphocyte activation gene-3
cAMP Cyclic adenine monophosphate
CFSE Carboxyfluorescein succinimidyl ester
CIITA Class II major histocompatibility complex transactivator CIP Alkaline phosphatase from calf intestinal
CLIP Class II-associated invariant chain peptide
CREB CAMP response element-binding protein
CT Cancer testis
D-2-HG D-2-hydroxyglutarate
DC Dendritic cell
DCFDA 2′,7′-Dichlorofluorescin diacetate
DC-SIGN
Dendritic Cell-Specific Intercellular adhesion molecule-3-Grabbing Non- integrin
DEPC Diethylpyrocarbonat
DMSO Dimethylsulfoxid
DNMT DNA methyltransferases
DNMT3A DNA methyltransferase 3A
dNTP Desoxyribonukleosidtriphosphate
EDTA Ethylene-Diamine-Tetra-Acetic acid
X EGTA Glycol-bis(2-aminoethylether)-N,N,N',N'-tetraacetic acid
ELISA Enzyme-linked immunosorbent assay
ELISpot Enzyme-Linked ImmunoSpot
EM Electron microscopy
ER Endoplasmatic reticulum
ETC Electron transport chain
FACS Fluorescence assisting cell sorting
FCCP Carbonyl cyanide-p-trifluoromethoxyphenylhydrazone
FCS Fetal clalf sera
FLT3 Fms-like tyrosine kinase 3
FoxP3 Forkhead box P3
GFP Green fluorescence protein
GM-CSF Granulocyte Macrophage Colony- Stimulating Factor
GPCR G protein coupled receptor
h Hour
HEPES Hydroxyethyl piperazineethanesulfonic acid Hif 1a Hypoxia inducible factor 1a
HIS Histidin
HK2 Hexokinase 2
HLA Human leucocyte antigen
HS Human sera
HSC Hematopoietic stem cell
ICAM Intercellular adhesion molecule
iDC Immature DC
IDH Isocitrate dehydrogenase
IFNγ Interferon γ
IKKε Inhibitor of nuclear factor-κB kinase subunit-ε
IL Interleucin
ILT-2 Immunoglobulin-like transcript 2 ILT-3 Immunoglobulin-like transcript 3 IQN9/10 9/10 mer peptide of mutant IDH
XI
KDM Lysine demethylases
LB Lysogeny broth
LC-3B Microtubule-associated proteins 1A/1B light chain 3B
LHGDH L-hydroxyglutarate dehydrogenase
li invariant chai
LPS Lipopolysaccaride
MACS Magnetic-activated cell separation
MAGE Melanoma-associated antigen
MALDI-TOF Matrix Assisted Laser Desorption Ionization - Time of flight MAPK Mitogen-activated protein kinase
MDDCs Monocyte-derived dentritic cell
min Minute
mL Milliliter
MLR Mixed lymphocite reaction
MNC Mononuclated cells
MOPS 3-(N-morpholino)propanesulfonic acid)
MS Mass spectrometry
mTOR Mammalian Target of Rapamycin
Mut Mutant
MVB Multivascular bodies
NF-κB Transcription factor nuclear factor-kappaB
NPM1 Nucleophosmin 1
OCR Oxygen consumption rate
OCT1 Organic anion transporter 1
OD Optical density
PBMC Peripheral blood mononuclated cells
PBS Phosphate buffered saline
PCR Polymerase chain reaction
PDL-1 Programmed cell death ligand 1
PGC1α PPARγ co-activator 1α
PGE2 Prostaglandin 2
XII
PhD Prolyl hydroxylase
PKC Protein kinase C
PolyA Poly adenin
PPARγ Peroxisome proliferator-activated receptor-γ
Rab9 Ras-related protein 9
ROS Rective oxigen species
RPKM Reads per kilobase million
RPKM Reads per kilobase million
rpm Rounds per minute
s Second
SDS Sodium dodecyl sulfate
SLC13A3 Solute carrier family 13 member 3 SLC22A6 Solute carrier family 22 member 6
SOD Superoxide dismutase
TAE TRIS-Acetate-EDTA
TBK1 TANK-binding kinase 1
TCA Tricarboxylic acid
TCGA The cancer genome atlas
TCR T cell receptor
TET2 Tet methylcytosine dioxygenase 2
TIM-3 T cell immunoglobulin-3
TLR Toll-like receptor
TMPD Tetramethylphenylendiamin
TNF Tumor necrosis factor
Treg Regulatory T cells
TSA Tumor-specific antigens
V Volt
DCFDA 2′,7′-Dichlorofluorescin diacetate MOPS 3-(N-morpholino)propanesulfonic acid)
AEC 3-Amino-9-Ethyl-carbazole
IQN9/10 9/10 mer peptide of mutant IDH
XIII
AML Acute myeloid leukemia
ATP Adenosintriphosphate
AC Adenylyl cyclase
APC Antigen presenting cell
BTLA B and T lymphocyte attenuator
BafA1 Bafilomycin A1
bp Base pairs
BSA Bovine serum albumin
CREB CAMP response element-binding protein
FCCP Carbonyl cyanide-p-trifluoromethoxyphenylhydrazone CFSE Carboxyfluorescein succinimidyl ester
CIITA Class II major histocompatibility complex transactivator CLIP Class II-associated invariant chain peptide
cAMP Cyclic adenine monophosphate
D-2-HG D-2-hydroxyglutarate
°C Degree celcius
DC Dendritic cell
DC-SIGN
Dendritic Cell-Specific Intercellular adhesion molecule-3-Grabbing Non- integrin
dNTP Desoxyribonukleosidtriphosphate
DEPC Diethylpyrocarbonat
DMSO Dimethylsulfoxid
DNMT3A DNA methyltransferase 3A
EM Electron microscopy
ETC Electron transport chain
ER Endoplasmatic reticulum
ELISA Enzyme-linked immunosorbent assay
ELISpot Enzyme-Linked ImmunoSpot
EDTA Ethylene-Diamine-Tetra-Acetic acid
FCS Fetal clalf sera
FACS Fluorescence assisting cell sorting
XIV
FLT3 Fms-like tyrosine kinase 3
FoxP3 Forkhead box P3
GPCR G protein coupled receptor
EGTA Glycol-bis(2-aminoethylether)-N,N,N',N'-tetraacetic acid GM-CSF Granulocyte Macrophage Colony- Stimulating Factor
GFP Green fluorescence protein
HSC Hematopoietic stem cell
HK2 Hexokinase 2
HIS Histidin
h Hour
HLA Human leucocyte antigen
HS Human sera
HEPES Hydroxyethyl piperazineethanesulfonic acid Hif 1a Hypoxia inducible factor 1a
iDC Immature DC
ILT-2 Immunoglobulin-like transcript 2 ILT-3 Immunoglobulin-like transcript 3
IKKε Inhibitor of nuclear factor-κB kinase subunit-ε
IFNγ Interferon γ
IL Interleucin
IDH Isocitrate dehydrogenase
LHGDH L-hydroxyglutarate dehydrogenase
LPS Lipopolysaccaride
LAG-3 Lymphocyte activation gene-3
KDM Lysine demethylases
LB Lysogeny broth
MACS Magnetic-activated cell separation
mTOR Mammalian Target of Rapamycin
MALDI-TOF Matrix Assisted Laser Desorption Ionization - Time of flight LC3B Microtubule-associated proteins 1A/1B light chain 3B
mL Milliliter
XV
min Minute
MAPK Mitogen-activated protein kinase
MLR Mixed lymphocite reaction
MDDCs Monocyte-derived dentritic cell
MNC Mononuclated cells
MVB Multivascular bodies
Mut Mutant
NPM1 Nucleophosmin 1
OD Optical density
OCT1 Organic anion transporter 1
OCR Oxygen consumption rate
PBMC Peripheral blood mononuclated cells
PPARγ Peroxisome proliferator-activated receptor-γ
PBS Phosphate buffered saline
PolyA Poly adenin
PCR Polymerase chain reaction
PGC1α PPARγ co-activator 1α
PDL-1 Programmed cell death ligand 1
PhD Prolyl hydroxylase
PGE2 Prostaglandin 2
AKT Protein kinase B
PKC Protein kinase C
Rab9 Ras-related protein 9
RPKM Reads per kilobase million
RPKM Reads per kilobase million
ROS Rective oxigen species
RBC Red blood cells
Treg Regulatory T cells
rpm Rounds per minute
s Second
SDS Sodium dodecyl sulfate
XVI SLC13A3 Solute carrier family 13 member 3
SLC22A6 Solute carrier family 22 member 6
TIM-3 T cell immunoglobulin-3
TBK1 TANK-binding kinase 1
TET2 Tet methylcytosine dioxygenase 2
TMPD Tetramethylphenylendiamin
TCGA The cancer genome atlas
TLR Toll-like receptor
NF-κB Transcription factor nuclear factor-kappaB
TCA Tricarboxylic acid
TNF Tumor necrosis factor
V Volt
1
1 Introduction
1.1 Acute Myeloid Leukemia
All blood cells originate from hematopoietic stem cells (HSCs) in the bone marrow. HSC can differentiate to multipotent stem cells and further to lymphoid or myeloid progenitor cells.
Myeloid progenitor cells give rise to red blood cells, platelets, eosinophils, basophils, neutrophils and monocytes which further differentiate to macrophages or DCs. Lymphoid progenitor cells can differentiate to natural killer cells, B cells and T cells 1.
In patients with acute myeloid leukemia (AML) a cancer of myeloid blood cells this differentiation is altered. This leads to a high number of progenitor cells without any function and a reduced number of erythrocytes, thrombocytes and leucocytes. It is the most common type of acute leukemia in adults. As its incidence is rising with age as well as life expectancy, the number of AML patients will also increase 2. In older patients, prognosis is poor due to high relapse rates after induction chemotherapy. But the prognosis also depends on recurrent molecular and cytogenetic abnormalities and the mutational load of the patients. Today about 35-40% of patients under 60 years go to remission after chemotherapy and stem cell transplantation 3. Also, mutation specific and immunomodulatory treatments are under investigation in ongoing clinical studies like fms-like tyrosine kinase 3 (FLT3) and isocitrate dehydrogenase (IDH) 1 and 2 inhibitors 4,5
1.1.1 Mutations in AML
There are multiple recurrent genetic mutations known in AML, but as with most cancer types the disease-causing mutations differ between subtypes of AML. The mutations known in AML can be classified in 9 categories, transcription factor fusions, the nucleophosmin 1 (NPM1) genes, tumor suppressor genes, DNA methylation-related genes, myeloid transcription factor genes, cohesion complex genes, and spliceosome complex genes 6–8. There are also mutations interfering with more than one cellular process. Some mutation lead to a gain of function like in the case of the IDH, others are driver mutation. IDH mutations are no driver mutations, the mutation alone is not able to start leukemia development 9. The mutational landscape of AML patients is dynamic due to coexisting competing clones, there is disease evolution. Based on the genetic abnormalities patients can be classified in risk categories (favorable, intermediate and adverse). For example are mutations in the NPM1 gene are favorable, FLT-3 gene abnormalities are highly diverse and are found in all
2 categories and DNA methyltransferase 3A (DNMT3A) and IDH mutations are not yet classified 8.
FLT3 is involved in proliferation, differentiation and survival of early hematopoietic progenitor cells. An internal tandem repeat mutation (repetition of one or more base pairs inside the gene) in the FLT3 gene is present in 20% of all AML patients 10. In patients younger than 65 years with normal karyotype the prognosis of patients with a FLT3 mutation is poor in other patient groups the prognosis is still unclear 11–14.
NPM1 is mutated in 30% of AML patients. NPM1 is a protein moving proteins from cytosol to nucleus and back to prevent accumulation of proteins in nucleolus. NPM1 is involved in other cellular processes such as the regulation of centrosome function and biosynthesis of ribosomes and p53 tumor suppressor pathways 15. 40% of patients with NPM1 mutation also have a FLT3-internal tandem duplication (ITD) mutation and in 25% additional to NPM1 IDH is mutated. If NPM1 is mutated without an FLT3 mutation, younger adults had a higher relapse free and overall survival 14,16.
Mutations in DNMT3A lead to an altered epigenetic landscape. DNMT3A is responsible for de novo methylation of DNA after replication. Methylations of promotor regions are associated with gene silencing. Mutation in DNMT3A may lead to a lack of silencing of self-renewal genes during differentiation of hematopoietic stem cells. DNMT3A mutations are present in 20% of AML patients; the mutation is conserved during blast evolution. In clinical studies patients with a DNMT3A mutation had a shorter event free and overall survival than patients expressing wild type DNMT3A 14,17,18. Another mutation interring with the epigenetic landscape is the IDH mutation.
1.1.1.1 IDH mutation
There are three isoforms of the metabolic enzyme IDH. IDH1 is present in cytoplasm, while IDH2 and IDH3 are mainly present in mitochondria. IDH converts isocitrate to - ketoglutarate. Alternatively -ketoglutarate can also be generated from glutamine taken up from the extracellular space (glutaminolysis) 19.
If IDH is mutated it gains the ability to convert -ketoglutarate to the onco-metabolite D-2-hydroxyglutarate (D-2-HG) 20,21. The mutation of the IDH2 gene, has a frequency of about 10% in AML patients. The most frequent mutation of IDH2 is the substitution of arginine with glutamine at position 140 (R140Q); there is another mutation at position 172 where an arginine is substituted by lysine (R172K). IDH1 mutations are less frequent in AML
3 patients (6%) 22. There are six mutations known IDH1 -R132H, -R132C, -R132S, -R132L, - R132G and -R132P. The most common are the IDH1-R132C and -R132H mutations (together about 50% of IDH1 mutation) 23.
1.1.1.1.1 Prognosis in AML patients with IDH mutation
As IDH mutations promotes tumorgenesis, but could not cause leukemia by its own it is difficult to estimate its impact on prognosis of AML patients 9. In the case of gliomas its more straightforward several studies have shown that glioma patients with an IDH1 mutation showed a higher overall survival 24–26. In AML, the prognosis of patients with IDH mutations is not yet clarified. Wang et al analyzed 2-HG serum level in AML patients. They found that high 2-HG (produced by mutant IDH1/2) levels were associated with lower overall survival and event-free survival in cytogenetically normal AML patients 27. Other studies showed similar results in IDH1 mutated AML patients, they had a reduced event-free survival but comparable overall survival 28,29. Another study with 826 patients (165 mutated; 59 IDH1- R132, 83 IDH2-R140, and 23 IDH2-R172) found no difference in the cohorts IDH wild type and mutated 30. To conclude the prognosis of AML patients with IDH mutation depends on mutation site. In general, prognosis also depend on patient age and treatment regime and cannot be generalized.
1.1.1.1.2 Production of 2-hydroxyglutarate
As mentioned above mutations in the IDH gene leads to the production of D-2-HG. D-2-HG can be measured in sera of AML patients (up to 600 µM) 28 but also in much higher concentrations in tissues of glioma patients. Here concentrations up to 35 mM were measured
31. In AML patients D-2-HG level in sera differ depending on the IDH mutation. In a study were 2-HG level of AML patients with IDH1 R132H mutations were compared with IDH2 R140Q and R172K revealed a comparable level of 2-HG in IDH1 R132H and IDH2 R140Q mutated patients but a higher level in patients with IDH2 R172K mutation 32. In another study IDH1 R132H mutated patients had the highest 2-HG level in the sera 33. But there are tumor entities with high 2-HG level without an IDH mutation. In breast cancer cells expressing the transcription factor MYC 2-HG level were also elevated, due to production of 2-HG from glutamine-derived ketoglutarate (glutaminolysis) supported by MYC signaling 34.
In addition to the D enantiomere also L-2-HG can be produced. L-2-HG is produced in healthy cells under hypoxic conditions. Malate dehydrogenase 1 and 2 and lactate dehydrogenase A produce L-2-HG out of -ketoglutarate derived from glutamine 35. L-2-HG
4 is also known to accumulate in renal cell carcinoma; here a mutation in the gene of L-hydroxyglutarate dehydrogenase (LHGDH), an enzyme responsible for the breakdown of L-2-HG, is mutated 36.
D-2-HG can be degraded and converted back to α-ketoglutarate; this is catalyzed by D-2-HG dehydrogenase. In this reaction the co-factor FAD is reduced to FADH2. Ketoglutarate can enter the citric acid cycle and fuel energy production 37.
1.1.1.1.3 Effects of 2-hydroxyglutarate
There are several effects and enzyme targets of 2-HG already known. For 2-HG production NADPH is needed and NADP+ produced, this alters the NADPH/NADP+ ratio and possibly has an influence on the redox balance 38–40.
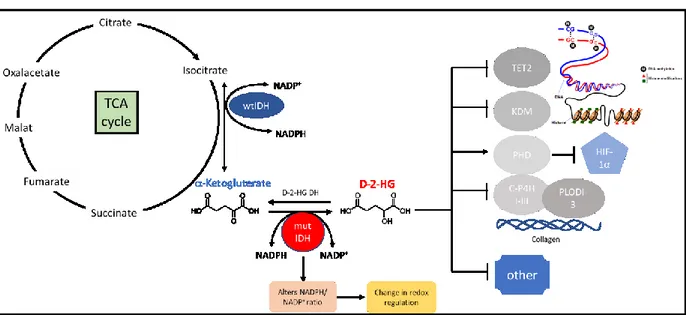
As shown in Figure 1.1 D-2-HG and L-2-HG inhibit a-ketoglutarate dependent dioxygenases like lysine demethylases (KDM) and Tet methylcytosine dioxygenase 2 (TET2).
These enzymes change chromatin accessibility and thereby regulate also gene transcription.
The alteration of the epigenetic landscape can lead to a block in differentiation and thereby to tumorigeneses 41,42.
2-HG also interferes with Prolyl hydroxylase 2, which destabilize HIF-1a 43,44. This induces for example the expression of glucose transporters and thereby alters the glucose metabolism of the cell. Collagen maturation is also inhibited by D-2-HG 39,45.
Figure 1.1: Production and effects of 2-HG on -ketoglutarate dependent dioxygenases
Isocitrate dehydrogenase 2 converts isocitrate to -Ketoglutarate in citric acid cycle. It acts as a homodimer. If there is a mutation in the enzyme it gains a new function and is able to produce D-2-HG from -Ketoglutarate and act as a heterodimer with one wild type and one mutated unit. This reaction consumes NADPH and thereby changes the ratio of NADPH/NADP+ and redox regulation. D-2-HG itself inhibits -Ketoglutarate dependent dioxygenases due to the structural similarity to -
5
Ketoglutarate. Dioxygenases like TET2 and KDM are involved in DNA and histone methylation. If these enzymes are inhibited changes in the epigenetic landscape may cause a block in differentiation. Prolyl hydroxylase 2(PhD) is also inhibited by D-2-HG, this leads to a stabilization of HiF-1. C-H4P and PLODI-3 is also inhibited by 2-HG, this interferes with collagen maturation. KDM, lysine demethylase; TET2, Tet methylcytosine dioxygenase 2; PhD, Prolyl hydroxylase; C- H4P, collagen heavy chain precursor 4. (Adopted from 45)
1.2 Epigenetic
Epigenetic factors change gene expression but not by changing the gene sequence; they cause a phenotypic alteration without changing the genotype. The epigenetic landscape can be altered by environmental chemicals, pharmaceuticals/drugs, aging/reactive oxygen species and the diet 46,47. Epigenetics mainly focus on histone and DNA modification. Triggered by an epigenetic factor, histones can for example acetylated which alters how tight DNA is wrapped around histones and finally gene accessibility. The same is true for DNA methylations; here one or more methyl groups are added to DNA base 46,48.
1.2.1 DNA Methylation
In general DNA methylation occurs in cytosine and guanine rich areas, so called “CpG islands”. Methylation can be added or removed to C-5 position of the cytosine ring to modulate gene expression. Sites can be de novo methylated or re-established after replication.
De novo methylations are performed by DNA methyltransferases (DNMTs), as mentioned above mutation in these genes are present in leukemia patients.
DNA methylation in most cases is associated with gene silencing 49. During differentiation cells need to change the portfolio of expressed genes, so the methyl groups must be removed. This is done by demethylases, for example in dendritic cells (DCs) the dominant demethylase is TET2. TET2 is responsible for the demethylation of gene regions important for differentiation of monocytes to DCs 50.
1.3 Immunological background 1.3.1 T cells
There are two main classes of T cells defined by expression of either the costimulatory molecule CD4 (T helper cell) or CD8 (cytotoxic T cells). Depending on the cytokines in the environment CD4 T cells can differentiate into regulatory T cells (Treg, regulation of immune responses) TH1 cells (protection against intracellular microbes), TH2 cells (protection against parasites) and TH17 cells (control of infections) 1.
CD8 T cell receptors (TCR) recognize peptides of a length of 8-10 amino acids bound to HLA (human leukocyte antigen) class I molecules, while CD4 T cells recognize 14-20
6 amino acid peptides bound to HLA class II molecules. In general HLA class I peptides are derived from proteins in the cytosol like viral or mutated proteins. HLA class I molecules are expressed on all nucleated cells, while under non-inflammatory conditions class II molecules are only expressed on immune cells and present peptides from phagocytosed extracellular proteins. In some cases also HLA class I molecules can present exogenous proteins, this is known as cross-presentation 1.
Dendritic cells (DCs) are the only antigen presenting cells (APCs) able to prime and activate naïve T cells 1. For T cell priming adhesion molecules of DCs (ICAM-1, ICAM-2 and CD58) bind to adhesion molecules on T cells (LFA-1 and CD2). This is important for T cells to scan HLA molecules loaded with antigens presented on HLA molecules of DCs. If naïve T cells recognize their HLA-peptide ligand with the TCR, the affinity of the adhesion molecules increases; this is needed for proliferation and differentiation into effector T cells 1.
Binding of the TCR, the CD4/CD8 co-receptor and the CD3 molecule (T cell site) to peptide bound HLA molecule (DC site) is only one of at least three signals T cells need to get activated and become a full functional T effector cell. Survival of T cells is induced by binding of the costimulatory molecule CD28 to CD80 or CD86 expressed on APCs (second signal). Finally, the secretion of pro-inflammatory cytokines like interleukine-6 (IL-6), IL-12, IL-4 and IL-23 leads to T cell differentiation and activation 1. CD28-dependent co-stimulation also leads to IL-2 production and IL-2 receptor α chain (also known as CD25) synthesis.
Bevor stimulation only the β and γ chains of the IL-2 receptor are expressed, and the α chain increases the affinity of the receptor to IL-2. This leads to a higher proliferation rate 1. After the activation of T cells, they can execute their function as an effector cell and kill pathogens or activate other immune cells. If the activation was strong enough memory cells are generated for a faster response in case of a second infection 1.
1.3.2 Antigen presenting cells
Professional APCs are DCs, macrophages and B cells. B cells take up antigens by antigen specific receptors, while DCs and macrophages perform micropinocytosis (non-selective uptake of solute molecules, nutrients and antigens) or phagocytosis (uptake solid matter or pathogens). As mentioned above these antigens are then presented on HLA molecules.
1.3.2.1 Dendritic cells
Immature DCs are characterized by high phagocytic activity. After phagocytosis and/or contact with bacterial components, such as lipopolysaccharide (LPS), DCs get activated. LPS
7 is a bacterial molecule present in the membrane of gram-negative bacteria. LPS activates toll- like receptor 4 (TLR4). They are 10 TLRs known in human. Binding of LPS to TLR4 sequentially leads to the activation of Mitogen-activated protein kinase (MAPK) and transcription factor nuclear factor-kappaB (NF-κB). This finally leads to activation of DCs and the production and secretion of pro-inflammatory cytokines like IL-12, IL-6 and TNF 51. After activation DCs leave the peripheral tissue and migrate through the lymph system to secondary lymphoid organs. This is possible due to a reorganization of adhesion molecules and the cytoskeleton. During maturation, DCs upregulate the expression of costimulatory molecules and surface marker like CD80/CD86, DC-SIGN and HLA class I and II molecules.
1.3.2.2 HLA class II molecules
The main regulator of HLA class II gene expression is the class II major histocompatibility complex transactivator (CIITA), which is constitutively expressed in professional APCs (DCs, B cells) and can be induced in non-professional APCs for example by interferon γ (IFNγ). DCs and B cells upregulate HLA class II expression during differentiation 52,53.
After translation HLA class II molecules enter the endoplasmatic reticulum (ER) and associate with the invariant chain (Ii). Through golgi aperatus traffic machinery HLA class II molecules get delivered to the cell membrane. From there HLA class II molecules reach the multivascular antigen-processing compartments, in these compartments the Ii is cleaved and only the class II-associated invariant chain peptide (CLIP) remains bound in the peptide groove of the HLA class II molecule 54.
HLA-DM also present in the antigen-processing compartment, enables the binding of peptide antigens and is regulated by HLA-DO 55. Antigens enter the antigen-processing compartment through clathrin-mediated endocytosis, macropinocytosis autophagy and phagocytosis. The antigens get proteolytic cleaved in vesicles (endosomes, macropinosomes, autophagosomes and phagolysosomes). These vesicles then fuse to the antigen-processing compartment 54. It was also shown that HLA molecules bound to Ii reach the antigen- processing compartment without being on the cell membrane before 56.
If peptides are bound on HLA class II molecule the compartment does a tubulation which allow peptide bound HLA molecule to traffic to and to get released on the cell membrane 57,58.
Walseng et al. estimated that about 80% of peptide bound HLA class II molecules are on the cell membrane and 20% intracellular. HLA class II molecules get recycled after
8 peptide binding and internalization, but this is only possible in mature DCs. After one peptide is released from the HLA class II molecule it can be loaded with another peptide and transported again to the cell membrane 56.
Electron microscopic analysis revealed different compartments containing HLA class II molecules, there are simplified summarized from literature in Figure 1.2. How these compartments are formed and how they are related is not fully understood.
Figure 1.2: Compartments containing HLA molecules. There are different compartments in the cell were HLA class II are present in antigen presenting cells. HLA-DR gold staining revealed the presents of HLA-DR in multilaminar bodies and multivascular bodies (MVB). MVB undergo tubulation under their maturation. In the tubular structure small vesicles containing peptide loaded HLA-DR get separated and transported to the cell surface (Adopted from 57–60).
1.4 Cellular therapy as cancer treatment
In the last decades cellular therapy is evolved a promising strategy to cure cancer. For cellular therapy modified autologous or allogenic cells are transferred to patients for anti-tumor response. Somehow also allogenic stem cell transplantation is a cellular therapy in which the immune cells of the donor eliminate remaining tumor cells after chemotherapy (so called Graft-versus-leukemia effect). To optimize anti-tumor activity, immune cells can be genetically modified before the transfer into patients. T cells are one of the most promising cell types for immune therapy.
It is known that T cells can infiltrate tumor tissue. Clinical studies showed a positive correlation between infiltrated T cells and patients overall survival 61. In another studies in hepatocellular carcinoma and breast cancer, it was found that it was critical which subset was