Conservation and diversification of MIKC*
MADS-domain transcription factors during the evolution of vascular land plants
Inaugural-Dissertation zur
Erlangung des Doktorgrades
der Mathematisch-Naturwissenschaftlichen Fakultät der Universität zu Köln
vorgelegt von Michiel Kwantes aus Tilburg, Niederlande
Köln, 2010
Die vorliegende Arbeit wurde am Max-Planck-Institut für Züchtungsforschung in Köln durchgeführt.
Berichterstatter: Prof. Dr. Heinz Saedler Prof. Dr. Jonathan C. Howard
Tag der mündlichen Prüfung: 25.06.2009
“So I have just one wish for you - the good luck to be somewhere where you are free to maintain the kind of integrity I have described […that is not lying, but bending over backwards to show how you're maybe wrong…] and where you do not feel forced by a need to maintain your position in the organization, or financial support, or so on, to lose your integrity. May you have that freedom.”
Richard P. Feynman
Adapted from the Caltech commencement address given in 1974.
Abstract
The morphological diversity of land plants is astounding. However, what we see mostly is the sporophytic phase that is dominant in the majority of land plants. In contrast, the diversity of the secret gametophytic phase is unseen and rather uninvestigated. Recently, evidence has accumulated that the so-called MIKC* group of MADS-domain transcription factors is important for the proper functioning of the Arabidopsis male gametophyte (pollen). Already earlier, MIKC* genes were identified in the moss Physcomitrella patens, which has a dominant gametophytic phase. MADS- domain proteins are well known for the roles they have in flower development and thus for the establishment of the sporophytic body plan. That MIKC* genes have a similar role in the gametophytic phase is not granted, but a tempting hypothesis. To study the function of MIKC* genes and their possible role in land plant gametophyte development and its evolution, they were isolated from a broad variety of vascular land plants, namely, the lycophyte Selaginella moellendorffii, the fern Ceratopteris richardii, the basal eudicot Eschscholzia californica, the monocot Oryza sativa and the basal angiosperm Aristolochia fimbriata. Sequence comparison showed that MIKC*
MADS-box genes probably evolved from classical MIKC
cgenes by a duplication
event in the Keratin-like domain. Further phylogenetic analysis revealed that 2
phylogenetic subclades emerged early in the evolution of vascular plants and
indications were found for a recent subfunctionalization of one of the subclades in
angiosperms. MIKC* genes from different, remote, plant lineages were heterologously
expressed in an Arabidopsis MIKC* mutant and it could be shown that they were able
to perform the same function as Arabidopsis MIKC* genes. This information plus the
results that were gathered by performing expression and yeast-2-hybrid interaction
studies, were unified in a hypothesis concerning the function of MIKC* genes during
land plant evolution.
Zusammenfassung
Die morphologische Vielfalt der Landpflanzen ist staunenerregend. Dabei ist was wir
sehen meist die sporophytische Phase, die bei der Mehrheit der Landpflanzen
dominant ist. Die Vielfalt der geheimnisvollen gametophytischen Phase dagegen, ist
verborgen und eher unerforscht. In jüngster Zeit haben sich die Hinweise verdichtet,
dass die sogenannte MIKC*-Gruppe von MADS-Domänen-Transkriptionsfaktoren in
Arabidopsis wichtig für das normale Funktionieren des männlichen Gametophyten
(des Pollens) ist. Bereits zuvor wurden MIKC*-Gene in dem Moos Physcomitrella
patens, das eine dominante haploide Phase besitzt, gefunden. MADS-Domänen-
Proteine sind sehr bekannt für ihre Rolle in der Blütenentwicklung und damit in der
Realisierung des sporophytischen Bauplans. Dass MIKC*-Gene eine ähnliche Rolle
in der gametophytischen Generation spielen, ist nicht gewiss, jedoch eine
verlockende Hypothese. Um die Funktion von MIKC*-Genen und ihre mögliche
Rolle in der Evolution von Landpflanzen-Gametophyten zu untersuchen, wurden sie
aus den verschiedensten Gruppen der Gefäßpflanzen isoliert, nämlich aus dem
Bärlappgewächs Selaginella moellendorffii, dem Farn Ceratopteris richardii, der
basalen Eudicotylen Eschscholzia californica, der einkeimblättrigen Art Oryza sativa
und aus der basalen Angiosperme Aristolochia fimbriata. Sequenzvergleiche zeigten,
dass MIKC*-MADS-Box-Gene sich vermutlich aus klassischen MIKC
c-Genen durch
ein Duplikationsereignis in der Keratin-ähnlichen Domäne entwickelt haben. Weitere
phylogenetische Untersuchungen zeigten, dass früh in der Evolution der
Gefäßpflanzen zwei phylogenetische Untergruppen entstanden und es wurden
Hinweise auf eine rezente Subfunktionalisierung einer der beiden Sub-Kladen in
Angiospermen gefunden. MIKC*-Gene aus verschiedenen, entfernt verwandten
Pflanzen-Linien wurden heterolog in einer Arabidopsis MIKC*-Mutante exprimiert,
und es konnte gezeigt werden, dass sie in der Lage waren, dieselbe Funktion wie
Arabidopsis MIKC*-Gene auszuführen. Diese Erkenntnisse, sowie die Ergebnisse
von Expressions- und Yeast-2-Hybrid-Interaktions-Studien wurden in einer
Hypothese bezüglich der Funktion von MIKC*-Genen in der Evolution der
Landpflanzen vereint.
Table of Contents
1 INTRODUCTION...1
1.1 O
N THE ALTERNATION OF GENERATIONS DURING LAND PLANT EVOLUTION...1
1.2 MADS-
BOX GENES ARE IMPORTANT FOR THE ANGIOSPERM BODY PLAN...2
1.3 MIKC*
TRANSCRIPTION FACTORS ARE IMPORTANT FOR THE DEVELOPMENT OF THEA
RABIDOPSIS MALE GAMETOPHYTE...3
2 MATERIAL AND METHODS...6
2.1 P
LANT MATERIALS AND CULTIVATION...6
2.2 I
DENTIFICATION OFMIKC*
SEQUENCES IN MODEL SPECIES...7
2.3 C
LONING OFMIKC*
SEQUENCES...8
2.4 P
HYLOGENETIC ANALYSIS OFMIKC*
SEQUENCES...9
2.5 E
XPRESSION STUDY OF SELAGINELLA MOELLENDORFFIIMIKC*
GENES USING QUANTITATIVE REAL-
TIMEPCR ...10
2.6 Y
EAST-2-
HYBRIDMIKC*
INTERACTION STUDY...10
2.7 T
RANSFORMATION OFA
RABIDOPSIS...11
2.8 S
ELECTION OF TRANSGENIC PLANTS...12
2.9
IN VITRO POLLEN GERMINATION ASSAYS...12
3 RESULTS ...14
3.1 MIKC*
GENES WERE IDENTIFIED IN ALL MODEL SPECIES...14
3.2 S
EQUENCE COMPARISON OF THEK-
DOMAIN OFMIKC*
ANDMIKC
C GENES REVEALS AN ANCIENT DUPLICATION...16
3.3
L
AND PLANTS HAVE MULTIPLE CLASSES OFMIKC*
PROTEINS...17
3.4 MIKC*
GENES ARE EXPRESSED SPECIFICALLY IN GAMETOPHYTES(
AND ROOTS?) ...21
3.5 MIKC*
PROTEINS FROM DIFFERENT SPECIES SHOW VARIABLE INTERACTIONS...22
3.5.1 Oryza sativa MIKC* protein interactions...23
3.5.2 Eschscholzia californica MIKC* protein interactions...24
3.5.3 Ceratopteris richardii MIKC* protein interactions...25
3.5.4 Selaginella moellendorffii MIKC* protein interactions...26
3.6 A
RABIDOPSIST1
TRANSGENIC LINES SHOW HIGH COPY NUMBERS...27
3.7 T
HE POLLEN GERMINATION PHENOTYPE OF THEA
RABIDOPSIS AGL66/104 DOUBLE MUTANT CAN BE RESCUED BY HETEROLOGOUS EXPRESSION OFMIKC*
GENES FROM DISTANTLY RELATED SPECIES...28
4 DISCUSSION ...32
4.1 A
NEW ORIGIN FORMIKC*
GENES...32
4.2 T
HE ANCESTOR OF FERNS AND SEED PLANTS HAD2
DIVERGENTMIKC*
GENES THAT CAN FORM HETERODIMERS...33
4.3 A
NGIOSPERMS EVOLVED2
KINDS OFS-
CLADE GENES...34
4.4 B
RYOPHYTE AND LYCOPHYTEMIKC*
GENES SHARE CHARACTERISTICS WITH THOSE OF FERN AND ANGIOSPERMS...35
4.5 H
OW IS COMPLEMENTATION OF THE IN VITRO POLLEN GERMINATION DEFECT ACCOMPLISHED? ...35
4.6 MIKC*
GENES FROM DIFFERENT VASCULAR LINEAGES ARE ABLE TO PERFORM THE SAME FUNCTION INA
RABIDOPSIS...37
4.6.1 Can Oryza MIKC* proteins rescue the Arabidopsis double mutant phenotype through 2 distinct types of interactions? ...37
4.6.2 Lessons from a non-complementing Eschscholzia MIKC* gene ...38
4.6.3 Ceratopteris MIKC* proteins are too divergent to substitute for Arabidopsis MIKC* proteins ...39
4.6.4 Selaginella MIKC* genes have conserved properties that allow them to function in Arabidopsis...40
4.7 W
HAT MAKES ANMIKC*
GENE? ...42
4.8 O
N THE EVOLUTION OF THE FUNCTION OFMIKC*
GENES...44
5 CONCLUSION ...47
6 LITERATURE CITED...48
SUPPLEMENT...53
EIDESSTATTLICHE ERKLÄRUNG ...71
ACKNOWLEDGEMENT ...72
CURRICULUM VITAE ...73
I
NTRODUCTION1 Introduction
1.1 On the alternation of generations during land plant evolution
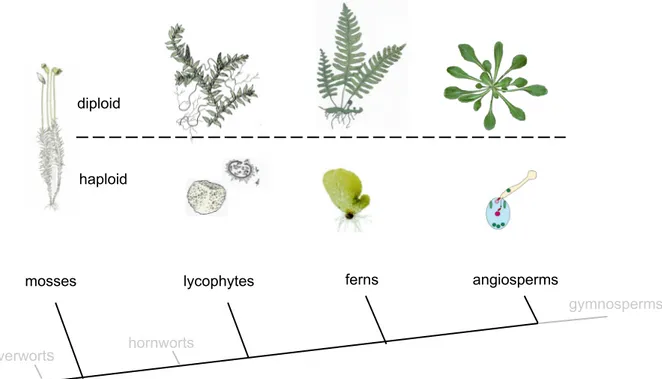
All land plants have in common that their life cycle consists of two alternating generations: the diploid sporophyte that produces the spores and the haploid gametophyte that produces the sperm and egg cells. In charophycean algae, which share the most recent common ancestor with land plants, the sporophytic phase consists of a single cell, the zygote, which is the direct product of fertilization. Also in land plants a zygote is formed but in contrast to the charophytes, these zygotes divide mitotically and form an embryo (reviewed in Graham 1996). This trait has provided the land plants with the name embryophytes.
All land plants have both multicellular gametophytes and sporophytes but in different plant lineages they differ in size and complexity (figure 1). The most basal land plants, the bryophytes, have a dominant gametophyte. The gametes of bryophytes are
Figure 1. Different sporophytes and gametophytes from a selection of land plants. Bryophytes (liverworts, mosses and hornworts) have a dominant haploid phase. In vascular land plants the gametopyhte is not dominant and the diploid sporophyte is more complex than the haploid generation. Sizes are not proportional (Adapted from Raven (1992) and www.C-fern.org).
diploid
haploid
mosses lycophytes ferns angiosperms
hornworts liverwort
s
gymnosperms
I
NTRODUCTIONproduced in specialized organs of the haploid phase. Archegonia are the sites where egg cells are produced and fertilization occurs. Motile sperm cells are produced by the antheridia and need water as a medium to reach the eggs. Apart from this task, the haploid phase also provides nutrition for the embryo and the mature sporophyte into which it develops.
Approximately 350-400 million years ago plants evolved that did not have a dominant haploid but a dominant diploid phase. The new body plan of the sporophyte was characterized, among many other innovations, by the presence of vascular tissue and showed a high complexity (Kenrick and Crane, 1997). Although the sporophyte of vascular plants is referred to as dominant, it must be remarked that it is still dependent upon the gametophyte in the first stages of embryo development.
The first vascular plant group to appear of which the descendants still exist today, are the lycophytes. They use spores as a means of dispersal, a trait that is also found in ferns and their allies. The production of drought tolerant spores is a basal feature that was inherited from their bryophyte-like ancestor. Despite the common ancestry, the gametophytes that develop out of the spores of these early vascular land plants are, compared to those of bryophytes, very reduced and have as primary task “only” the production of gametes.
The gametophytes of angiosperms, flowering plants, can be seen as even more reduced. However, in the lineage leading to the seed plants (angiosperms and gymnosperms) also some novelties evolved. Perhaps the most important is that the male gametophyte (pollen) produces sperm cells that have no flagella, in contrast to the sperm cells of all non-seed plants. Sperm cells are delivered to the female gametophyte, in angiosperms called the embryo sac, by the pollen tube. As a consequence, seed plants are not dependent upon water for the fertilization process, which probably added to their success during evolution.
1.2 MADS-box genes are important for the angiosperm body plan
Evolution of the body plan is tightly linked to the evolution of transcription factors
controlling the developmental programs that guide the proper ontogeny (reviewed in
Theissen et al. 2000). For the evolution of land plants, it has been noted that a
positive correlation can be seen between the complexity of the sporophytic
I
NTRODUCTIONet al. 2004). For example, Arabidopsis has 107 MADS-box transcription factors (Parenicova et al. 2003) while there are only 20 known from the moss Physcomitrella patens (Rensing et al. 2008). However, the relation between the increased number of MADS-domain transcription factors and the complexity of angiosperms is not clear.
Did the rise in the number of MADS-domain transcription factors precede the increase in complexity or was it an effect? As in many organisms, the architecture of flowering plants is characterized by its modularity. For example, and most strikingly, the organs of the flower, from sepal to carpel are all thought to be modified leaves (reviewed in Theissen et al. 2000). The study of MADS-box genes that control organ identity has provided a lot of insight into how the flower body evolved and is being built (Sommer et al. 1990, Coen and Meyerowitz 1991, Theissen and Saedler 2001).
However, the flower is a relatively recent innovation, and studying MADS-domain transcription factors in this derived organ might not be sufficient to gain understanding into how MADS-box genes and plant developmental programs co- evolved. Furthermore, knowledge about ancestral functions and molecular features that made MADS-box genes important determinants of development is possibly easier to obtain within another context and might prove to be fundamentally different from what is currently known.
1.3 MIKC* transcription factors are important for the development of the Arabidopsis male gametophyte
MIKC* proteins are very similar to the so-called classical MIKC (MIKC
c) MADS- domain transcription factors that are well known for their roles in floral development.
“MIKC” indicates the modular structure of both groups of proteins, which consists of
4 domains, namely, the MADS-domain (M) that functions in DNA binding and
dimerization; the intervening domain (I) separates the MADS-domain from the K-
domain and specifies dimerization (Riechmann and Meyerowitz 1997); the Keratin-
like domain (K) has homology to the coiled-coil domain of Keratin (Ma et al. 1991)
and functions in protein-protein interaction (Davies et al. 1996); the C-terminal (C)
domain is involved in transcription activation and in higher order complex formation
(Honma and Goto 2001, Theissen and Saedler 2001, Tonaco et al. 2006, Melzer and
Theissen 2009). It has been reported that the most prominent differences between
I
NTRODUCTIONregularly spaced hydrophobic residues in the K-domain and a more sophisticated exon-intron structure than the (classical) MIKC
cMADS domain proteins. (Henschel et al. 2002; Parenicova et al. 2003; Riese et al. 2005 and Tanabe et al. 2005).
MIKC* transcription factors were first discovered in the moss Physcomitrella patens (Physcomitrella), which has a dominant gametophytic phase (Henschel et al. 2002).
Not long afterwards, they were also recognized in Arabidopsis thaliana (Arabidopsis) (Kofuji et al. 2003). In Arabidopsis the MIKC* MADS-domain transcription factor family consists of 6 members, which can be subdivided in two monophyletic subgroups designated as “S” and “P” (Nam et al. 2004). MADS- domain transcription factors bind to DNA as dimers and for Arabidopsis MIKC*
proteins it was demonstrated that only heterodimers consisting of a member of each phylogenetic subclade exist (Verelst et al. 2007a). Five of the 6 Arabidopsis MIKC*
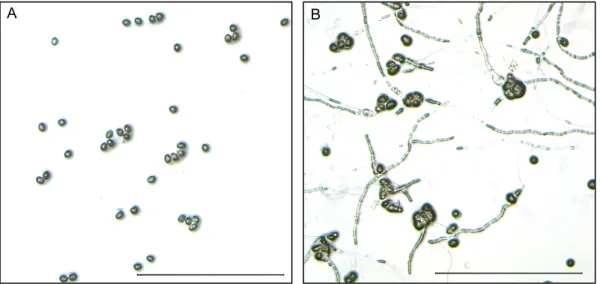
genes are expressed in pollen. Mutant analysis has shown that the members of each clade are highly redundant and a strong phenotypic aberration only becomes apparent when loss-of function alleles are combined. Double and triple mutants produced by W. Verelst (Verelst et al. 2007b) showed an in vitro pollen germination defect (exemplified in figure 2). Subsequent microarray analysis revealed that the
Figure 2. Comparison between the in vitro pollen germination of wild type pollen and MIKC*
double mutant pollen. (A) Pollen from the Arabidopsis double mutant agl66/104-1 shows no germination after incubation on pollen germination medium. (B) Wild type pollen is able to germinate and pollen tubes can be seen that extend from the pollen grains. Scale bar indicates 500µm.
A B
I
NTRODUCTIONtranscription of more than 1300 genes, of roughly 7000 expressed genes, is affected in triple mutant pollen. Furthermore, the analysis showed that MIKC* complexes repress immature pollen genes and activate mature pollen genes during development.
Adamczyk and Fernandez (2009) confirmed these results by using mutants with stronger loss-of function alleles. Additionally, they convincingly showed that the stronger mutant has defects in pollen tube formation in vivo, which ultimately led to a decrease in seed set. Pollen grains consist of 3 cells, two sperm cells and a larger vegetative cell that contains the sperm cells and will form the pollen tube. No evidence has been found that sperm cells are affected in MIKC* mutants nor that MIKC* proteins are expressed in sperm cells (Borges et al. 2009). Taken together, it can be concluded that recently a lot of evidence has accumulated that underlines the importance of MIKC* transcription factors for the development of the male gametophyte (pollen) of Arabidopsis. Therefore, it was decided to investigate the putatively gametophyte specific MIKC* MADS-domain transcription factor family in different vascular land plant lineages. Moreover, clues about the evolution of the gametophyte body plan and the function(s) that MIKC* proteins fulfilled during evolution, which are currently hardly understood, may become apparent.
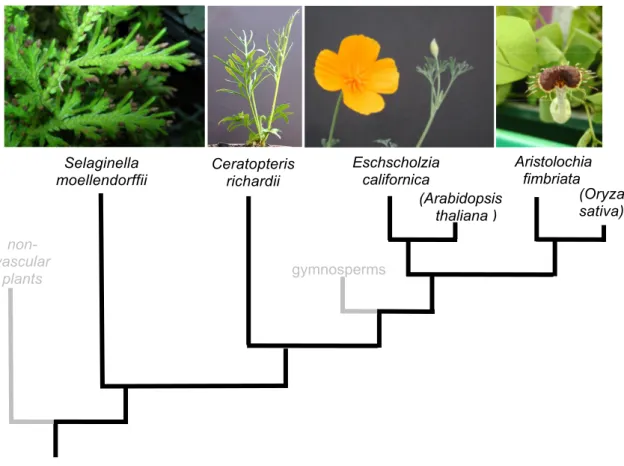
Here will be described how MIKC* genes were isolated out of a broad selection of vascular land plants (see figure 3). Selaginella moellendorffii (Selaginella) was chosen as a representative of the lycophytes, a plant clade that diverged from other vascular plants around 400 million years ago and is the most basal vascular plant lineage (Weng et al. 2005). The fern Ceratopteris richardii (Ceratopteris) was chosen in the monilophyte clade, which is the group of plants considered to be most closely related to seed plants (Pryer et al. 2001). For the seed plant clade only representatives of angiosperms were selected, namely the monocot Oryza sativa (Oryza), the basal eudicot Eschscholzia californica (Eschscholzia) and the basal angiosperm Aristolochia fimbriata (Aristolochia). Sequence comparison combined with a phylogenetic approach and protein-protein interaction analysis is used to describe how the proteins have diversified during evolution. Furthermore, a subset of MIKC*
proteins from the different plant lineages mentioned above were tested for their
ability to complement an Arabidopsis MIKC* mutant. Together with expression data
the point will be made that all MIKC* proteins share the same, conserved, function.
M
ATERIALS ANDM
ETHODS2 Material and Methods
All procedures described below were performed by the author. Transgenic Arabidopsis plants expressing PPM3, PPM4, AGL15, AGAMOUS and MEF2A were produced in cooperation with W. Faigl (MPIZ Cologne).
2.1 Plant materials and cultivation
Arabidopsis thaliana agl66/104-1 double mutant plants were kindly provided by W.
Verelst, who described them in Verelst et al. 2007b. The agl66/104-1 double mutant plants are homozygous for the T-DNA insertions from SALK line 098698 (agl104-1) and SALK line 072108 (agl66). Arabidopsis plants were grown in a greenhouse at 22ºC in long day conditions (16 hours light, 8 hours dark).
For the study of MIKC* transcription factors, model species were chosen that represent different vascular plant lineages and that are also easy to culture.
Furthermore, for Oryza and Selaginella the genome sequence was available.
Eschscholzia californica seeds were donated by Andrea Scholz and Stefan Gleissberg (University Mainz) and grown in similar conditions as Arabidopsis.
Aristolochia fimbriata seeds were obtained from Christoph Neinhuis (TU Dresden) and grown in long day conditions in a standard greenhouse at 22-26ºC.
Selaginella moellendorffii plants were acquired from Plant Delights Nursery, Inc., Raleigh, NC and grown in long day conditions under a cover to create a moist environment and under the canopy of larger plants to reduce light intensity.
Ceratopteris richardii strain Hn spores were obtained from William Martin and are described in Scott and Hickock (1987). Spores were sterilized for 20’ in a 0.875 % (w/v) NaOCl solution, washed 3 times with sterile water and imbibed for one day.
Then the sterilization procedure was repeated and spores were dispersed on solid
M
ATERIALS ANDM
ETHODSmedium consisting of 2.2 g l
-1MS salt with vitamins (Duchefa, Haarlem, The Netherlands) supplemented with 30 g l
-1sucrose, 2.7 ml of a chelated iron solution (Hickock et al. 1997) and 9 g l
-1agar. The pH was adjusted to 5.9 using KOH.
Gametophytes were cultured at 29ºC under a light regime of 18 hours of light and 6 hours darkness and a humidity of 95%. After 2 weeks gametophytes were collected for RNA preparation.
2.2 Identification of MIKC* sequences in model species
The TIGR rice genome annotation sequence database release 5 (available at www.gramene.org) and the assembled trace files of Selaginella moellendorffii (http://moss.nibb.ac.jp, sequencing performed by the DOE Joint Genomic Institute) were screened for putative MIKC* genes using a tblastn search (Altschul et al. 1997)
(Arabidopsis thaliana ) non-
vascular plants
Ceratopteris richardii
Eschscholzia californica Selaginella
moellendorffii
(Oryza sativa) Aristolochia fimbriata
gymnosperms
Figure 3. A simplified phylogenetic tree showing the evolutionary relationship between the
model species used in this study.
M
ATERIALS ANDM
ETHODSwith AGL30 and AGL66 as a query. To look for already available MIKC* genes in the other model species used here, a similar, species-specific search was performed against the plantGDB DNA and RNA collection (www.plantGDB.org).
2.3 Cloning of MIKC* sequences
MIKC* genes were expected to be expressed in gametophytic tissues. Therefore, RNA was extracted from angiosperm male gametophytes (pollen), a mixture of male and hermaphroditic Ceratopteris richardii gametophytes and the strobili of Selaginella moellendorffii, which are cone-shaped organs that carry the sporangia and harbour the developing gametophytes. Plant material for RNA extraction was harvested at identical time points and grinded using liquid nitrogen. Total RNA was extracted using the RNeasy Plant Mini Kit (www.qiagen.com). Subsequently, cDNA pools were created using the Superscript II Reverse Transcriptase kit (www.invitrogen.com) with an oligo d(T)-anchor primer from the 2
ndgeneration 5’/3’ RACE kit (www.roche.com). DNA was extracted using the DNeasy Plant Mini kit (www.qiagen.com).
MIKC* cDNAs that were already identified in the database were amplified using (nested) PCR and primers based on the putative 5’ and 3’ UTRs. A list of primers can be found in supplemental table S1.
Nested PCR with degenerate primers and Apliqon taq polymerase (www.ampliqon.com) was used to search for new MIKC* cDNAs from Ceratopteris, Eschscholzia and Aristolochia. Primers were designed in conserved parts of MIKC*
proteins at positions that differed from classical MIKC
cMADS domain proteins. The partial cDNAs obtained from degenerate PCRs were completed using the 5’/3’
RACE kit, 2
ndgeneration (www.roche.com).
All full-length cDNAs and genomic loci were amplified with the proofreading
enzyme Primestar HS DNA Polymerase (www.takara.com) and cloned in the pGEM-
M
ATERIALS ANDM
ETHODST-Easy Vector System (www.promega.com). All MIKC* cDNA sequences were verified against an independent second clone or the genomic locus.
2.4 Phylogenetic analysis of MIKC* sequences
A tblastn search (Altschul et al. 1997) was performed against the NCBI nr/nt database and the expressed sequence tags database (http://www.ncbi.nlm.nih.gov) using the MIKC* proteins AGL30 and AGL66 of Arabidopsis as a query. To obtain a dense taxon sampling searches were performed separately against all the orders of angiosperms plus all gymnosperm, fern and allies, hornwort, liverwort and streptophyte algae sequences. For the orders Brassicales and Poales, only the sequences of Arabidopsis thaliana and Oryza sativa were used, respectively. Putative positive hits were identified based on the presence of conserved peptide motifs in the MADS-domain. The total collection of sequences that were used for making an alignment consisted of the derived peptide sequences of all plantGDB-assembled unique transcripts (www.plantGDB.org) that corresponded to the cDNAs identified by the BLAST search and that coded for at least the M-, I- and K-domain. That dataset was supplemented with the proteins sequences derived from all the MIKC*
genes that were isolated in this study, 5 of the 11 MIKC* genes from Physcomitrella
patens, 11 classical MIKC
cgenes from a broad range of land plants and 2 MIKC
cgenes from streptophyte algae. Preliminary alignments were made by Clustal W
using the BLOSUM30, PAM350 and MD350 matrices with an open gap penalty of
10 and an extend gap penalty of 0.01 for the pairwise alignment and an 0.05 extend
gap penalty and 40% divergence delay for the multiple alignment. Alignments using
the BLOSUM30 matrix were further manually optimized, gaps were removed and the
MADS-domain and parts of the I- and K-domain were used for phylogenetic analysis
using the neighbour joining method. Bootstrap values were calculated from 2000
repeats. All phylogenetic analyses were performed using the MacVector 7.2.3
software package (http://accelrys.com).
M
ATERIALS ANDM
ETHODS2.5 Expression study of Selaginella moellendorffii MIKC* genes using quantitative real-time PCR
Selaginella moellendorffii total RNA was extracted as described for cloning of MIKC* sequences. Real-time quantitative PCR (qPCR) primer pairs were designed such that at least one of each pair crossed an exon junction, except for 6- phosphogluconate dehydrogenase (6PGD), which is encoded by a single exon.
Expression data was normalized using 6PGD, which has been used previously for semiquantative analysis in Selaginella remotifolia (Tanabe et al. 2003), and the homologs of the Arabidopsis genes PDF1 and At5g46630, which code for the 65 kDa regulatory subunit of protein phosphatase 2A and a subunit of the clathrin adapter complex, respectively. The latter two genes have been reported to be superior reference genes in Arabidopsis (Czechowski et al. 2002). Quantitative real time PCR was performed on an iQ5 Real Time PCR Detection System (www.bio-rad.com) with a cycling protocol of: 2’ 50°C, 10’ 95°C and 40-50 cylces of 15’’ 95 and 1’ 60°C.
Each reaction contained 12.5 µl 2x IQ SYBR premix (www.bio-rad.com), 10 µl template and 200nM of primers in a final volume of 25µl. Melting curve and data analyses were performed using the Bio-Rad iQ5 Optical System Software. Primer efficiencies were determined from dilution curves on cDNA mixtures from all tissues using the Pfaffl method (Tichopad et al. 2003). Following analyses, PCR products were checked on 2.5% agarose gels.
2.6 Yeast-2-hybrid MIKC* interaction study
The full length coding sequences of all isolated MIKC* genes were cloned in the
pGADT7 prey and pGBKT7 bait vectors (www.clontech.com), which carry the
LEU2 and TRP1 nutritional markers, respectively, using NcoI and BamHI restriction
sites. For all Oryza and Eschscholzia MIKC* bait constructs and the SmMADS3 bait
construct strong autoactivation was observed. For each bait protein fusion, one or 2
different C-terminal deletion constructs were produced. Primers used for cloning can
be found in supplemental table S1.
M
ATERIALS ANDM
ETHODSPer species all combinations of bait and prey vector were cotransformed in yeast strain Saccharomyces cerevisiae AH109 according to the Matchmaker GAL4 Two- Hybrid System 3 protocol (www.clontech.com). Cotransformants were selected on synthetic dropout medium lacking Leu and Trp (SD/-L/-W). To test for interactions, single yeast colonies from the SD/-L/-W selection were grown in liquid SD/-L/-W medium and a spot dilution assay was performed on solid synthetic dropout medium lacking the amino acids Leu, Trp and Ade (SD/-L/-W/-A). To validate interactions and test relative interaction strength, a non-lethal ß-galactosidase assay was performed as described by Duttweiler (1996).
2.7 Transformation of Arabidopsis
All MIKC* protein coding sequences isolated here were cloned in binary vector pGJ2364 that contains the first upstream 1555 bp of the AGL65 promoter fused to GFP (kindly provided by W. Verelst, MPIZ, Cologne). For cloning purposes, position –1 and –2 of the AGL65 promoter had been substituted in cytosine residues.
In addition, also constructs were prepared that contained the coding sequences of the MIKC* genes PPM3 and PPM4 of Physcomitrella patens (kindly provided by Daniela Liebsch, MPIZ, Cologne), the classical MIKC
cgenes AGAMOUS and AGL15 from Arabidopsis thaliana (kindly provided by Richard Immink, Plant Research International, Wageningen) and the human MADS-domain protein MEF2A (kindly provided Andrew D. Sharrocks, University of Manchester, Manchester).
Coding sequences without the stop codon were cloned into pGJ2364 digested with
NcoI to obtain a C-terminal GFP fusion. Inserting the complete CDS in pGJ2364
digested with NcoI and BamHI, which were used to excise the GFP tag, produced
non-GFP constructs. Constructs were introduced in Agrobacterium strain GV3101 or
ABI using electroporation (Koncz and Schell, 1986, Koncz et al. 1984) and then in
Arabidopsis agl66/104-1 double mutants using floral dipping (Clough and Bent,
1998). A nos-bar cassette in pGJ2364 allowed for selection by spraying with
BASTA.
M
ATERIALS ANDM
ETHODS2.8 Selection of transgenic plants
After screening with BASTA, putative transgenic plants (generation T1) were genotyped. DNA was extracted using the Plant DNeasy Mini kit (www.qiagen.com) and PCRs were performed to confirm the presence of the transgene. Each line was also tested for the presence of the SALK T-DNA integrations in the AGL66 and AGL104 loci using a primer in the left border of the T-DNA and a gene specific primer. Additionally, the absence of the wild type loci was confirmed by PCR with primers flanking the SALK T-DNA insertions and an elongation time such that wild type loci could be amplified but not the longer T-DNA inserted loci.
To obtain putative single copy integration lines for the heterologous MIKC* genes, a qPCR approach was designed. One primer pair was targeted against a part of the promoter of AGL65 that is also used in the binary constructs and another primer pair against a single copy gene to normalize for the DNA input in the qPCR reaction. In this way the number of inserted transgenes could be derived from subtracting the number of native AGL65 promoters in the Arabidopsis genome, which is 2, from the number derived from the qPCR data. Further, the same procedures as for expression analysis were used with the exception that primer efficiencies were based on qPCR from dilution series of genomic DNA. Unfortunately, the qPCR method proved to be practically unsuited for isolating single copy lines, as described in the results, hence, single integration lines were chosen based upon the pollen fluorescence patterns of segregating T2 lines.
2.9 In vitro pollen germination assays
At first, transgenic lines were screened qualitatively in the hemizyous T1 generation for enhanced pollen germination. Lines that showed complementation were selected for a quantitative in vitro pollen germination assay in homozygous T3 plants. For the germination test, pollen was incubated on germination medium for one day in a moist germination chamber at 22°C as described by Boavida and McCormick (2007).
Pollen from a single flower was transferred to an agarose pad on a microscope slide.
M
ATERIALS ANDM
ETHODSPollen was spread evenly across the surface not using the flower itself but by using a human hair bend in a hairpin shape attached to a toothpick, preventing sporophytic material, which has a positive effect on pollen germination, to hamper the experiment. For each agarose pad at least 2 different areas were examined. All experiments were performed a minimum of 2 times and a total of at least 300 pollen grains were scored for germination using differential interference contrast microscopy. A positive germination call was awarded if a pollen tube was at least as long as the diameter of the pollen grain (Boavida and McCormick 2007).
Germination rates of wild type and agl66/104-1 mutant pollen were compared to the
pollen from the transgenic lines.
R
ESULTS3 Results
3.1 MIKC* genes were identified in all model species
Searching the Oryza database delivered 3 candidate MIKC* loci: Os11g43740, Os08g38590 and Os06g11970, also known as OsMADS68, OsMADS62 and OsMADS63, respectively. In addition, a cDNA corresponding to OsMADS63 was identified (accession number AK111776). The 3 Oryza sativa MIKC* loci identified here are the same as found in a phylogenetic analysis of Oryza and Arabidopsis MADS-box genes performed by Nam et al. (2004). In contrast to Nam et al. (2004) and the findings reported here, Arora and coworkers (2007) communicated that the Oryza genome holds 6 MIKC* MADS-box genes. That conclusion was based upon a study of 3 phylogenetic trees created from alignments of the MADS-domain, the complete protein or the full-length coding sequence of Arabidopsis and Oryza MADS-box genes. A re-examination of their phylogenetic tree derived from an alignment of exclusively MADS-domains, however, clearly showed that the MIKC*
clade included only 3 Oryza MIKC* MADS proteins, the same ones as recognized here. In the other 2 phylogenetic trees by Arora, surprisingly, no other Oryza MADS gene clusters with Arabidopsis MIKC* genes in a monophyletic clade. Therefore, the number of MIKC* genes in Oryza sativa is limited to 3.
In the database of Selaginella moellendorffii another 6 putative MIKC* sequences were found. These most likely represent 3 pairs of alleles, since Selaginella moellendorffii is diploid (Wang et al. 2005) and the cDNA sequences were extremely similar. The genes were designated as SmMADS1, SmMADS2 and SmMADS3 and the corresponding full-length cDNAs were cloned.
For Ceratopteris richardii the search at PlantGDB delivered one expressed sequence
tag (accession number BE643398) coding for a partial putative MIKC* gene
designated as CRM13, continuing already existing nomenclature. Another 3 new
MIKC* genes (CRM14, CRM15 and CRM16) were found by PCR using degenerate
primers. For all sequences, full-length cDNAs as well as the genomic loci were
amplified. Efforts to amplify the genomic locus of CRM16 were not successful.
R
ESULTSFor Aristolochia fimbriata and Eschscholzia californica no MIKC* sequences were found in the databases. PCRs with degenerate primers yielded 2 MIKC* genes for each species. The Eschscholzia californica MIKC* genes were designated as EcMADS1 and EcMADS2 and the corresponding full-length cDNAs were amplified.
Only the locus of EcMADS1 could be isolated as a continuous sequence. For EcMADS2, 3 overlapping fragments were amplified that cover the whole locus. Since the DNA template was from a pool of individuals it is unsure whether the assembly of the 3 fragments represents a naturally occurring locus. For Aristolochia fimbriata, one complete cDNA could be isolated (AfMADS1). Another cDNA (AfMADS2) missed 6 triplets encoding the N-terminal amino acids of the MADS-domain.
Sequencing 2 independent 5’ RACE products retrieved this sequence. Only the locus of AfMADS1 was isolated.
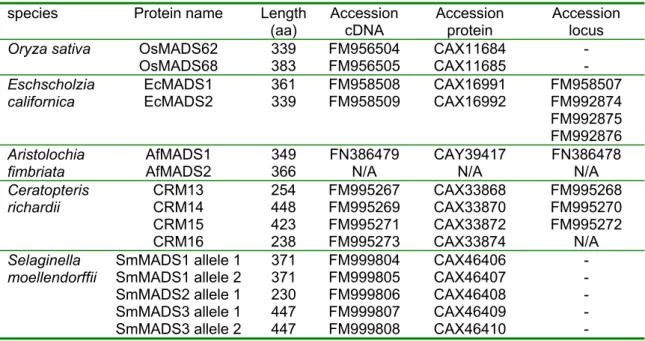
species Protein name Length (aa) Accession
cDNA Accession
protein Accession locus OsMADS62 339 FM956504 CAX11684 -
Oryza sativaOsMADS68 383 FM956505 CAX11685 - EcMADS1 361 FM958508 CAX16991 FM958507
Eschscholziacalifornica
EcMADS2 339 FM958509 CAX16992 FM992874
FM992875 FM992876
AfMADS1 349 FN386479 CAY39417 FN386478
Aristolochiafimbriata
AfMADS2 366 N/A N/A N/A
CRM13 254 FM995267 CAX33868 FM995268 CRM14 448 FM995269 CAX33870 FM995270 CRM15 423 FM995271 CAX33872 FM995272
Ceratopterisrichardii
CRM16 238 FM995273 CAX33874 N/A
SmMADS1 allele 1 371 FM999804 CAX46406 - SmMADS1 allele 2 371 FM999805 CAX46407 - SmMADS2 allele 1 230 FM999806 CAX46408 - SmMADS3 allele 1 447 FM999807 CAX46409 -
Selaginellamoellendorffii
SmMADS3 allele 2 447 FM999808 CAX46410 -
All sequence data from this manuscript has been submitted to the EMBL nucleotide sequence database. An overview of all isolated sequences, nomenclature and protein length can be found in table 1.
Table 1. Overview of the isolated sequences reported in this manuscript. Selaginella and Oryza loci are available from their respective databases.
R
ESULTS3.2 Sequence comparison of the K-domain of MIKC* and MIKC
cgenes reveals an ancient duplication
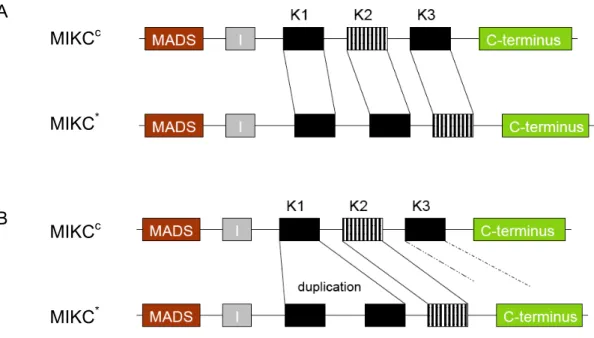
Clustal W analyses with different protein weight matrices all aligned 3 regions C- terminal of the MADS-domain of MIKC* proteins with the K1, K2 and K3 subdomains of the Keratin-like domain of classical MIKC proteins that contain heptad repeats of the hydrophobic residues V, I, L and M (data not shown). A certain similarity of these 3 regions with the MIKC
cK-domain has been noticed before but
the K1-subdomain of MIKC* genes was nonetheless interpreted as elongated Intervening region (Henschel et al., 2002). Although the recognition of the “new” K1 in MIKC* genes has made the number of heptad repeat regions between MIKC* and MIKC
cbecome equal, the order in which they should be aligned is not straightforward. Two types of alignments were produced, which are schematically depicted in figure 4. A benefit of the first alignment (figure 4A is that it has the least gaps, but, there the fact is dismissed that the K2 subdomain of MIKC
cproteins has a much higher homology to K3 of MIKC* genes than to the K2 of MIKC* proteins. In
A
MIKC
cB MIKC
cMIKC
*MIKC
*Figure 4. A comparison of 2 alternative alignments between MIKCc and MIKC* genes with a simplified gene exon-intron structure. Striped boxes have a high homology to each other. (A) depicts the alignment preferred by Clustal W analyses. (B) shows that it is unclear to which MIKC* K- domain the MIKCc K1 region should be aligned.
R
ESULTSthe second alignment (figure 4B the more homologous MIKC
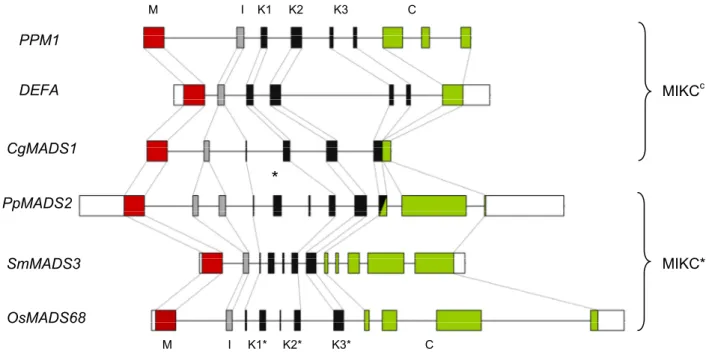
cK2 and MIKC* K3 subdomains are aligned. Naturally, only one of these alignments reflects evolutionary history correctly. When also the exon-intron structure in this region is taken into account, shown in figure 5, it can be seen that the K1 and K2 region of MIKC*
proteins are actually encoded by 4 exons: 2 modules of a smaller and a relatively longer exon. This suggests that a duplication event occurred early in the evolution of MIKC* genes that gave rise to K1 and K2 regions of MIKC* genes.
3.3 Land plants have multiple classes of MIKC* proteins
Unfortunately, the duplication scenario that was launched in the previous section does not offer an answer to the question whether the K1 of MIKC
cproteins should be aligned to the K1 or the K2 region of MIKC* proteins. A phylogenetic tree based on an alignment where these paralogous regions were completely left out, did not result in a tree with high bootstrap support (data not shown). It was therefore opted to make
Figure 5. Comparison of the exon-intron structures of MIKCc and MIKC* genes. UTRs are in white boxes and protein domains in coloured boxes. The asterisk indicates a duplication event. It must be noticed that the third exon of CgMADS1 has been postulated to belong to its I-domain but that the homologous exon in MIKC* genes has been recruited to the K-domain. The half-shaded box in PpMADS2 indicates that homology between MIKCc and MIKC* genes is not recognizable in that exon. Since the lengths of the introns of CgMADS1 have not been published, an arbitrary length of 300 bp has been assigned here. An alignment showing the positioning of the heptad repeat domains is given in supplemental figure S1.)
I K1 K2 K3 C
M
PpMADS2 PPM1 DEFA
CgMADS1
SmMADS3 OsMADS68
MIKC
cMIKC*
*
K2*
I K1* K3* C
M
I K1 K2 K3 C M
R
ESULTS2 different alignments. In the first alignment the MIKC* K1 subdomain was aligned with the MIKC
cK1 and in the second alignment with MIKC
cK2. The latter possibility gave the highest degree of homology (data not shown). Previous authors also preferred this type of alignment (Henschel et al. 2002, Tanabe et al. 2005).
Additionally, the structure within the MIKC*-clade of the tree derived from this alignment did not deviate from the topology of a phylogenetic tree derived from an alignment of MIKC* sequences alone (data not shown).
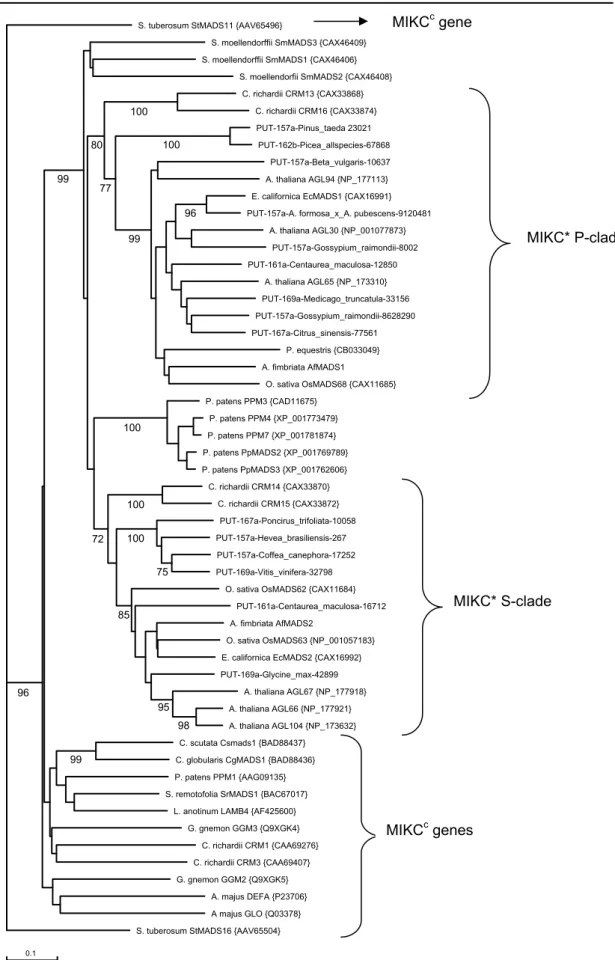
Figure 6 shows the unrooted neigbour joining tree from the alignment of MIKC
cand MIKC* proteins. MIKC* and MIKC
cproteins clearly form 2 separate clades. Within the MIKC* clade, 3 highly supported groups can be observed. One contains the MIKC* proteins of Physcomitrella and the other 2 contain all the MIKC* sequences from Ceratopteris and the angiosperms. Noticeably, the relationship of the MIKC*
proteins of the lycophyte Selaginella moellendorffii, to the other MIKC* sequences or among themselves stayed unresolved. Perhaps a more thorough sampling in the basal land plant lineages, which is at the moment hampered by the lack of available sequences, will clear up that relationship.
The MIKC* genes from ferns and seed plants are found in 2 subclades, which correspond to the S- and P-clade of MIKC* proteins as determined by an analysis of Nam and coworkers (2004) based on Oryza, Arabidopsis and Tobacco MADS-box genes. It can be seen that not all species have representatives in both clades though.
Probably, this is due to the incompleteness of the expressed sequence tag database since representatives from both clades were found in all the model species investigated in this manuscript. Furthermore, if the genomes of all the currently available angiosperms are searched, at least 2, divergent, MIKC* genes can be recognized (data not shown).
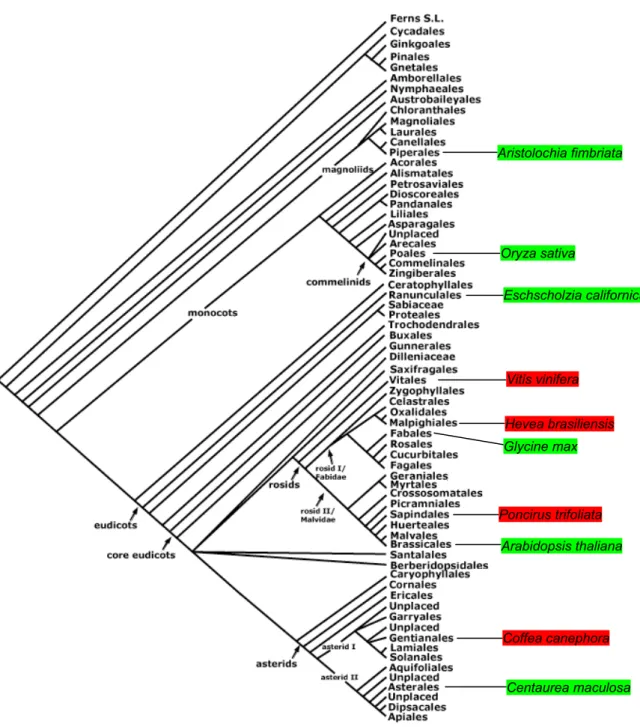
Within the angiosperm S-clade of MIKC* proteins another clear bifurcation is
present. Figure 7 shows how MIKC* sequences from these 2 S-subclades are
distributed across the orders of extant angiosperms. Obviously, no plants were found
that carry both kinds of S-subclade genes. However, plants in similar groups of
angiosperms can possess different S-subclade genes.
R
ESULTS95
S. moellendorffii SmMADS3 {CAX46409}
S. moellendorffii SmMADS1 {CAX46406}
S. moellendorfii SmMADS2 {CAX46408}
C. richardii CRM13 {CAX33868}
C. richardii CRM16 {CAX33874}
PUT-157a-Pinus_taeda 23021 PUT-162b-Picea_allspecies-67868
PUT-157a-Beta_vulgaris-10637 A. thaliana AGL94 {NP_177113}
E. californica EcMADS1 {CAX16991}
PUT-157a-A. formosa_x_A. pubescens-9120481 A. thaliana AGL30 {NP_001077873}
PUT-157a-Gossypium_raimondii-8002 PUT-161a-Centaurea_maculosa-12850
A. thaliana AGL65 {NP_173310}
PUT-169a-Medicago_truncatula-33156 PUT-157a-Gossypium_raimondii-8628290 PUT-167a-Citrus_sinensis-77561
P. equestris {CB033049}
A. fimbriata AfMADS1
O. sativa OsMADS68 {CAX11685}
P. patens PPM3 {CAD11675}
P. patens PPM4 {XP_001773479}
P. patens PPM7 {XP_001781874}
P. patens PpMADS2 {XP_001769789}
P. patens PpMADS3 {XP_001762606}
C. richardii CRM14 {CAX33870}
C. richardii CRM15 {CAX33872}
PUT-167a-Poncirus_trifoliata-10058 PUT-157a-Hevea_brasiliensis-267 PUT-157a-Coffea_canephora-17252 PUT-169a-Vitis_vinifera-32798
O. sativa OsMADS62 {CAX11684}
PUT-161a-Centaurea_maculosa-16712 A. fimbriata AfMADS2
O. sativa OsMADS63 {NP_001057183}
E. californica EcMADS2 {CAX16992}
PUT-169a-Glycine_max-42899 A. thaliana AGL67 {NP_177918}
A. thaliana AGL66 {NP_177921}
A. thaliana AGL104 {NP_173632}
C. scutata Csmads1 {BAD88437}
C. globularis CgMADS1 {BAD88436}
P. patens PPM1 {AAG09135}
S. remotofolia SrMADS1 {BAC67017}
L. anotinum LAMB4 {AF425600}
G. gnemon GGM3 {Q9XGK4}
C. richardii CRM1 {CAA69276}
C. richardii CRM3 {CAA69407}
G. gnemon GGM2 {Q9XGK5}
A. majus DEFA {P23706}
A majus GLO {Q03378}
S. tuberosum StMADS11 {AAV65496}
S. tuberosum StMADS16 {AAV65504}
0.1
MIKC* S-clade
MIKC
cgenes MIKC
cgene
MIKC* P-clade
99
96 80
100
99
100
100 100
75
85
99 100
72
96
98 77
Figure 6. Unrooted neighbour joining tree of MIKC* and MIKCc genes based on the alignment given in supplemental figure S1. Bootstrap values are shown below branches only when support was higher than 70%. Bootstrap support within the Physcomitrella patens subclade is not shown. Accession numbers of
R
ESULTSVitis vinifera
Poncirus trifoliata
Coffea canephora Hevea brasiliensis Oryza sativa
Centaurea maculosa Aristolochia fimbriata
Eschscholzia californica
Glycine max
Arabidopsis thaliana
Figure 7. Distribution of the 2 MIKC* S-sublades over extant groups of angiosperms. Angiosperms species from which the different S-clade genes were isolated are in red and green. The ancestors of the 2 rosid groups Fabidae and Malvidae as well as the ancestor of the asterids must have had 2 types of S-subclade MIKC* genes. Branches of the phylogenetic tree terminate in taxonomic orders. Adapted from the Angiosperm Phylogeny Group website (http://www.mobot.org/mobot/research/apweb/welcome.html).
R
ESULTS3.4 MIKC* genes are expressed specifically in gametophytes (and roots?)
Most of the identified MIKC* expressed sequence tags from the database originated from cDNA collections obtained from tissues that contained gametophytes.
Remarkably, the EST from Beta vulgaris (sugar beet) came from a cDNA library of roots and the one of Pinus taeda (Loblolly pine) from flooded roots. Interestingly, according to the TAIR Arabidopsis eFP Browser (http://www.arabidopsis.org), which is based on microarray expression data, the Arabidopsis MIKC* gene AGL67 is expressed in the root of the embryo.
All the MIKC* cDNAs that were isolated and reported on in this manuscript originated from gametophytic tissues. Only for the model species Selaginella moellendorffii a detailed expression analyses was performed.
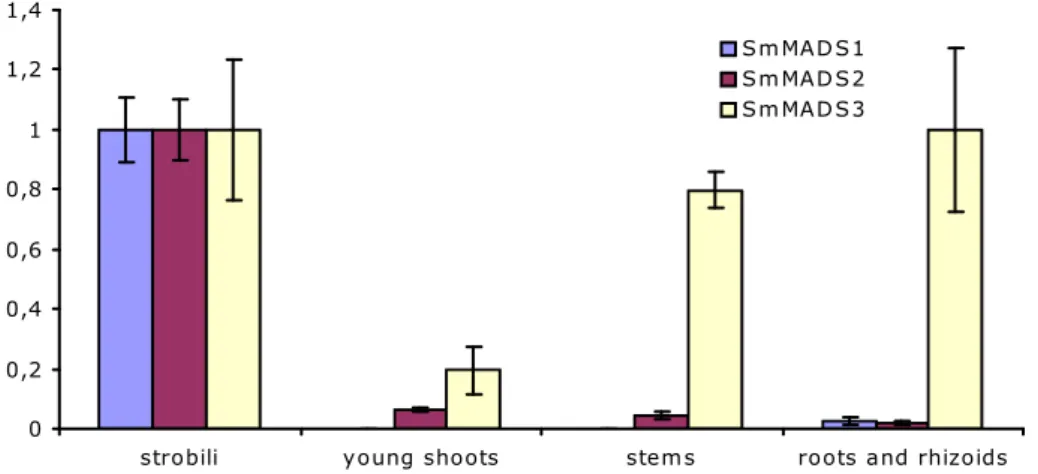
Quantitative real-time PCR was used to determine the relative expression levels of MIKC* genes in different plant tissues of Selaginella moellendorffii. Figure 8 shows that SmMADS1 and SmMADS2 are highest expressed in the gametophyte-containing strobili. SmMADS3 expression was equally high in strobili and roots and rhizoids.
Also, substantial expression of SmMADS3 was detected in young shoots and stems.
Similar expression patterns were found in 3 individual plants for SmMADS1 and SmMADS2. In one out of 3 plants, however, expression of SmMADS3 could not be
0 0,2 0,4 0,6 0,8 1 1,2 1,4
strobili young shoots stems roots and rhizoids SmMAD S1
SmMAD S2 SmMAD S3
Figure 8. Relative expression levels of the Selaginella MIKC* genes obtained by qPCR.
SmMADS1 and SmMADS2 are almost exclusively expressed in strobili. Expression of SmMADS3 is more ubiquitous, and highest in stobili and roots and rhizoids. Bars represent standard deviation.
R
ESULTSdetected in stem tissue, although RNA input and the expression level of reference genes was similar (data not shown).
3.5 MIKC* proteins from different species show variable interactions
MADS-domain proteins need to form dimers to be able to bind DNA and work as a transcription factor. Here, the Y2H system was used to asses which dimeric transcription factor complexes could be functioning in the species from which MIKC* transcripts were isolated. W. Verelst (Verelst et al. 2007a) has shown that Arabdopsis MIKC* dimers always contain one protein of the S- and one protein of
SD/-L/-W SD/-L/-W/-A
OsMADS68 OsMADS62 OsMADS63
empty pGAD
3 days @ 30°C
ß-galactosidase assay
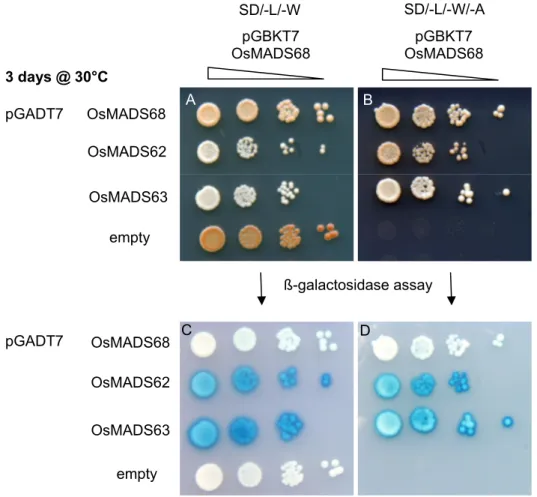
Figure 9. A part of the spot dilution assay performed for Oryza sativa MIKC* proteins. (A) All cotransformants were able to grow on SD/-L/-W medium. (B). Cotransformants with an empty pGADT7 vector showed no growth on SD/-L/-W/-A medium. (C, D) The same yeast colonies as (A) and (B) after a ß-galactosidase assay. A stonger blue colouring indicates a stronger ß- galactosidase activity caused by a strong interaction of the Oryza MIKC*-GAL4 DNA binding and activation domain protein fusions. The complete matrix can be found in supplemental figures S2-S7.
OsMADS68 OsMADS62
OsMADS63 empty pGADT7
A B
D C
3 days @ 30°C
pGADT7
pGBKT7 OsMADS68
pGADT7
pGBKT7
OsMADS68
R
ESULTSFigure 10. Schematic depiction of all tested Oryza sativa fusion protein interactions. A darker colouring of the boxes represents stronger interactions. Homodimers are formed but the heterodimers consisting of S- and P-clade proteins showed the strongest interaction in a ß-galactosidase assay. The complete matrix can be found in supplemental figure S2-S7.
the P-clade. The MIKC* protein interactions of the model species tested below, showed that variations from this strict heterodimerization are common.
3.5.1 Oryza sativa MIKC* protein interactions
Since all the yeast cotransformants were able to grow on selective SD/–L/-W/-A medium it must be concluded that all interactions between the fusions of the Oryza MIKC* proteins with the GAL4 DNA binding and activation domains were possible.
The interactions were not equally strong for all combinations of protein fusions though. This can already be observed in figure 9A and 9B that show growth on SD/- L/-W medium, where there is selected for cotransformants and not for protein
interaction. Some cotransformants show a reddish coloring caused by a low adenine production by the ADE2 selection marker, although there is adenine in the medium.
As expected, the reddest colonies are from a cotransformation with an empty pGADT7 vector, where the activation domain is not fused to any Oryza protein.
From this can be concluded that the activation domain alone probably cannot interact with the DNA binding fusion to drive ADE2 expression and it excludes the possibility for false positives by so-called auto-activation to occur. Indeed, it can be seen in figure 9B that the yeast transformed with the bait fusion construct in
P-clade S-clade
OsMADS68 OsMADS62 OsMADS63
bait
prey
∆262-383 ∆299-383 ∆229-339 ∆266-339 ∆214-360 ∆294-360pGBKT7
OsMADS68 OsMADS62 OsMADS63
pGADT7
R
ESULTSFigure 11. Schematic depiction of Eschscholzia fusion protein interactions. EcMADS2 can form homodimers and EcMADS1 only heterodimers. Darker colouring indicates a stronger interaction.
Original data can be found in supplemental figure S8-9.
combination with the empty prey vector is not able to grow on selective SD/-L/-W/- A medium in contrast to all the other plated cotransformants.
Differences in interaction strength were confirmed by the ß-galactosidase assay as exemplified in figure 9C and 9D. A much stronger ß-galactosidase activity was observed from yeast colonies that harbored heterodimeric MIKC* complexes.
Moreover, when all interactions are taken into account, shown in figure 10, it can be noticed that the strongest interactions occurred when heterodimers were formed between the members of the phylogenetically distinct S- and P-clades. Additionally, homodimers of S- and P-clade protein fusions were observed to show a different interaction strength depending on the length of the C-terminal deletions of the bait.
Interactions tended to be less strong when the C-terminal domain was shorter. This decrease is most notable for the OsMADS63 ∆214-360 fusion, which is not able to homodimerize anymore on SD/-L/-W/-A selective medium (supplemental figure S7).
These results point to a function of the C-terminus in protein-protein interaction for Oryza MIKC* proteins.
3.5.2 Eschscholzia californica MIKC* protein interactions
Figure 11 summarizes the interaction data for Eschscholzia. It can be seen that EcMADS1 can form obligatory heterodimers with EcMADS2. EcMADS2 could also form homodimers. In contrast to the the Oryza interactions, no large differences
P-clade S-clade bait
prey EcMADS1 EcMADS2 pGADT7 EcMADS1
∆ 243-361
EcMADS2
∆203-339
EcMADS2
∆278-339
pGBKT7
R
ESULTSbetween the interaction strength of homo- and heterodimers were observed in the ß- galactosidase assay on SD/-L/-W/-A medium (supplemental figures S8-S9). Also no difference between interactions with the 2 different C-terminal deletion proteins of EcMADS2 could be observed.
3.5.3 Ceratopteris richardii MIKC* protein interactions
In contrast to all other MIKC* proteins tested, fusions of Ceratopteris MIKC* genes with the GAL4 DNA binding domain were not able to (auto) activate ADE2 expression. This made the production of C-terminal deletion constructs unnecessary.
In figure 12, it can be seen that Ceratopteris S-clade proteins cannot form homodimers, unlike the Eschscholzia S-clade protein. The Ceratopteris P-clade proteins do form homodimers and, additionally, are also able to form heterodimers within their own clade, again contrasting the interactions observed for Eschscholzia MIKC* proteins. Heterodimers between S- and P-clade members could also be detected.
P-clade S-clade bait
prey CRM13 CRM16 CRM14 CRM15 pGBK
CRM13 CRM16
CRM14 CRM15 pGBK
Figure 12. Schematic summary of Ceratopteris richardii MIKC* proteins interactions. Darker colouring indicates a stronger interaction.
R
ESULTS3.5.4 Selaginella moellendorffii MIKC* protein interactions
For the Selaginella MIKC* genes phylogenetic analysis did not cluster them in the S- or P-clades, which makes a comparison to the MIKC* genes of the other organisms difficult. All 3 proteins showed a different dimerization behaviour. SmMADS1 could only form heterodimers while SmMADS2 formed homo- and heterodimers, albeit not all interactions could be reciprocally verified and the interaction of SmMADS1 with SmMADS3 was very weak. SmMADS3 further was capable of forming homodimers.
prey
bait SmMADS1 SmMADS2 SmMADS3 pGADT7 SmMADS1
SmMADS2 SmMADS3
∆ 240-447
SmMADS3
∆ 294-447
pGBKT7
Figure 13. Schematic summary of Selaginella moellendorffii MIKC* proteins interactions.
Darker colouring indicates a stronger interaction.
R
ESULTSFigure 14. Relative fold of AGL65 promoters in 6 independent T1 lines transformed with pGJ2364 containing the OsMADS62-GFP fusion under control of the AGL65 promoter. In a diploid wild type genome 2 AGL65 promoters are present, corresponding to a value of 1 on the relative fold promoters axis.
relative fold promoters
26
5,8
55,4
22,9
13,5
4,2
1 0
10 20 30 40 50 60
line 305.2 line 305.3 line 305.5 line 305.6 line 305.7 line 305.8 wild type
3.6 Arabidopsis T1 transgenic lines show high copy numbers
Arabidopsis agl66/104 double mutant plants were transformed with MIKC* genes
from a broad variety of land plants to assess whether the mutant phenotype could be
rescued. Initially, a qPCR strategy was designed to select single copy T-DNA
integration lines in the T1 generation. Single copy lines have the benefit that a
minimum of disturbance due to the integration of the T-DNA in the host genome
occurs and that the expression levels of the transgene is theoretically similar to
expression of the gene of which the promoter was used. In figure 14, it can be seen
that the overall copy number of AGL65 promoters in 6 tested T1 lines was very high
compared to the situation in wild type Arabidopsis. Still, in many of these lines only
half of the pollen was fluorescent, which is characteristic for a single integration site
(data not shown). This indicated that many copies were integrated at the same
position. Because single copy lines were expected to be very rare and selecting them
thus very laborious, single integration lines were chosen for further analysis.
R
ESULTSFigure 15. GFP fluorescence of pollen from the T3 generation of Arabidopsis transformants. (A) Pollen from plants transformed with the AGL66-GFP construct. (B, C) Pollen from the SmMADS3- GFP line 1 and 2 both shows a GFP signal in the vegetative nucleus. The picture in (C) has been taken using a 4x longer exposure time than (B). (D) Arabidopsis pollen that only possessed a promoter-AGL65-GFP fusion showed a signal in the complete cytoplasm of the vegetative cell.
A B
C D
3.7 The pollen germination phenotype of the Arabidopsis agl66/104 double mutant can be rescued by heterologous expression of MIKC* genes from distantly related species
To test the functionality of the AGL65 promoter that was used in the binary vector,
the promoter-AGL65-GFP fusion was transformed in Arabidopsis agl66/104 double
mutants, which have T-DNA insertions in the 2 of the 3 S-clade genes, namely
AGL66 and AGL104. Figure 15 shows that these lines exhibit a strong GFP signal in
the cytoplasm whereas, for example, the pollen of plants that express a protein fusion
R
ESULTSFigure 16. In vitro pollen germination rates of wild type, mutant and complemented Arabidopsis plants. Bars indicate standard error.
of SmMADS3 and GFP, the GFP signal is restricted to the nucleus of the vegetative cell. Also the ovules were checked for a GFP signal but this could not be detected (data not shown), thus indicating that the AGL65 promoter is specific for the male gametophyte.
To test whether it is possible to complement the mutant phenotype using MIKC*
sequences driven by the AGL65 promoter, Arabidopsis double mutants were transformed with a construct containing the Arabidopsis S-clade MIKC* gene AGL66 fused to GFP. Indeed it was possible to rescue the in vitro pollen germination defect of the mutant, in contrast to double mutants that carry only a promoter- AGL65-GFP fusion. Furthermore, the GFP signal from the AGL66-GFP fusions was observed in the vegetative nucleus indicating a proper targeting of the transcription factor (figure 15A). The ability to complement the pollen germination defect was investigated more precisely by a quantitative pollen germination assay. Pollen from 2 independent single integration AGL66-GFP homozygous T3 lines was applied to agarose pads and the number of pollen tubes that developed was counted. In figure
0%
10%
20%
30%
40%
50%
60%
70%
80%
wt
pAGL65-GFP
66/104
AGL 66-GFP line 1
AGL66-GFP line 2
OsMADS63-GFP line 1 OsMADS6
3-GFP line 1
OsMADS68-GFP EcMADS
2-GFP
SmMADS3-GFP line 1
SmMADS3-GFP line 2