A NOVEL OLFACTORY RECEPTOR GENE FAMILY IN TELEOST FISH :
PHYLOGENOMICS , CELLULAR LOCALIZATION AND COMPARISON WITH OTHER
OLFACTORY RECEPTOR GENE FAMILIES
Inaugural-Dissertation zur
Erlangung des Doktorgrades
der Mathematisch-Naturwissenschaftlichen Fakultät der Universität zu Köln
vorgelegt von
Luis Miguel Rodrigues Saraiva aus Manteigas, Portugal
Köln 2008
Berichterstatter: Prof. Dr. S. I. Korsching Prof. Dr. Jens Brüning
Tag der mündlichen Prüfung: 30. Juni 2008
2ERKLÄRUNG
Ich versichere, dass ich die von mir vorgelegte Dissertation selbstständig angefertigt, die benutzten Quellen und Hilfsmittel vollständig angegeben und die Stellen in der Arbeit - einschließlich Tabellen, Karten und Abbildungen -, die anderen Werken im Wortlaut oder dem Sinn nach entnommen sind, in jedem Einzelfall als Entlehnung kenntlich gemacht habe;
dass diese Dissertation noch keiner anderen Fakultät oder Universität zur Prüfungvorgelegen hat; dass sie - abgesehen von den unten angegebenen Teilpublikationen – noch nicht veröffentlicht worden ist, sowie dass ich eine solche Veröffentlichung vor Abschluss des Promotionsverfahrens nicht vornehmen werde. Die Bestimmungen dieser Promotionsordnung sind mir bekannt. Die von mir vorgelegte Dissertation ist von Prof. Dr. S.
I. Korsching betreut worden.
Köln, den 5. Mai, 2008
Teilpublikationen:
• Hussain, A*; Saraiva, LR* & Korsching SI (2008). “Strong positive selection and high intron dynamics in teleost taar genes”. PNAS under revision. *both authors contributed equally to this paper
• Kraemer, AM; Saraiva, LR & Korsching, SI (2008). “Structural and functional diversification in the teleost S100 family of calcium-binding proteins”. BMC Evolutionary Biology, 8:48
• Saraiva, LR & Korsching, SI (2007). “A novel olfactory receptor gene family in teleost
fish”. Genome Research. 17:1448-57
3
„Regozijarme-ei apenas com a diversidade da natureza e deixarei os problemas concretos
para os políticos e pregadores”
Stephen Jay Gould
PARA OS MEUS PAIS,
4
5
I. A
CKNOWLEDGEMENTSThis study was performed in the laboratory of Prof. Dr. Sigrun Korsching in the Institute of Genetics, Cologne, Germany and was supported by a grant from the International Graduate School of Genetics and Functional Genomics (IGS-GFG). I would like to start this section by thanking her first for accepting being my mentor, second for being my “scientific mother” and third for becoming a very good friend. All the encouragement, support, advice and everything else throughout these three and a half years are priceless. Her patience to deal with my “awkwardness” is also treasured ☺
I would also like to acknowledge to Prof. Dr. Jens Brüning and to Prof. Dr. Peter Kloppenburg for accepting to be in my thesis committee, for the interest in my work, nice feedback and for accepting serving as my referees.
Being accepted in the IGS-GFG and to be part of the Class of 2004 made first of all my presence is Germany possible and gave me the chance to learn a lot more outside of the scientific environment. The cultural exchange was and is a great thing and also helped me becoming a better person and scientist. In this context I would like to give a special “Thank You” to Brigitte Wilcken- Bergmann for all the help and support throughout all these years. Thank you again.
Next in line are Leo Kurian, Dale Richardson and Lars Rosvoll (Drs yet to be) for their valuable friendship, motivation, inspiration, patience, company, tripod or bipod moments in India, the Dam, Istambul, Bratislava, Australia, for being my climbing and/or football partners… and for all the other things that would not be wise to mention here. Words are not enough to describe the friendship built during these years.
Also to Yen Yen and Jinu, the “chicks” of the group for all the support, cooking, good and bad moments shared and everything that it is yet to come. Yen
To my lab mates, especially Dr Yuichiro Oka for valuable feedback, help and collaboration in several projects. Also, Andreas Kraemer and Ashiq Hussain and again Yen Yen should be mentioned in this context for the fruitful collaboration and by providing me some of the figures used in this thesis.
To Mehmet, for all the happiness and joy and of course, for being the step father of all our fish. To all of you a very big thank you for the learning experience and moments shared until now.
To all the others that I have met since I arrived in Germany. Just to mention a few: Channa K.C., Cemali, Daniella, Joanna, Rodrigo, Natália, Henrique, Baghi (I am sure I misspelled his name again), Raja, the 4040 crew, Gesa… and all the others.
Also to my very good friends from Portugal: Bruno, João, Diogo, Nuno, Neiva, Graf, Sérgio, Vazé, Yana and the rest of Évora Crew. Ào “Caravela” pelos excelentes momentos passados, apoio e por me ajudarem a matar a saudade de Portugal. To my old colleagues from the IGC for broadening my scientific horizons before I even applied to Cologne.
Last but not least to my family, for everything. They are the main reason why I am here.
Obrigado Pai, Mãe, Marta e Rafa. Mesmo estando fisicamente cada vez mais longe, não me esqueço nem nunca esquecerei de vós. Vocês estão sempre bem junto a mim. Não há palavras para descrever todo o apoio ao longo destes vinte e quase oito anos. Um obrigado cheio de maiúsculas.
Esta tese é vossa também.
6
7
8
II. C
ONTENTSI. Acknowledgements ... 6
II. Contents ... 9
III. Figure List...14
IV. Abstract ...15
V. Zusammenfassung...16
VI. Introduction...18
A. The olfactory system ...18
1. The rodent olfactory system...18
2. The teleost fish olfactory system...19
3. Ciliated versus microvillous sensory neurons ...19
4. Crypt sensory neurons ...20
B. The olfactory receptor gene family repertoire and its evolutionary dynamics...22
1. Olfactory receptors...22
2. Vomeronasal receptors ...23
3. V2Rs...24
4. V1R ...24
5. TAAR receptors...25
C. Olfactory signaling transduction ...26
D. Aims: ...28
VII. Results ...29
A. Ora family ...29
1. Four novel V1R-like genes were identified in each of five teleost species ...29
2. The ora genes form a single clade together with mammalian V1Rs ...30
3. Ora family size in jawless and cartilaginous fish close to that of teleost fish...31
4. Low overall similarity but high degree of conservation for motifs characteristic for mammalian V1Rs...33
5. ora genes precede teleost speciation with an early origin in jawless fish...34
6. Gene loss and gene gain upon transition to tetrapods ...35
7. Strong negative selection for ora genes, but no evidence for positive selection ...37
8. Mono and multiexonic gene structures are present in the ora family ...40
9. Evolutionary history of intron gains in the teleost ora gene family...41
10. Four ora genes are arranged in closely linked gene pairs in head-to-head and tail-to-tail orientation...44
11. Loss of linked gene pair in frog concurrent with rapid expansion in the ora1-ora2 clade.45 12. Specific expression of all ora genes in the adult olfactory epithelium...45
13. In the embryo, ora genes show broader expression including but not limited to the olfactory placode ...47
14. Monogenic rule of expression valid within the ora gene family...49
B. TAAR family ...54
1. TAAR genes are monophyletic and segregate from the monophyletic group of aminergic GPCRs ...54
9
2. Species-specific expansions of individual TAAR genes into subfamilies is a recurrent
theme in all five teleost species examined...55
3. Taar genes originate in the common ancestor of cartilaginous and bony fish...57
4. Signatures of positive selection in teleost taar genes are masked by global negative selection ...58
5. Teleost taar genes exhibit more diverse genomic location than tetrapod and avian taars 60 6. Most taar genes are expressed in sparse olfactory sensory neurons ...60
C. Molecular characterization of OSN subtypes with respect to receptors, G-proteins and s100 calcium binding proteins...62
1. Crypt cells are detected in the apical region of the lamella of adult zebrafish olfactory neuroepithelium...62
2. Crypt cells are detectable by immunoreactivity already three days post fertilization...64
3. S100Z is specifically expressed in the olfactory placode...66
4. Spatial pattern of s100z and S100 antibody labeling are markedly similar ...67
5. ora genes deorphanize crypt cell neurons ...69
6. ora genes maintain exclusiveness towards other olfactory receptor gene families...72
7. ora genes co-express with Gαi and Gαo, consistent with signal transduction via these G- proteins...74
VIII. Discussion ...77
A. Ora family ...77
1. Ora genes constitute the fish homolog olfactory receptor gene family to the mammalian V1Rs 77 2. Ora genes display an extreme degree of negative selection among olfactory receptor gene families ...77
3. Evolutionary origin and dynamics of the Ora family in fish ...78
4. Frog Ora genes at a transition point between Ora and V1R evolution ...78
5. Intron gains in the Ora gene family ...80
6. Genomic linkage of ora-gene pairs ...81
B. TAAR family ...82
1. Origin and delineation of the TAAR gene family from the classical aminergic receptors .82 2. Massive radiation of an olfactory receptor gene family only in teleost fish ...82
3. Unprecedented level of positive selection in an olfactory receptor gene family ...83
4. Taars as olfactory receptor genes...83
5. Taars and ora gene families constitute two opposite ends of the “olfactory gene repertoire spectrum” ...84
C. Cellular and molecular properties of crypt cells and ora receptors...84
1. The s100 gene family might contain a crypt cell molecular marker ...84
2. An hypothesis about the functional role of s100 genes in the olfactory epithelium ...85
3. Deorphanization of crypt neurons and their putative functional role...86
4. Monogenic expression of ora genes ...87
5. G-proteins and cell type ...88
6. G-proteins and Ora receptors ...89
D. Conclusion and outlook...89
IX. III. Material and Methods...92 10
A. Biological Materials ...92
1. Animals...92
2. Bacterial Strain ...92
B. Chemicals and Supplies...92
1. Enzymes...93
2. Nucleotides...93
3. Plasticware ...93
4. Preparation of Solutions...93
C. Plasmids and Vectors/Properties ...94
D. Oligonucleotide Primers ...94
E. Primary Antibodies ...95
F. Secondary Antibodies ...95
G. Dyes, Substrates, Embedding Media and Counterstains ...95
1. Alkaline Phosphatase Substrates ...95
2. Horseradish Peroxidase Substrates ...96
3. Embedding Media ...96
4. Dyes and Counterstains...96
H. Equipment ...96
I. Molecular Biological Techniques...96
1. Isolation, Purification and Quantification of DNA and RNA ...97
2. Enzymatic Modifications of DNA...98
3. Isolation of DNA Fragments from PCR products or Agarose Gels ...99
4. Labeling of RNA Using Digoxigenin, Biotin or Fluorescein by In Vitro Transcription...99
5. Subcloning of DNA Fragments...100
6. Synthesis of DNA ...101
7. Sequencing of DNA...101
J. Histological Studies...102
1. Preparation of Coverslips...102
2. Tissue Preparation and Sectioning ...102
3. Cryosectioning...102
K. Immunohistochemistry (IHC)...102
1. Antibody Staining on Fresh Frozen Cryostat Sections ...102
L. In Situ Hybridization (ISH)...102
1. In Situ Hybridization on Sections of Olfactory Epithelia ...103
2. Fluorescent In Situ Hybridization (FISH) on Sections of Olfactory Epithelia ...103
3. Whole Mount In Situ Hybridization of Embryos...103
M. Double Labeling Experiments ...103
1. In Situ Hybridization and Antibody Staining ...103
2. Double In Situ Hybridization...103
N. Data mining ...104
1. V1r...104
2. Taar ...105
11
O. Phylogenetic analysis...105
P. dN/dS analysis ...106
Q. In silico prediction of ora coupling specificity to G-proteins ...107
X. References ...108
XI. Apendix ...116
A. Abbreviations...116
B. Supplemental figures ...117
XII. Curriculum Vitae...120
12
13
III. F
IGUREL
ISTFigure VI-1 | The location of chemosensory organs in the mouse and teleost fish.--- 1
Figure VI-2 | Two Intracellular Signaling Cascades Implicated in Chemosensory Transduction--- 1
Figure VII-1 | Phylogenetic tree of the fish Ora family --- 1
Figure VII-2 | Conserved sequence motifs of the Ora family.--- 1
Figure VII-3 | Estimated minimal evolutionary age of Ora clades and genes. --- 1
Figure VII-4 | Identity, similarity, and conservation level of the ora genes.--- 1
Figure VII-5 | Sites under positive and negative selection in ora coding sequences.--- 1
Figure VII-6 | Genomic structure and intron dynamics of the 28 fish ora genes.--- 1
Figure VII-7 | Genomic arrangement of the ora1-ora2 and ora3-ora4 gene pairs. --- 1
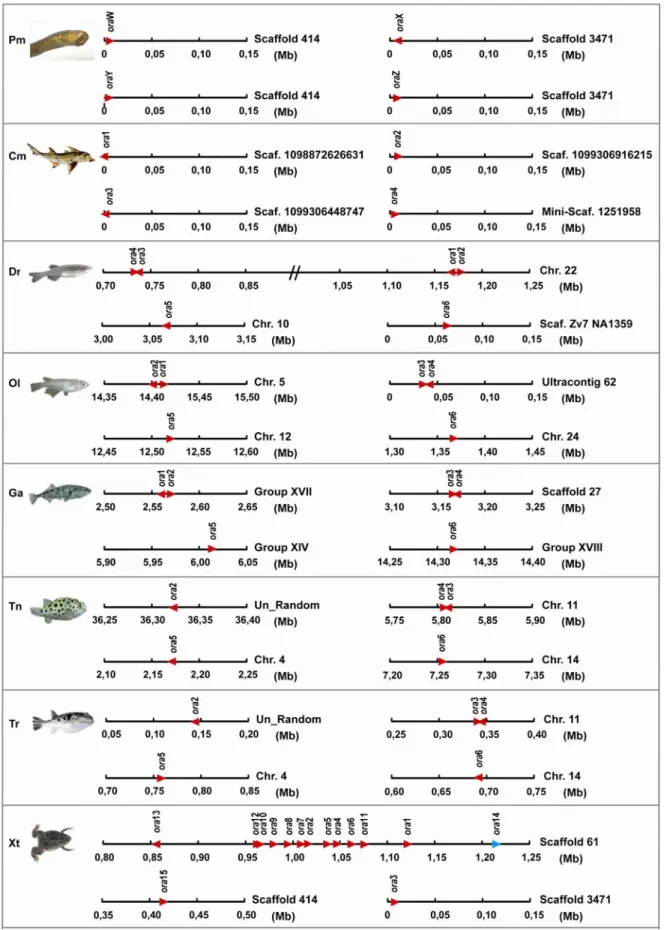
Figure VII-8 | Genomic locations of all the ora genes.--- 1
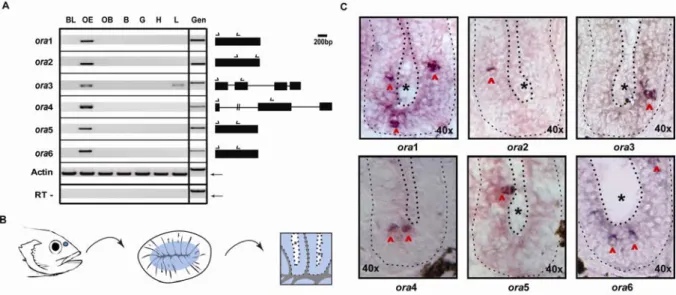
Figure VII-9 | Expression of ora transcripts in the zebrafish olfactory system. --- 1
Figure VII-10 | ora genes expression pattern by whole mount in situ hybridization in 5dpf old zebrafish larvae. --- 1
Figure VII-11 | ora genes do not co-express with members of the same clade. --- 1
Figure VII-12 | ora genes of different clades do not co-express.--- 1
Figure VII-13 | Phylogenetic tree of TAAR family members.--- 1
Figure VII-14 | Amino acid sequence conservation in the fish taar gene repertoire. --- 1
Figure VII-15 | Estimated minimal evolutionary age of TAAR subfamilies and genes.. --- 1
Figure VII-16 | Evolutionary distances and selective pressure on taar genes. --- 1
Figure VII-17 | Expression of taar genes in the zebrafish olfactory epithelium (OE). --- 1
Figure VII-18 | S100-immunoreactivity in the adult zebrafish olfactory epithelia. --- 1
Figure VII-19 | S100-immunoreactivity in larvae-juvenile zebrafish olfactory epithelia. --- 1
Figure VII-20 | S100 family members in zebrafish.--- 1
Figure VII-21 | Developmental time course of S100z expression as detected by in situ hybridization. 1 Figure VII-22 | In situ hybridizations of s100z on adult olfactory epithelia and co-expression experiments with S100 antibody. --- 1
Figure VII-23 | Crypt cells expressing ora genes. --- 1
Figure VII-24 | ora genes show exclusive expression with respect to omp and s100z. --- 1
Figure VII-25 | ora genes show exclusive expression with respect to representatives of the OlfC and TAAR families. --- 1
Figure VII-26 | ora genes are predicted to signal through Gαi/o. ---74
Figure VII-27 | Gαi- and Gαo-immunoreactivity in the adult zebrafish olfactory epithelia. --- 1
Figure VII-28 | ora genes co-express Gαo and Gαi. --- 1
Figure XI-1 | Phylogenetic tree of all the ora genes plus all the mammalian V1Rs.--- 1
Figure XI-2 | ora and taar genes nomenclature, accession numbers and/or IDs and location.--- 1
Figure XI-3 | Identity and similarity matrix of fish ora genes.--- 1
14
IV. A
BSTRACTWhile for two of four mammalian olfactory receptor families, all of them G protein- coupled receptors, ortholog teleost families have been identified and well-characterized (OR and V2R), two other families (V1R and TAAR) lack to date a systematic study in non- mammalian vertebrates.
By data mining I identified a total of six V1R-like genes in five teleost species plus four orthologs in one jawless and one cartilaginous fish species each. In the phylogenetic analysis these ora genes (olfactory receptor, class A-related) form a single clade with three subclades, one of them including the entire mammalian V1R superfamily. The Ora family originates early in the vertebrate lineage, before the separation of the jawless from jawed fish. A similar search was performed also for taar genes in genomes of five teleosts, two basal fish and seven higher vertebrates. Taar genes segregate into three classes and their family size ranges from 18 to 112 genes in teleosts (pufferfish and zebrafish, respectively), while mammalian families contain at most 19 genes (opossum). The TAAR family originated in the common ancestor of bony and cartilaginous fishes, after its divergence from jawless fish. In these and other properties the ora and taar gene families turn out to be at opposite poles of the spectrum of olfactory receptor families.
All the six teleost Ora family members are evolutionarily much older than the speciation events in the teleost lineage, while most extant teleost taar genes have emerged late in evolution, well after the split between basal teleosts (zebrafish) and neoteleostei (stickleback, medaka, pufferfish). Taar genes are largely arranged according to phylogenetic proximity in two big clusters (both syntenic to the single sarcopterygian gene cluster), whereas the ora genes are organized as singletons or symmetrical gene pairs. TAAR genes are mostly monoexonic, whereas two ora genes exhibit a highly conserved multi-exonic structure. Furthermore, the ora genes are under strong negative selection (minute dN/dS values), whereas the teleost taar genes display a relaxed pattern of global negative selection and an unprecedented degree of local positive selection.
Taken together, the ora gene repertoire is highly conserved across teleosts, in striking contrast to the frequent species-specific expansions observed in mammalian V1Rs.
The inverse is observed for the taar gene repertoire, which is rather conserved across mammalian species, but exhibits frequent and large species-specific expansions in teleosts.
Thus, the transition from teleosts to tetrapods may parallel a transition in function as well as regulation of both the ora/V1R and TAAR gene families.
Consistent with a function as olfactory receptors all zebrafish ora and all analyzed taar genes (except taar1) were expressed in sparse subsets of olfactory receptor neurons.
The olfactory epithelium contains three subtypes of olfactory receptor neurons, ciliated, microvillous and crypt cells, the latter so far without known receptors, but with both cilia and microvilli. I found the ora genes to be expressed in the crypt cells, thereby deorphanizing this third type of OSN. Furthermore, the ora genes follow the monogenic rule of expression previously reported for members of other olfactory receptor gene families. Ora genes co- express both Gαi and Gαo, supporting the hypothesis that crypt cells might possess two distinct olfactory signaling pathways, one via their cilia and the other via microvilli.
15
V. Z
USAMMENFASSUNGNur zwei der vier grossen Familien von G Protein-gekoppelten Geruchsrezeptorgenen sind systematisch in Fischen untersucht worden (OR und V2R), während die restlichen zwei Familien (V1R und TAAR) bisher nur in Säugern genauer analysiert wurden.
Mittels ausgedehnter Datenbankanalysen konnte ich insgesamt sechs V1R-ähnliche Gene in fünf Arten von Knochenfischen identifizieren, sowie je vier Orthologe in Knorpelfischen und kieferlosen Fischen. In der phylogenetischen Analyse bilden diese ora Gene (olfaktorische Rezeptoren, verwandt mit Klasse A der G Protein-gekoppelten Rezeptoren) einen einzelnen Klade, der sich aus drei Unterkladen zusammensetzt, von denen einer die gesamte V1R Superfamilie der Säuger enthält. Die ora Genfamilie entstand bereits früh in der evolutionären Geschichte der Wirbeltiere, vor der Aufspaltung von kieferlosen Fischen (Agnatha) und Gnathostomata. Ich habe entsprechende Datenbanksuchen auch für die taar Genfamilie in den Genomen von fünf Arten von Knochenfischen, zwei Arten basaler Fische, und sieben Arten landlebender Vertebraten durchgeführt.
Taar Gene lassen sich in drei Untergruppen/Klassen aufteilen, und pro Art werden zwischen 18 und 112 Genen beobachtet (Kugelfische bzw. Zebrabärbling, Danio rerio), während in Säugern maximal 19 Gene gefunden wurden (Opossum). Die taar Genfamilie entstand im gemeinsamen Vorläufer der Knochen- und Knorpelfische, nach dessen Abspaltung von kieferlosen Fischen. Hier wie auch in anderen Analysen zeigt sich, dass ora und taar Genfamilien sehr verschiedene Wege in der Evolution gegangen sind, ja geradezu an den entgegengesetzten Enden des Spektrums olfaktorischer Rezeptorgenfamilien liegen.
Alle sechs ora Gene sind lange vor der Speziation der Knochenfische entstanden, während fast alle taar Gene der Knochenfische viel später evolvierten, sogar nach der Aufteilung in basale Teleosten (Zebrabärbling) und Neoteleosten (Stichling, Medaka, Kugelfisch). Taar Gene sind großenteils gemäß ihrer phylogenetischen Verwandtschaft auf dem Genom angeordnet, in zwei großen Clustern, die beide syntenisch zu dem Cluster der taar Gene in landlebenden Vertebraten sind, während die ora Gene einzeln bzw. als zwei symmetrische Genpaare vorliegen. Die meisten taar Gene bestehen nur aus einem Exon, während zwei der sechs ora Gene eine hochkonservierte multi-exonische Struktur aufweisen. Ora Gene unterliegen einer starken negativen Selektion, mit extrem kleinen dN/dS Werten, während die taar Gene der Knochenfische nur eine moderate globale negative Selektion aufweisen, aber gleichzeitig eine stark ausgeprägte positive Selektion an einzelnen Sequenzpositionen zeigen.
Zusammengefasst läßt sich sagen, dass das ora Genrepertoire sehr stabil und hochkonserviert ist, ganz im Gegensatz übrigens zu den häufigen spezies-spezifischen Expansionen der daraus hervorgegangenen Säuger V1R Gene. Umgekehrte Verhältnisse gelten für die taar Gene, die innerhalb der Säuger recht gut konserviert sind, aber in den Knochenfischen häufige und spezies- spezifische Genexpansionen aufweisen. Der Übergang von Teleosten zu Tetrapoden könnte daher in beiden Genfamilien mit einem drastischen Wechsel sowohl in Funktion und Genregulation einhergehen.
Wie für Geruchsrezeptoren erwartet, wurden alle ora Gene und alle untersuchten taar Gene des Zebrabärblings (außer taar1) in vereinzelten olfaktorischen Rezeptorneuronen exprimiert. Es existieren drei Arten dieser Neurone, die ziliierten, mikrovillären Neurone und die Kryptzellen, die sowohl Zilien als auch Mikrovilli tragen, jedoch bisher keinen Geruchsrezeptoren zugeordnet werden konnten. Ich konnte zeigen, dass die ora Gene spezifisch in Kryptzellen exprimiert werden, und damit die bisher völlig offene Frage einer Funktion dieser Kryptzellen einer Lösung näherbringen. Weiters konnte ich nachweisen, dass die ora Gene der Ein-Rezeptorneuron-ein-Rezeptorgen Regel folgen, wie es für Mitglieder verschiedener anderer olfakorischer Rezeptorgenfamilien bekannt ist. Ora Gene werden zusammen mit Gαi und Gαo exprimiert, was die Hypothese nahelegt, dass Kryptzellen zwei unabhängige Signalwege aufweisen könnten, einen in den Zilien, und den anderen in den Mikrovilli.
16
17
VI. I
NTRODUCTION"Nothing in Biology Makes Sense Except in the Light of Evolution"
T. Dobzhansky
How many times has a given smell redirected us to a certain episode of our childhood? In humans, smell is often regarded as the sense that elicits the strongest memories. Thus, the addition of emotional qualities to previously encountered situations and objects might to be the major function of the human sense of smell as opposed to making an essential contribution to finding or recognizing objects. However, in many animals the olfactory sense is one of the primary tools that were developed to make sense of their environment. Thousands of structurally diverse odor molecules perceived and discriminated by vertebrates supply them with a wide range of vital information, ranging from prey and predator localization to mating behavior, underlining the importance of the olfactory sense to the survival of the species.
It comes with no surprise that the fundamental importance of olfaction to life and health was recognized in 2004 by the award of the Nobel Prize in Physiology or Medicine to Drs. Linda Buck and Richard Axel for their pioneering discovery of the olfactory receptors and the understanding of olfactory organization that these groundbreaking findings allowed.
Even almost twenty years after the first molecular studies, olfaction is still a very active, popular and productive field of research among the scientific community. The olfactory system
In the olfactory system, sensory information is processed through a series of distinct neuro anatomical structures beginning with the binding of odorant molecules to odorant receptors at the olfactory epithelium in the nose, and ending at the higher cortical areas of the brain, where a perceptual construct is then generated (Reed 1992; Buck 1996;
Hildebrand and Shepherd 1997; Mori 1999; Nakamura 2000).
A. The olfactory system
1. The rodent olfactory system
The olfactory system furnishes elaborate molecular and cellular machineries for detection and discrimination of a vast numberof chemical compounds in the environment (Axel 1995). Most mammals, including rodents, have two separate olfactory systems that detect and process two functionally distinct classes of chemicals, volatile odorants and
18
pheromones, through anatomicallysegregated neural pathways: the main olfactory system and thevomeronasal (accessory olfactory) system (Fig. VI-1) (Buck 2000; Mombaerts 2004).
Volatile odorants are detected by a large repertoireof olfactory receptors (ORs) expressed on the cilia and dendritic knob of ciliated olfactory sensoryneurons (OSNs) in the olfactory epithelium (OE), that project their axons to the main olfactory bulb (OB). In contrast, pheromones are detected mostly by two families of vomeronasal receptors (VRs) on microvillous sensory neurons in the vomeronasalorgan, and their information is transmitted to the accessory olfactory bulb (AOB).
2. The teleost fish olfactory system
However, in teleost fish the situation is radically different. The fish olfactory system consists of one single olfactory organcontaining the different classes of OSNs (Fig. VI-1), which projecttheir axons to one single OB. The types of OSNs are distinct with respect to their anatomy, relative positionin the OE, and expression. To date, three different types of OSNs were described to mediate odor detection and discrimination in the teleost olfactory epithelium. Besides the more commonly known ciliated and microvillous cells, the crypt receptor neurons are thought to be also involved in olfactory pathways (Hansen and Zeiske 1998), (Hansen and Zielinski 2005) and there is evidence that these cells respond to odorants (Schmachtenberg 2006).
3. Ciliated versus microvillous sensory neurons
The ciliated OSNs havelong dendrites, their somata are situated in the deep basal layer of the OE and then express ORs, whereasmicrovillous OSNs have short dendrites and are located in the superficiallayer of the OE, are known to express V2Rs (Cao, Tanguay et al.
2003); (Morita and Finger 1998; Speca, Lin et al. 1999; Hansen, Rolen et al. 2003; Zeiske, Kasumyan et al. 2003; Hansen, Anderson et al. 2004). Moreover, retrograde tracing experiments in several teleost fish species reported that the two types of OSNsproject axons to different regions in the OB (Sato, Miyasaka et al. 2005).
The ciliated OSNs project both to the medial and ventral regions of the OB. These regions are activated by both amino acids and bile salts (Friedrich and Korsching 1997;
Hansen, Rolen et al. 2003) and project through the LOT and possibly through the medial bundle of the olfactory tract (mMOT). The LOT can discriminate among amino acids (von Rekowski and Zippel 1993) and is involved in feeding behavior (Hamdani, Alexander et al.
2001; Hamdani, Kasumyan et al. 2001), whereas the mMOT is involved in the alarm reaction (Hamdani, Stabell et al. 2000). The lateral region of the OB is innervated by the microvillous OSNs (Morita and Finger 1998; Hamdani, Alexander et al. 2001; Hamdani, Kasumyan et al.
19
2001; Hamdani el and Doving 2002; Hansen, Rolen et al. 2003) and microvillous neurons are known to discriminate both amino acids and nucleotides (Friedrich and Korsching 1997;
Hansen, Rolen et al. 2003) and probably project through the LOT. Taken together, microvillous neurons appear to be involved in feeding behavior whereas ciliated neurons may recognize alarm substance(s) and possibly other pheromones (von Rekowski and Zippel 1993; Hamdani, Alexander et al. 2001; Hamdani, Kasumyan et al. 2001).
Recent experiments making use of transgenic fish labeled with two different molecular cell markers, OMP and TRPC2 for ciliated and microvillous neurons, respectively, confirmed the data from the retrograde tracing experiments described above (Sato, Miyasaka et al.
2005).
4. Crypt sensory neurons
Teleost fish species also display a third type of OSN in their olfactory neuroepithelium:
the crypt cell neurons. Recently, cells with crypt-like morphology have also been found in mammalian olfactory epithelium (Hansen 2006). Crypt neurons may possess a duplex sensory apparatus, as they contain both an apical rim of microvilli and several cilia, which protrude from the bottom of a crypt, hence the naming (cf. (Hansen and Zeiske 1998)) (Fig.
1). This cell type is distributed mainly in the apical region of the lamellae (Hansen and Zeiske 1998; Hansen and Finger 2000; Hansen, Rolen et al. 2003; Zeiske, Kasumyan et al. 2003;
Hansen, Anderson et al. 2004). Although the exact role of crypt ORNs in olfactory pathways is still uncertain, it has been shown in crucian carp (Carassius carassius), that their axons project to a central region in the ventral olfactory bulb (Hamdani el and Doving 2006), whose neurons are activated by pheromones (Lastein, Hamdani el et al. 2006). These bulbar neurons project through the lateral bundle of the medial olfactory tract (lMOT), which mediates reproductive behavior (Weltzien, Hoglund et al. 2003). Thus, crypt cells may express olfactory receptors for sex pheromones, which make them interesting targets for olfactory research.
However, no defined molecular marker has become available for crypt cells, so they have been identified either morphologically at the electron-microscopic level (Hansen and Zeiske 1998) or by immunostaining with an antibody directed against bovine S100A1/B (Germana, Montalbano et al. 2004). It is not known which member of the S100 family, if any, was responsible for this cross-reactivity.
20
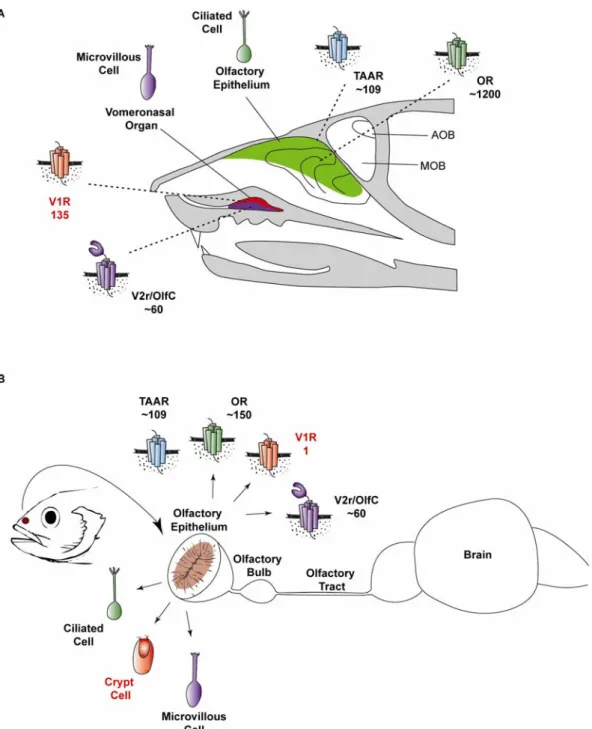
(A) A ciliated sensory neuron in the olfactory epithelium of mice expresses either OR or TAAR olfactory receptors. Microvillous neurons in the apical and basal layers of the vomeronasal organ express distinct, unrelated classes of G-protein-coupled pheromone receptors (V1Rs in the apical and V2Rs in the basal layer). (B) A sensory neuron in the olfactory epithelium of teleost fish expresses members of either OR, V1R or V2R olfactory receptors. In fish, in addition to the ciliated and microvillous cells, a third type of neuron is also present – the crypt cells. All the three types of OSNs are located in a single olfactory organ.
Figure VI-1 | The location of chemosensory organs in the mouse and teleost fish.
21
B. The olfactory receptor gene family repertoire and its evolutionary dynamics
In 1991, the pioneering work of Linda Buck and Richard Axel unraveled a large and diverse family of G protein-coupled receptors (GPCRs), expressed in the rat olfactory epithelium which were proposed to function as odorant receptors (Buck and Axel 1991).
Their work, along with the availability of a large number of fully sequenced genomes, opened the door for several subsequent molecular and bioinformatic studies of the different families of olfactory receptors. A large number of olfactory receptor genes in the same family, as Buck and Axel’s originally identified Ors, was described later in other mammals, birds, fish, and amphibians; in contrast to invertebrate species, which display similar, but autonomously expanded families of chemosensory GPCRs. Other independently expanded GPCR families appear to be responsible for pheromone and trace-amine detection in vertebrates. All of these olfactory receptor gene families vary between species. This is not unexpected given that each species considerably have their own characteristic set of chemical signals that are important ought to survival and reproduction. This specificity likely reflects a high level of evolutionary adaptation aimed at creating diversity. The remarkable discriminatory capacity of the chemosensory system (Dryer 2000) is directly linked to the diversity of the olfactory receptor gene families.
1. Olfactory receptors
Humans have about 350 functional odorant receptors (Niimura and Nei 2003), much less than the ~1000-1200 in the mouse and rat genomes, respectively (Gibbs, Weinstock et al.
2004; Young, Shykind et al. 2003). In fish the numbers are several fold smaller, ranging from 42 to 143 putatively functional OR genes in pufferfish and zebrafish, respectively (Alioto and Ngai 2005; Niimura and Nei 2005). Olfactory receptors are indeed one of the largest gene families known, comprising in rat about 6% of their total functional genes, emphasizing the importance of olfaction to the species. It is worth noting that probably a small subset of these genes may have other non-olfactory functions, in addition to or instead of a primary olfactory role. At least one human OR, hOR17-4, is expressed in the testis as well as the nose, responding to the chemical bourgeonal, thus allowing sperm to undergo chemotaxis toward bourgeonal sources (Spehr, Gisselmann et al. 2003). Members of the OR family are expressed mainly in the ciliated neurons (Sato, Miyasaka et al. 2005; Sato, Miyasaka et al.
2007). Members of the OR gene family display monogenic expression, i.e. a particular olfactory sensory neuron expresses only one OR (Serizawa, Miyamichi et al. 2003; Sato, Miyasaka et al. 2007).
22
The major difference in OR gene family size between species, ranging from 42 to 1430 genes in pufferfish and rat, respectively (Gibbs, Weinstock et al. 2004; Alioto and Ngai 2005;
Niimura and Nei 2005) constitutes an attractive starting point to study the evolution of the
“olfactome”. Comparisons of olfactory gene families of several species revealed that gene birth and death are common in the evolutionary history of these families and had major importance in defining the current total number of genes in these families (Robertson 1998;
Young, Friedman et al. 2002; Young and Trask 2002). The most probable cause of gene birth is local gene duplication. Following a duplication event, the resulting copies can follow many evolutionary trajectories. If the new gene is functionally redundant, one of the copies may undergo an inactivating mutation that will remove this gene from the functional repertoire. In contrast, if the new copy accumulates mutations that allow it to recognize a novel, useful odorant molecule, then it is likely that natural selection will favor the retention of the new, modified sequence. A strong selective pressure on creating diversity could even result in positive selection, i.e. higher rates of non-synonymous relative to synonymous substitutions. Conversely, if changes in the sequence eliminate useful ligand-recognition patterns, they would be subject to ‘‘negative or purifying selection’’, i.e. the numbers of synonymous substitutions would be more frequent than the non-synonymous ones, as is observed for genes in general.
OR genes occur mostly in clusters, consistent with and early evolutionary origin (Niimura and Nei 2005). Despite this fact, several studies have found evidence for amino acid signatures of positive selection on the olfactory receptors in mammal and fish species (Hughes and Hughes 1993. However, it remains to be seen whether the putatively selected amino acid changes are correlated with a novel gain of function. The dynamic nature of the evolution of this family is characterized by rapid expansion, gene duplication, extensive gene loss via pseudogenization, and diversifying selection (Ngai, Chess et al. 1993; Ngai, Dowling et al. 1993; Gilad, Segre et al. 2000; Waterston, Lander et al. 2002; Young, Friedman et al.
2002; Young and Trask 2002; Alioto and Ngai 2005).
2. Vomeronasal receptors
The mammalian sensory epithelium of the vomeronasal organ is organized in two layers, an apical and a basal layer, each expressing one type of vomeronasal receptor, the V1Rs and the V2Rs respectively (Fig. VI-1) (Buck 2000; Dulac 2000). The sensory neurons of the apical compartment of the VNO express members of the V1R gene family, which transduce signals via a coupled Gαi protein; neurons of the basal compartment express members of a second putative pheromone receptor gene family, the V2Rs, which transduce signals via a coupled Gαo protein (Dulac and Axel 1995; Herrada and Dulac 1997; Matsunami and Buck
23
1997; Ryba and Tirindelli 1997; Pantages and Dulac 2000). Like olfactory neurons, each vomeronasal sensory neuron (VSN) expresses only one or at most a few receptors (Roppolo, Vollery et al. 2007), but see (Martini, Silvotti et al. 2001).
3. V2Rs
V2Rs belong to the family C of GPCRs. In rodents the V2R repertoire consists of about 60 genes (Yang, Shi et al. 2005). These receptors are similar to metabotropic glutamate and calcium-sensing receptors in possessing a large N-terminal domain, whereas the C-terminal region contains the 7TM region characteristic for GPCRs (Matsunami and Buck 1997; Ryba and Tirindelli 1997). Based on studies of a goldfish V2R-like molecule, which binds arginine and lysine (Speca, Lin et al. 1999), it appears possible that V2Rs bind proteins rather than volatile organic compounds. This is consistent with observations that the V2R extracellular regions are homologous to bacterial proteins with amino acid-binding properties (Kunishima, Shimada et al. 2000); (Hermans and Challiss 2001). V2Rs are reported to be expressed in microvillous neurons (Sato, Miyasaka et al. 2005).
Similarly to the ORs, analysis of this gene family in several teleost fish species revealed that V2R genes tend to be organized in clusters, though singletons can also be found scattered throughout the genome (Hashiguchi and Nishida 2005). Recent large-scale duplications of V2R-containing chromosomal regions were detected in two V2R gene clusters. The evolutionary dynamics of this family is also characterized by rapid gene turnover and lineage-specific phylogenetic clustering (Hashiguchi and Nishida 2005;
Hashiguchi and Nishida 2006). In addition, phylogenetic and comparative genome analyses have shown that the fish and mammalian V2Rs receptors appear to have diverged significantly from a common ancestral gene(s), with these receptors likely mediating chemosensation of different classes of chemical structures by their respective organisms (Alioto and Ngai 2006; Hashiguchi and Nishida 2006).
4. V1R
The apically expressed V1R family has 135 members in the mouse genome organized into several gene clusters, with genes sharing from 25% to nearly 100% amino-acid sequence identity (Rodriguez, Del Punta et al. 2002). Their phylogenetically closest relatives are the T2R (taste receptor type 2) receptors (with 15-20% amino-acid sequence identity), suggesting that the genes encoding these two receptor families derived from a common ancestral gene. Similar to the OR genes, V1Rs display a 1 kilobase, intronless genomic structure (Buck and Axel 1991). In 2002, Boschat and colleagues (Boschat, Pelofi et al.
2002) identified 2-heptanone, a putative pheromone, as a ligand for one member of the V1R
24
family (V1Rb2). In another study, V1R genes could be linked to reproductive behavior:
Transgenic mice, in which a 600 kb gene cluster containing 16 different V1R genes was deleted, showed a reduction of maternal aggressive behavior. Furthermore, the VNO of these knockout mice did not respond to three out of eight putative tested pheromones.
Curiously, even though the deleted gene cluster includes V1Rb2, the vomeronasal organs of the knockout mice nevertheless respond to 2-heptanone, suggesting that multiple receptors might recognize and respond to this compound (Del Punta, Rothman et al. 2000). Members of the V1R family are expressed in the microvillous neurons and co-express Gαi1/2 in mammals (Dulac 2000; Pantages and Dulac 2000). While several studies classified the V2R and OR receptors as evolutionary old families, with about 50 to 150 members already present in several fish species (Hashiguchi and Nishida 2005; Niimura and Nei 2005), the V1R receptor family was considered a recent family that originated from a single V1R-like receptor gene in fish (Pfister and Rodriguez 2005) or alternatively from a single gene pair (Shi and Zhang 2007). Although species-specific expansion and loss of genes and even whole subfamilies is a recurrent theme in all three mammalian receptor families (Lane, Young et al. 2004; Zhang, Rodriguez et al. 2004; Grus, Shi et al. 2005), as well as in fish ORs (Niimura and Nei 2005) and fish V2R related gene families (Hashiguchi and Nishida 2005; Alioto and Ngai 2006), the V1R expansion from a single gene pair to over a hundred genes in some mammalian species appears somewhat extreme. I therefore undertook to examine the V1R-like gene repertoire in fish.
5. TAAR receptors
Trace amine-associated receptors (TAARs) are close relatives of G protein-coupled aminergic neurotransmitter receptors (Lindemann and Hoener 2005). Initially, TAARs were considered neurotransmitter receptors based on the expression and effects of some family members in the central nervous system (Lindemann and Hoener 2005). However, Liberles and Buck reported that several mammalian taar genes (some of which they could deorphanize) are expressed in olfactory sensory neurons (Liberles and Buck 2006). Thus, the taar genes joined a growing number of GPCR families that serve as olfactory receptors (cf. (Buck 2000). Following the cloning of the first TAAR receptors in mammals (Borowsky, Adham et al. 2001), TAAR genes have been found in lower vertebrate genomes (Gloriam, Bjarnadottir et al. 2005) and recently it has been suggested that the family occurs already in lamprey (Hashiguchi and Nishida 2007). The first in silico study uncovered about 50 TAAR receptors in zebrafish and 8 in a pufferfish (Gloriam, Bjarnadottir et al. 2005), but these numbers were nearly doubled in a follow-up study (Hashiguchi and Nishida 2007).
Nevertheless, the delineation from classical aminergic neurotransmitter receptors has not
25
been investigated thoroughly, and consequently both the scope of the TAAR family and its evolutionary origin have not become clear. TAAR genes were shown to co-express GαOlf, suggesting that they are expressed at least in ciliated neurons (liberles and buck). In this thesis I have analyzed both the scope and the evolutionary history of the TAAR gene family in fish.
C. Olfactory signaling transduction
Olfactory sensory neurons transduce odor signals by coupling GPCRs to one or more downstream effector molecules. As mentioned above, GPCRs activate heteromeric GTP binding proteins and intracellular second messengers (Axel 1995) (Firestein 1992; Firestein 1996; Firestein, Breer et al. 1996; Zhang and Firestein 2002) (Elsaesser and Paysan 2005;
Elsaesser and Paysan 2007) (Schild and Restrepo 1998). Two main excitatory transduction mechanisms are described to be used in OSNs, one mediated by cyclic AMP, and the other by IP3; although the last one is to date subject of controversy (Gold 1999) and references therein) and may in fact be a modulating influence, not an independent pathway (Elsaesser and Paysan 2007). Cyclic nucleotide signaling is best understood in vertebrate olfactory receptor neurons (Fig. VI-2). In that pathway odorants activate ORs (buck 2000) on the cilia of olfactory receptor neurons (ORNs) and, by way of a Gα protein (Gαolf), stimulate an adenylyl cyclase (type III) to synthesize adenosine 3,5-cyclic monophosphate (cAMP) (Schild and Restrepo 1998) (Matthews and Reisert 2003; Reisert, Bauer et al. 2003). cAMP opens a cyclicnucleotide–gated (CNG) cation channel to produce a membrane depolarization (Zufall, Firestein et al. 1994; Schild and Restrepo 1998; Matthews and Reisert 2003; Reisert, Bauer et al. 2003). Influx of Ca2+ through the CNG channel opens a Ca2+- activated chloride (Cl) channel, leading to Cl– efflux and further depolarization (Schild and Restrepo 1998) (Matthews and Reisert 2003; Reisert, Bauer et al. 2003). Simultaneously, the Ca2þ influx decreases cAMP synthesis and the effective affinity of CNG channels for cAMP, both effects producing olfactory adaptation (Schild and Restrepo 1998) (Matthews and Reisert 2003; Reisert, Bauer et al. 2003).
26
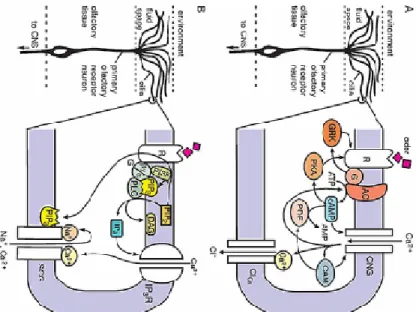
(A) Diagram of cyclic nucleotide signaling in the transduction compartment (olfactory cilia) of vertebrate olfactory receptor neurons. Odorant molecules bind to a receptor protein (R) coupled to an olfactory specific Gs-protein (G) and activate a type III adenylyl cyclase (AC), increasing intracellular cAMP levels. cAMP targets an olfactory-specific cyclic-nucleotide gated ion channel (CNG), a nonselective cation channel that increases intracellular calcium and secondarily activates a calcium-activated chloride channel thought to carry the majority of the transduction current. Other, regulatory pathways are also shown. (B) Diagram of phosphoinositide signaling as currently understood in the transduction compartment (outer dendrite) of lobster olfactory receptor neurons. Odorant molecules bind to a receptor protein (R) coupled to a Gq-protein and activate both phospholipase-C (PLC) and phosphoinositide 3-OH kinase (PI3K) to generate diacylglycerol (DAG) and inositol 1,4,5-trisphosphate (IP3), and phosphatidylinositol 3,4,5- trisphosphate (PIP3), respectively, from phosphatidylinositol 4,5-bisphosphate (PIP2). We assume, therefore, that PIP3 in concert with ‘‘release’’ of extracellular calcium from a plasma membrane IP3 receptor (IP3R), also known to be expressed in the transduction compartment, target a lobster homolog of a transient receptor potential channel, a nonselective cation channel that is modulated by both sodium and calcium (SGC) and that has been shown to carry the majority of the transduction current. Details of these pathways vary in other receptor cells and other species. Adapted from (Ache and Young 2005).
Figure VI-2 | Two Intracellular Signaling Cascades Implicated in Chemosensory Transduction
According to the inositol triphosphate (IP3) model a different subset of odorants activates a different subset of receptor proteins that couple via a Gαq/11 or Gαi/o heterotrimeric G protein to phospholipase C (PLC). PLC cleaves the headgroup of the membrane phospholipid phosphotidyl inositol, producing diacylglycerol (which remains in the membrane) and IP3 (which is water soluble). The IP3 model suggests the existence of IP3- gated Ca2+ channels in the ciliary membrane that mediate Ca2+-influx and membrane depolarization (Restrepo, Teeter et al. 1996; Rebecchi and Pentyala 2000). Moreover, PLC stimulation mediated by Gαi and Gαo, seems to be effected via the Gbetagama complex of these heterotrimeric G-proteins (Rebecchi and Pentyala 2000), Gbetagama subunits associated with Gαi and Gαo in VSNs may play an important role in transduction processes.
A recent study by Runnenburger and colleagues identified the Gβ subtypes as well as the 27
Gδ subunits expressed in the VNO, notably in the two groups of chemosensory neurons and the authors hypothesize that PLC activation in the two populations of chemosensory VNO neurons is mediated by different Gβδ complexes (Runnenburger, Breer et al. 2002).
Similarly to mammals, fish also present evidence for the existence of both AMP and IP3 transduction pathways (Miyamoto, Restrepo et al. 1992; Miyamoto, Restrepo et al. 1992;
Restrepo, Boekhoff et al. 1993; Restrepo, Okada et al. 1993; Restrepo, Okada et al. 1993).
Later, Gα−protein subunits were described to be present in catfish OSNs (Abogadie, Bruch et al. 1995; Abogadie, Bruch et al. 1995) (Dellacorte, Restrepo et al. 1996). Hansen and coworkers (2003) showed in catfish that cyclic AMP mediates olfactory sensory transduction in response to amino acids and bile acids. The Gαolf/s protein was localized to the cilia and plasma membrane of ciliated OSNs of the channel catfish, while the microvillous and crypt neurons seem to use Gαq/11 and Gαo, respectively (Hansen, Rolen et al. 2003), goldfish (Hansen, Anderson et al. 2004), and in the perciform round goby (Belanger, Smith et al.
2003). Moreover, evidence for an IP3 mediated pathway in response to amino acids has been shown in salmon (Lo, Bradley et al. 1993) and zebrafish (Ma and Michel 1998). In zebrafish, the ciliated cells were shown to express the cyclic nucleotide gated A2 subunit together with members of the OR family. Microvillous cells were found to express the transient receptor potential channel C2 together with members of the V2R-like family.
Moreover, both types of OSNs project to distinct areas of the olfactory bulb (Sato, Miyasaka et al. 2005). The use of genetic, physiological and morphological probes offers promising avenues of progress towards the elucidation of the mechanisms of signaling transduction in the teleost OSNs, which still remain poorly understood.
D. Aims:
Indeed, the sense of smell is so important that exerts sufficient selective pressure to maintain several hundreds of olfactory receptor genes throughout evolution. Studying the evolutionary dynamics of the olfactory receptor genes is thus an instrumental approach to better understand the olfactory sense. This approach requires both the identification and characterization of the different olfactory receptor gene families not only in mammals but also in lower vertebrates.
For two of the four mammalian olfactory receptor gene families, very incomplete data had been available. I report here the identification and characterization of fish V1r-like and taar gene families and continue with an analysis of cellular expression, co-localization and signal transduction cascade components.
28
VII. R
ESULTSThe nature of olfactory stimuli has dramatically changed during the water-to-land transition of vertebrate evolution. Corresponding evolution of olfactory receptor gene families is to be expected. While mammalian olfactory receptor gene families are well characterized, not much is known about the total repertoires and evolutionary dynamics of some of these families in teleost fish.
I have uncovered and characterized a new class of olfactory receptor genes in fish and contribute to the delineation and characterization of another olfactory receptor gene family in fish. With this thesis I present both the classification of these gene families including some cell-biological aspects and compare their properties to those of their mammalian counterparts, thus elucidating the transition in the olfactory receptor gene repertoire upon the teleost-tetrapod transition and consequent colonization of the terrestrial environment.
A. Ora family
1. Four novel V1R-like genes were identified in each of five teleost species A recursive search strategy starting with all known V1r genes (see Methods for details) and using automatic ortholog annotation in combination with the tBlastN algorithm (for details see Materials and Methods) uncovered four novel genes in the zebrafish genome (Fig. VII-1). All orthologs of all four Danio rerio genes could be identified in four further fish species, Gasterosteus aculeatus, Oryzias latipes, Takifugu rubripes, and Tetraodon nigroviridis (three-spined stickleback, medaka and two pufferfish, respectively). No pseudogenes were detected in any of the five teleost species.
I proposed to name these V1r-like genes ora (olfactory receptors related to class A, cf.
Schioth and Fredriksson 2005; www.gpcr.org/) and not V1r, since that name refers to the tetrapod vomeronasal organ which fish do not possess - all the fish olfactory receptors are expressed in the main olfactory epithelium. The designation ‘ora’ reflects both the olfactory- specific nature of these receptors as well as their phylogenetic position within the GPCR super family. Individual ora genes were numbered from 1 to 6, beginning with the first zebrafish ora gene to be identified (Pfister and Rodriguez 2005). The new nomenclature has been accepted by the zebrafish nomenclature committee and is shown in Fig.32. It mirrors the recent re-naming of the fish V2r-like genes as OlfC genes (cf. Alioto and Ngai 2006). In the phylogenetic comparison with other teleost chemosensory receptor families (see below) ora genes emerge as monophyletic group.
29
(A) 28 fish Ora (red), 4 shark Ora (orange), 4 lamprey Ora (violet), 15 frog Ora (green) with some mammalian V1R (light blue) representatives and T2R (orange) as the closest relatives.
Tree presented constructed using the ML method. (B) 28 fish ora genes. Tree presented constructed using the NJ method. Bootstrap support (total 1000 replications) is indicated at the major nodes. Scale bar indicates the number of amino acid substitutions per site. Asterisk, see (Pfister and Rodriguez 2005); double cross, see (Shi and Zhang 2007). ora: olfactory receptors of class A; T2R: putative taste receptors of type 2 (Ishimaru et al. 2005); V1R: vomeronasal type 1 receptors (Grus et al. 2005). The V1R receptors are a subset of V1Rs from all mammalian organisms annotated in the NCBI database (mouse, rat, human) and described in publications (opossum, cow, dog, (Grus et al. 2005). The phylogenetic position of the full mammalian V1R set of annotated and published genes is identical (cf. Supplementary Figure 1). Bold lines indicate ML bootstrap values greater or equal to 85%. Unfilled and filled stars indicate branch changes in the NJ and MP methods, respectively. Black and grey circles and squares indicate that the clades downstream of the node are supported by bootstrap values of 66-100% and 33- 66% for the trees constructed using MP and NJ methods, respectively.
Figure VII-1 | Phylogenetic tree of the fish Ora family
2. The ora genes form a single clade together with mammalian V1Rs
Using the T2Rs as outgroup; I compared the newly found genes to their most closely related chemosensory receptor families, the mammalian V1r genes (Fig. VII-1A). With respect to T2R, OR (Fig. XI-1) and other chemosensory receptor gene families (T1R, OlfC, data not shown) all fish ora genes form a monophyletic clade, supporting their identification as a single family separate from the other chemosensory receptor families. The Ora clade includes all mammalian V1R receptors (Fig. VII-1A, Fig. XI-1); thus the Ora family can be considered paraphyletic, with the mammalian V1Rs originating as a single subclade within the Ora family. Both mammalian and fish taste receptors of the T2R family (Ishimaru, Okada et al. 2005) are close phylogenetic neighbors, but nevertheless clearly segregate from the
30
Ora family with high bootstrap values (Fig. VII-1A). Odorant receptor genes (ORs) are even more distant from the ora genes (Fig. XI-1).
The six teleost ora genes subdivide into three pairs, ora1-ora2, ora3-ora4, and ora5- ora6. In the phylogenetic tree these subclades are supported by maximal bootstrap values (Fig. VII-1B). Orthologs of the individual genes in all cases can be identified unambiguously, again with maximal bootstrap values (Fig. VII-1A). Conserved amino acids are mostly restricted to the orthologs of a single gene, but often a particular position is conserved in all orthologs of a gene pair (cf. Fig. VII-2), consistent with the branchpoint pattern of the phylogenetic tree. Motifs conserved across two or all three gene pairs are comparatively rare, as detailed below.
3. Ora family size in jawless and cartilaginous fish close to that of teleost fish
I also analyzed the available databases for the presence of ora orthologs in one species of cartilaginous fish – Callorhinchus milii – and in one jawless fish – Petromyzon marinus.
Four novel Ora family members were identified in each of the above mentioned species (Fig.
VII-1).
This repertoire for these two species is probably not yet complete due to the following reasons: in the case of Callorhinchus milii, only 1.4 fold genomic coverage is currently available and in the case of Petromyzon marinus the genome assembly is defective due to both a repetitive genome rich in A/T and a high heterozygosity rate. Thus the total number of ora genes in cartilaginous and jawless fish (four genes present in each species) may possibly be rather similar to that of teleost fish. Since in the case of the sea lamprey genes no clear direct homologs were delineated, a new rule of nomenclature was adopted: these genes were named provisionally with W, X, Y and Z; not to foreclose a coherent nomenclature for ora genes of basal taxa, which will only be possible after completion of the respective genome projects.
31
32
Figure VII-2 | Conserved sequence motifs of the Ora family.
Conservation of predicted amino acid sequence for the fish Ora repertoire is displayed as a sequence logo. In this representation, the relative frequency with which an amino acid appears at a given position is reflected by the height of its one-letter amino acid code in the logo, with the total height at a given position proportional to the level of sequence conservation. The regions corresponding to the transmembrane (TM) domains and the extracellular and intracellular domains (EC & IC) are numbered and indicated. Sequence alignments were manually edited (for details see Methods section). Of fourteen motifs conserved in V1Rs (all of them single amino acids, identified by (Rodriguez et al. 2002) eight are not conserved in ORs (cf. Niimura and Nei, 2005) and consequently were chosen as analytical criterion here (asterisks). Crosses represent residues generally conserved among other GPCR families and circles represent residues conserved in fish ora genes, but not in mammalian V1R genes. Filled circles represent residues conserved between Ora and TAARs. Squares represent residues conserved between Ora, V1R and TAARs. Filled squares represent residues conserved between Ora, T2R and TAARs.
4. Low overall similarity but high degree of conservation for motifs characteristic for mammalian V1Rs
The ora genes constitute a highly heterogeneous family, with homologies often as low as 15% and minimally 11% (Fig. XI-3). I therefore analyzed the retention of characteristic sequence motifs in order to obtain a second line of evidence supporting the identification of ora genes both as a new family, and as a V1R-related family.
Mammalian V1Rs are already quite divergent and comprise e.g. in mice twelve distantly related subfamilies (Rodriguez, Del Punta et al. 2002). Consequently there are very few defining sequence motifs, all of them single amino acids, which are retained in nearly all family members. Initially, fourteen such motifs were reported to be V1R-specific (Rodriguez, Del Punta et al. 2002). However, six of them are present also in several other general class A GPCR-specific, e.g. OR, TAAR and T2R thus cannot be used to delineate the V1R family (Fig. VII-2). Furthermore, these six motifs are located either inside the TM (one “N” in TM1, one “L” in TM2, one “W” in TM4 and one “P” in TM7) or EC (one “C” in both EC1 and EC2) domains and at least some of them are known to play a instrumental role in the general
33
structural stability of the molecule (Rodriguez, Del Punta et al. 2002). The remaining eight are V1R-specific and are also highly conserved in the fish ora genes (Fig. VII-2), supporting the assignment as V1R-like genes. The degree of conservation is highest for the ora3-ora4 gene pair, slightly lower for the ora1-ora2 gene pair, and lowest (though clearly significant) for the ora5-ora6 gene pair, consistent with its larger distance from the mammalian V1Rs in the phylogenetic tree.
Beyond these V1R-specific motifs plus the above described general class A GPCR- specific motifs, ora genes contain ten Ora-specific conserved amino acids located mainly in the TM domains. All these Ora-specific residues are - with three exceptions;”L” in TM2, “P” in TM5 and “A” in IC3 (Fig. VII-2) - not conserved in either fish OR, TAAR or T2R genes (see Ishimaru, Okada et al. 2005; Niimura and Nei 2005), and thus distinguish the Ora family from the odorant, trace-amine and the taste receptor families (Fig. VII-2). In teleost fish, three of these motifs (“T” and “S” in TM3 and “F” in EC2) are conserved in all ora genes, two (“S” in TM4 and “F” in TM7) in 5 of 6 genes, and five (“D” in IC1, “R” in TM2, “S/N” in TM5 and “Y”
and “G” in TM7) in 2 of 3 ora gene pairs (the differing gene pair is variantly ora1-ora2, ora3- ora4, or ora5-ora6).
This degree of motif conservation among the teleost fish ora genes extends to the ora genes of both cartilaginous and jawless fish species analyzed. The shark shares all but one of the described general GPCR and Ora-specific motifs with the teleost fish species as well as the lamprey. Instead of an “S” in TM4, Cm ora4 displays an “A”. Lamprey ora genes display slightly more variability in two of the specific Ora motifs, “S” in TM4 and “F” in EC2 (Fig. VII-2).
In mammalian V1Rs some of these motifs are weakly conserved, and others are not conserved at all, supporting the assignment of the fish ora genes as a family separate from, but related to mammalian V1Rs.
5. ora genes precede teleost speciation with an early origin in jawless fish The presence of Ora orthologs in the five distantly related teleost fish species suggests by itself an ancient evolutionary origin of this family, before the segregation of all five teleost species, at least 350 million years ago (Nakatani, Takeda et al. 2007). The discovery of orthologs in cartilaginous and jawless fish sets the origin of the family close to the origin of the vertebrates.
In teleost species, Ora orthologs are without exception closer related than paralogs (Figs. VII-1,3), suggesting that all six Ora family members are evolutionary older than the speciation events in the teleost lineage taken into account here. Moreover, for each ora gene the phylogenetic tree closely reflects the phylogenetic relationships of the species. The two
34
pufferfish studied belong to the same family (Tetraodontidae) and their orthologs are related closer to each other than to those from any other species. The stickleback and medaka orthologs constitute their next neighbors, as pufferfish, stickleback and medaka belong to three subdivisions of the same superorder Acanthopterygii (orders Tetraodontiformes, Gasterosteiformes, and Beloniformes, respectively). In all cases the zebrafish orthologs occupy the most distant position (zebrafish being the evolutionarily most distant fish in this comparison, as it is an Ostariophysi, not a Neoteleostei like the four other species). For zebrafish ora1 orthologs were found in stickleback and medaka, but not in the two pufferfish species. Since stickleback, medaka and pufferfish belong to the same superorder Acanthopterygii, but zebrafish doesn't, this appears to be a case of gene loss in the pufferfish family, possibly related to the extreme reduction in genome size so characteristic of that family.
The clear separation in three teleostean subclades (Fig. VII-1) suggests the presence of three ancestral genes in the most recent common ancestor (MRCA) of teleost and tetrapods.
As already mentioned, both the jawless (sea lamprey) and cartilaginous (elephant shark) fish species analyzed in this study have an ora repertoire consisting of four genes each. The elephant shark ora genes are clear orthologs of the ora1, ora2, ora3 and ora4 genes present in the teleost species analyzed, thus the equivalent ora gene pairs must have been formed before the segregation of cartilaginous from bony fish. The sea lamprey ora genes have no direct orthologs neither in cartilaginous nor teleost fish (Fig. VII-1) and occupy a very basal position in the three ora subclades, thus placing the origin of the Ora family in the MRCA of jawless and jawed fish; firstly with the Pm oraW being the ancestral gene for the ora1-ora2 clade, secondly with the Pm oraX as the ancestral gene for the ora3-ora4 clade and lastly with the remaining two genes Pm oraY and Pm oraZ as ancestors of the ora5-ora6 clade (Fig. VII-3). Since both Pm oraY or Pm oraZ are direct paralogs, it is not clear whether one of this genes was lost in the transition from jawless to jawed fish or, alternatively, one was gained by a local gene duplication of the other after the origin of the Gnathostomata lineage.
6. Gene loss and gene gain upon transition to tetrapods
Mammalian V1R genes all belong to the ora1-ora2 clade, and all mammalian genes form a separate subtree within that clade (Figs. VI-1, VII-1A, XI-1 and data not shown). These results are consistent with a loss of two clades (ora3-ora4, and ora5-ora6) somewhere after the teleost/tetrapod split, as well as a massive expansion of the remaining clade (Fig. VII-3).
Such course of events is very reminiscent of the evolution within the OR gene
35
Open circles represent the gene gain events in each lineage, and red-filled circles represent the gene loss events. Inside each circle is the name of the respective gene(s) or clade. Emergence of the ora gene family, of the three clades of ora genes and of the v1r gene family is indicated by ovals. Red-filled ovals represent the loss of a whole clade or family. Triangles represent gene expansions. The major phylogenetic transitions are indicated: Ag/Gna, jawless/jawed fish segregation; bo/nobo, bony fish/cartilaginous fish; ac/sa, actinopterygian/sarcopterygian split;
os/neo, ostariophysii/neoteleostei segregation. The maximum parsimony principle was followed, thus gene gains are depicted at the last possible stage before additional gains would become necessary for explanation, but may in fact have occurred earlier.
Figure VII-3 | Estimated minimal evolutionary age of Ora clades and genes.
family, where nearly all subfamilies present in teleosts disappeared in mammals, and exactly one subfamily underwent a massive expansion (Niimura and Nei 2005). To clarify the time scale of the Ora evolution I have searched the genome of an amphibian tetrapod for ora genes. In Xenopus tropicalis I found 15 ora genes in total, which belong to two of the three fish clades (Figs. VII-1, XI-1 XI-2). Clade ora5-ora6 is missing, and clade ora3-ora4 is only represented by a single gene, Xt ora15. However, clade ora1-ora2 contains a single ortholog of ora1, another isolated gene (Xt ora14) closest to the nodal point of origin of this clade, as well as a large expansion of highly related genes (Xt ora2-13), well within the range of such expansions in mammalian species (Fig. VII-3). With respect to gene loss Xenopus represents an intermediate stage, but with respect to gene gain it resembles the mammalian situation. Due to their phylogenetic position it appears appropriate to name the Xenopus genes as ora, since they intermingle with fish ora, but not with mammalian V1r (Figs. VII-1 and VII-3). Numbering begins with Xt ora1, because the ortholog assignment is
36
unambiguous only in this case, following numbers are given according to the position in the NJ phylogenetic tree (Saraiva and Korsching 2007).
I hypothesize that the partial gene loss might be due to the loss of a fully aquatic life style in amphibians, and that the gene expansion is related to the transition to a terrestrial environment, consistent with a major shift in function of ora genes during this transition.
7. Strong negative selection for ora genes, but no evidence for positive selection
To better understand both the high degree of intraspecies variability and the high degree of interspecies conservation of ora genes I analyzed the evolutionary constraints that are acting on this gene family.
Paralog homology is usually below 25% amino acid identity and often as low as 15%, with average values for each species close to 20% (Fig. VII-4B). Most of this divergence is due to radical amino acid changes, since even omitting conservative amino acids exchanges, the average similarity of paralogs is still below 40% for all species (Fig. VII-4C).
Homology within paralog gene pairs is somewhat higher than between them, with ora5 vs.
ora6 comparisons always resulting in lower values than those obtained for the other two gene pairs, ora1 vs. ora2 and ora3 vs. ora4.
Ortholog homologies are much higher and in fact identity of any ortholog pair is higher than that of any paralog pair in all possible pairwise comparisons bar one (Fig. XI-2). The average identity in all ortholog comparisons is 60%, with mean values for the individual ora genes ranging between 46 and 72%, and average ortholog similarities go up from 60% to 81%, with an average value for all ora genes of 72% (Fig. VII-4).
These values appear large enough, cf. (Wolfe and Sharp 1993) to allow analysis of non-synonymous (dN) vs synonymous (dS) substitutions as a means to calculate the selective pressures acting on the ora genes. When the number of dN equals the number of dS, the dN/dS ratio equals 1, which corresponds to neutral selection. If the number of non- synonymous changes is higher than the number of synonymous changes, then dN/dS>1,which indicates positive selection. On the other hand, if the number of synonymous (dS) changes is higher than the number of non-synonymous changes, then dN/dS<1 and we are in the presence of negative selection (Nei and Gojobori 1986).
37
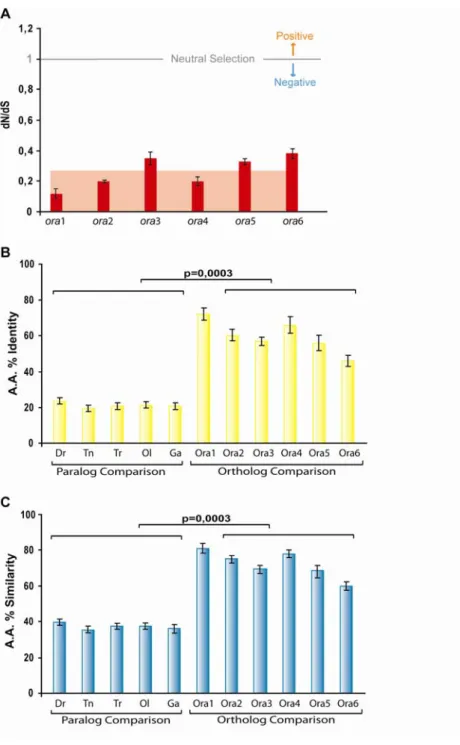
(A) dN/dS ratios of the six ora genes. For each gene, the dN/dS ratio was determined for all possible pairwise comparisons between orthologs. The average value is indicated by background shading. and the mean value was plotted. (B) Amino acid % identity is calculated for each gene comparisons between orthologs) or species (paralog comparisons) by averaging the values of all possible pairwise comparisons inside the described group. (C) Amino acid % similarity is calculated for each gene or species by averaging the values of all possible pairwise comparisons inside the described group. A, B, C). The b
Figure VII-4 | Identity, similarity, and conservation level of the ora genes.
ars correspond to the associated standard deviation as measure of the variance within each group. B, C) Differences between values for ortholog and paralog comparisons are highly significant.
38