Seminar on Software Cost Estimation
WS 02/03
Presented by:
Arun Mukhija
Requirements Engineering Research Group Institut für Informatik
Universität Zürich
Prof. M. Glinz
January 21, 2003
Contents
1. What is Software Maintenance? 3
2. Facts and Figures 4
2.1. Share of Maintenance in Overall Life-cycle Cost of Software 4
2.2. Software Maintenance Production Function 4
2.3. Distribution of Software Maintenance Effort by Activity 5
3. Maintenance Activities and Costs 6
3.1. Nominal Default Values for Maintenance Activities 6
3.2. Defect Repairs 7
3.3. Error-prone Module Removal 9
3.4. Customer Support 9
3.5. Code Restructuring 10
3.6. Migration Across Platforms 10
3.7. Conversion to New Architectures 10
3.8. Mandatory Changes 11
3.9. Performance Optimization 11
3.10. Enhancements 11
4. Maintenance Estimation Models 12
4.1. COCOMO Maintenance Model 12
4.2. Maintenance/Development Cost Ratio 12
4.3. Cards-per-person Ratio 13
4.4. Maintenance Productivity Ratio 13
5. Conclusion and Discussion 14
References 14
1. What is Software Maintenance?
Martin and McClure [MM83] define software maintenance as, “Changes that have to be made to computer programs after they have been delivered to the customer or user.”
It is necessary to estimate maintenance effort and costs as part of the planning process. Maintenance costs amount for a significant portion of the overall project life-cycle cost (as we will see in the next section). Moreover estimate of maintenance effort helps to plan adequate maintenance staff. For the software with warranty, it is important to estimate the effort required to provide these warranty services.
First and foremost, there needs to be a common understanding on the maintenance work, between the software supplier and the customer. We can broadly define maintenance activities into following four categories:
• Corrective maintenance – Corrective maintenance involves the standard defect repairs in the software, after the software has been delivered to the customer. The cost for corrective maintenance is almost always bore by the supplier.
• Adaptive maintenance – Adaptive maintenance involves modifications to the software required by changes in the operating environment, such as database upgrades, operating system upgrades, compiler version changes etc. Mostly the customer bears the cost for adaptive maintenance, but it also depends on the contract between the supplier and the customer.
• Perfective maintenance – Perfective maintenance is more tricky to understand. It involves changes to the code to allow the software to meet the same requirements but in a significantly more acceptable manner. Such as modifications of the code to improve performance in trouble spots. The cost for perfective maintenance can be bore either by the supplier or by the customer, depending on the contract between them.
• Enhancements – Software enhancement implies addition of new features or functionalities to an existing application. It is perhaps the most controversial category of maintenance activities, as technically (and also, legally) enhancements are not a part of the maintenance process. But being a post- release activity, they are often considered a part of the maintenance process.
The funding for enhancements almost always comes from the customer.
Of these four categories, first three leave the functional specification of software intact, while only the last one results in the changed functional specification of the software.
In the next section, we discuss some of the facts and figures related to the maintenance process. Section 3 describes important maintenance activities involved in this process and their related costs. Section 4 contains a discussion on some common maintenance estimation models including COCOMO maintenance model.
And finally section 5 concludes this report.
2. Facts and Figures
2.1. Share of Maintenance in Overall Life-cycle Cost of Software
[Jones02] states that, “In 2001, more than 50 percent of the global software population was engaged in modifying existing applications rather than writing new applications.”
There are some other interesting facts compiled by Boehm in [Boehm81]. Figure 1 shows maintenance percentages of 10-year software life-cycle costs in large organizations, ranging from 60% for General Telephone and Electronics to 75% for General Motors. Figure 2, based on data from 487 business data processing installations, indicates that the average development to maintenance ratio among installations surveyed was 47 to 53.
In spite of a significant portion of total software life-cycle costs being associated with maintenance activities, relatively little is known about the software maintenance process and the factors that influence its cost.
2.2. Software Maintenance Production Function
A typical software maintenance cost-benefit production function is shown in figure 3.
The investment segment consists of those maintenance activities that must be performed if the program is not to deteriorate in value: emergency program fixes, accommodation of changes to the program’s environment (such as, changes in hardware, operating system, master data base, input data etc.), and mandated enhancements (for example, new income tax reporting requirements etc.). The high-payoff segment of the curve consists of primary-priority enhancements for users,
0 20 40 60 80 100
Present of 10-year life-cycle costs
update and maintenance development
Gereral Telephone and Electronics
USAF Command and control No.1
USAF command and control No.2
General Motors
8 43
49
0 10 20 30 40 50 60
Maintenance Development Other
Percent of total software effort
Figure 1: Software Development and Maintenance Costs in Large
Organizations [Boehm81]
Figure 2: Software Development and Maintenance Costs in 487 Business Organizations [Boehm81]
primary improvements in program efficiency, reliability and documentation, and a set of secondary user enhancements that provide a lower but still positive excess of benefits over costs. The diminishing-returns segment of the curve consists of the
“nice-to-have” features (such as, limited-demand reports and displays, rewriting the poorly-structured but stable modules etc.). All of these features provide some benefit, but not as much in relation to their costs as the activities in the high-payoff segment.
The most significant feature of figure 3 is the very high fraction of maintenance effort (40 to 50%) consumed by the investment segment. It represents the work that has to be performed just to keep the system’s value at roughly its current level. Clearly, it is an area where the use of modern programming practices to reduce the need for emergency program fixing and to minimize the side effects of environmental changes can have a powerful effect on the overall maintenance effort.
2.3. Distribution of Software Maintenance Effort by Activity
Based on a survey of 487 business data processing applications [Boehm81], figure 4 shows how the software maintenance effort is typically distributed among the major categories of update and repair. Corrective maintenance (emergency program fixes and routine debugging), generally the major portion of the hardware maintenance budget, tends to consume only a relatively small (21.7%) portion of the software maintenance effort as defined here. Thus, achieving error free software development does not eliminate the need for a significant budget for software maintenance.
Figure 3: Software maintenance production function [Boehm81]
The major portion (41.8%) of the software maintenance effort is devoted to software enhancements for users. Figure 5 shows how the user enhancement effort is typically distributed, in terms of the reports produced by the software system. It becomes clear from this distribution that (at least for business data processing) flexible data structures and report generation capabilities play an important role in improving software maintenance efficiency.
3. Maintenance Activities and Costs
3.1. Nominal Default Values for Maintenance Activities
[Jones98] presents nominal default values for estimating various kinds of maintenance activities, as shown in the table 1.
The metrics used to express these default values are “assignment scopes” (A scopes), and “production rates” (P rates). The metric production rate refers to the amount of software that can be maintained per unit time interval. The term assignment scope refers to the amount of software one maintenance programmer can keep operational in the normal course of a year, assuming routine defect repairs and minor updates. The amount of software is measured in terms of function points (FP).
As can be observed from the table 1, the assignment scopes can vary from 300 function points to 5000 function points, with an average value of around 2000 function points. Another study by [Jones02] reveals that, the average defect removal rate is about 8 defects repaired per staff month.
12.4 9.3
17.4
6.2 41.8
5.5 4 3.4
0 10 20 30 40 50
Emergency program fixes Routine debuging Accommondate changings to input data, files Accommondate changings to hardware,OS Enhancements fro users Improve documentation Improve code efficiency Other
Percent of software maintenance effort
40.8
27.1
10
5.6 6.4 10.1
0 5 10 15 20 25 30 35 40 45
New reports Added data for existing reports Reformatting existing reports Condensing existing reports Consolidating exsting reports Other
percent of user enhancement effort
Figure 4: Distribution of software maintenance effort [Boehm81]
Figure 5: Distribution of user enhancement effort [Boehm81]
Table 1: Default Values for Maintenance Assignments Scopes and Production Rates (source [Jones98])
Activities A scopes,
FP
P rates,
FP per month
P rates,
work hours per FP
P rates,
LOC per staff month
Customer support 5,000 3,000 0.04 300,000
Code restructuring 5,000 1,000 0.13 100,000
Complexity Analysis 5,000 500 0.26 50,000
Reverse Engineering 2,500 125 1.06 12,500
Retirement 5,000 100 1.32 10,000
Field service 10,000 100 1.32 10,000
Dead code removal 750 35 3.77 3,500
Enhancements (minor) 75 25 5.28 2,500
Reengineering 500 25 5.28 2,500
Maintenance (defect repairs) 750 25 5.28 2,500
Warranty repairs 750 20 6.60 2,000
Migration to new platform 300 18 7.33 1,800
Enhancements (major) 125 15 8.80 1,500
Nationalization 250 15 8.80 1,500
Conversion to new interface 300 15 8.80 1,500
Mandatory changes 750 15 8.80 1,500
Performance optimization 750 15 8.80 1,500
Year-2000 repair 2,000 15 8.80 1,500
Eurocurrency conversion 1,500 15 8.80 1,500
Error-prone module removal 300 12 11.00 1,200
Average 2,080 240 5.25 24,000
As correctly pointed out in [Jones98] itself, none of these values are sufficiently rigorous by themselves for formal cost estimates, but are sufficient to illustrate some of the typical trends in various kinds of maintenance work. Obviously adjustments for team experience, complexity of the application, programming languages, and many other local factors are needed as well.
In the next sub-sections, we discuss details of some of the important maintenance activities. Descriptions about most of these activities are taken from [Jones98].
3.2. Defect Repairs
Defect repairs are presumably the most important of maintenance activities. Defect repairs are aimed at keeping software in operational condition after a crash or bug report. The costs of defect repair are usually absorbed by the software group that built the application, or covered under an explicit warranty agreement.
Defect repairs are largely unavoidable. US averages for defect-removal efficiency prior to release of software are about 85 percent. For the initial few years after the release of a software package, repairing defects reported by users is a significant expense for both internal and commercial software packages.
Defect repairs are seldom measured using normal function point calculations, because the majority of defect repairs are less than 25 source code statements in size, or perhaps one quarter of a function point. There are no counting rules for fractional function points, so the only way of enumerating the function point totals of small updates is by means of backfiring i.e. creating function points from source code statements.
A common metric to measure productivity is number-of-defect-repairs-per-month. In terms of this metric, US norms are about 8 defect repairs per month. But there are substantial variations in terms of monthly defect repair rates. Some maintenance organizations staffed by experienced maintenance personnel and fully supported by change-control tools, defect-tracking tools, and the like can achieve average rates of 16 to 20 defects repaired per month.
Another metric can be cost-per-defect metric. A problem with this metric occurs in situations where maintenance personnel are charging time to a project’s maintenance budget but no defects have been reported. Thus the overall impact of this metric is to penalize high-quality applications (with fewer defects reported per month) and make low-quality applications (with many defects reported per month) look better than they really are.
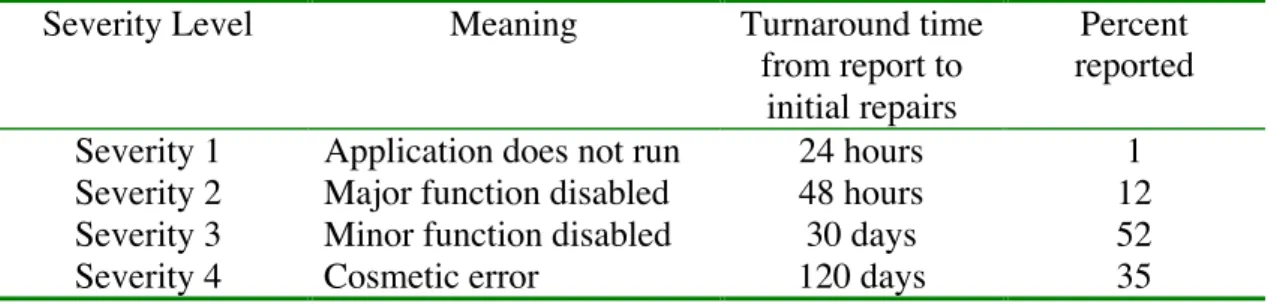
Table 2 presents nominal response times for defect repairs, using the four-point severity scale developed by the IBM in the 1960s.
Table 2: Nominal Response Time for Defect repairs by Severity Level (source [Jones98])
Severity Level Meaning Turnaround time
from report to initial repairs
Percent reported
Severity 1 Application does not run 24 hours 1
Severity 2 Major function disabled 48 hours 12
Severity 3 Minor function disabled 30 days 52
Severity 4 Cosmetic error 120 days 35
Factors influencing estimation of defect repairs:
Abeyant defects: For about 10 percent of incoming defect reports by clients, the software maintenance team can not make the same problem occur. These troublesome defects are based on some unique combination of events. The costs for finding and repairing abeyant defects may be an order of magnitude more expensive than normal defects of any given severity level, and the time required may also be stretched out significantly.
Invalid defects: For about 15 percent of incoming defect reports by clients, the error is not actually caused by the software application against which it has been reported.
Sometimes the client simply makes a mistake, sometimes the error is really a hardware problem, and sometimes the error is caused by some other software application and misdiagnosed. For commercial software packages with many users, at
least 15 percent of the time spent by customer-support personnel and 10 percent of the time spent by maintenance programmers is wrapped up with invalid defect reports.
Bad fix injection: Any time a software defect is repaired, there is a finite probability that the repair itself may contain a new defect. The general term for these derivative errors is bad fix, and they are surprisingly common. The observed range of bad fix injection runs from less than 1 percent of repaired defects to more than 20 percent, with the approximate US average being about 7 percent of repaired defects triggering a new defect. Bad fixes are less likely to occur when the application is well structured, and when the repairs are made carefully, without undue haste, by the experienced personnel.
Duplicate defects: For any software package with multiple users, it is very likely that more than one user will find and report the same problem. From an estimating standpoint, duplicate defect reports only need to be fixed once, of course. However, a substantial amount of customer-support time is devoted to dealing with these duplicates. For companies like Corel, Computer Associates, IBM or Microsoft, about 10 percent of customer-support time will go in dealing with multiple complaints about the same defect.
3.3. Error-prone Module Removal
Research at IBM in the 1960s discovered that software bugs in large systems are seldom randomly distributed. Instead, they tend to clump in a small number of very buggy portions, termed error-prone modules. As an example, in the 1970s IBM’s large database product, the Information Management system (IMS), contained 425 modules. About 300 of these modules never received a customer-reported bug. But 31 modules out of 425 received more than 2000 customer bug reports each year, or roughly 60 percent of the total bug reports against the entire product.
Error-prone modules may never stabilize because the bad fix injection rate can approach 100 percent, which means that each attempt to repair a bug may introduce a new bug. Error-prone modules are common among large poorly-structured systems and applications, and are very expensive to maintain that they should be eliminated completely. The cumulative costs of error-prone modules can be higher than those of normal modules by almost 500 percent.
The common reasons behind the existence of such error-prone modules are:
• Excessive schedule pressure
• Poorly trained programmers who lack knowledge of structured techniques
• Failure to utilize code inspections
• Failure to track defects well enough to realize that error prone modules were present
3.4. Customer Support
The role of customer support is one of interfacing between the clients and defect repair teams. This activity is mostly used for commercial softwares with multiple
customers themselves when they have problems or need to have questions answered.
The customer support personnel usually do not fix the problems themselves. For new problems, the customer support role is to record the symptoms and route the problem to the correct repair group.
Customer support estimates are based in part on the anticipated number of bugs in applications, but a more significant estimating variable is the number of users or clients. As a rough rule of thumb, assuming phone contact as the primary channel, 1 customer support person can handle monthly calls from roughly 150 clients, while for e-mails and electronic contacts the ratio can be 1 customer support person for 1000 clients, assuming software of average quality with no major defects at the time of release.
3.5. Code Restructuring
Code restructuring is usually done by automated tools, and has the effect of lowering complexity levels of software. Lowering the complexity, in turn, eases maintenance because it is faster and easier to find things in a well-structured software than in a highly complex software. So it is not an independent maintenance activity in itself, but a useful precursor to other maintenance activities. Usually restructuring does not degrade performance or introduce errors. However, some restructured applications do contain about 10 percent more code than they did previously.
3.6. Migration Across Platforms
Migration projects are those associated with moving an application from one platform to another. Examples of migration include porting an application from one operating system to another, or from one processor to another. Funding for migration projects varies from case to case, although a majority of migration projects for internal software are paid for by the user. For commercial software, migration is usually performed in order to expand markets or reach new ones.
If the tools are available for renovation and the specifications of the software are well-documented, migration can proceed at rates in excess of 50 function points per staff month. If the software is written in obscure languages, and if the specifications are missing or obsolete, migration may proceed at a rate of less than 5 function points per staff month.
3.7. Conversion to New Architectures
Conversion projects normally involve changes to interface or file structure of applications, such as switching from flat files to relational databases, or switching from a monolithic application to a client/server application. Since conversion projects often add features or facilities that benefit users, the users are often motivated to fund these projects. Quality of specifications plays a key role in determining productivity, also for the conversion projects. In case of missing or incomplete specifications, reverse engineering of the software may need to be performed to extract some of the
missing design information. Reverse engineering can be performed using automated tools.
3.8. Mandatory Changes
Mandatory changes are modifications to software made in response to changes in law or policy. For example, a change in tax rates or a change in health-care benefits will require modifications to many software packages. The source of funds for mandatory changes is ambiguous and can vary from case to case.
Mandatory changes are one of the more troubling forms of software maintenance because the costs are often high, the schedule pressure is intense, and there may be severe penalties for noncompliance. To make the matters worse, it is almost impossible to predict such mandatory changes in advance.
3.9. Performance Optimization
Optimization projects are normally performed for applications and systems with very high transaction rates, such as credit card processing or real time applications.
Optimization is concerned with minimizing delays in transactions by finding out sections that slow things down and taking appropriate optimization steps.
3.10. Enhancements
Enhancements are concerned with adding new features in existing software in response to explicit user requests. Since the new features meet new user requirements, the funding for enhancements is usually derived from user.
[Jones98] subdivides enhancements into major enhancements and minor enhancements. Minor enhancements are restricted to application updates that can be done in a calendar week or less, which implies a size of upto 5 function points. This size is sufficient for adding a new report or a new screen element. While the major enhancements are for the updates generally exceeding 20 function points. At this size, significant updates such as adding a completely new feature to a system are often found. Between updates that are definitely minor and those that are definitely major is an ambiguous zone that can be defined either way based on specific circumstances.
Annual rate of enhancements to existing applications averages a net increase in the function point totals of the applications of about 7 percent per year, although there are, of course, wide variations.
From an estimating standpoint, the difference between estimating a new project and estimating an enhancement is the fact that the current version of the application needs to be taken into account in the enhancement estimate, as the new features and the existing application need to be dealt with as a linked system. Sometimes the connection between the new feature and the existing application may be complicated and require small but significant modifications to a number of attachment points
For enhancements to large and poorly structured applications, the integration and testing costs can be very high for enhancements, than for an equivalent amount of new development work.
4. Maintenance Estimation Models
Following sub-sections discuss some of the commonly used maintenance estimation models. Details of most of these models are taken from [Boehm81].
4.1. COCOMO Maintenance Model for Software Maintenance Effort Estimation The basic assumption underlying the COCOMO maintenance model [Boehm81] is that software maintenance costs are determined by substantially the same cost driver attributes that determine software development costs. The quantity used to determine the equivalent of product size for software maintenance is the Annual Change traffic (ACT), that fraction of the software product’s source instructions, which undergo change during a (typical) year, either through addition or modification.
If all of the cost driver attribute effort multipliers for maintenance are the same as those for development, the resulting annual maintenance effort estimate is
(MM)AM = (ACT)(MM)DEV (MM)AM : Annual maintenance effort in man-month (MM)DEV : Development effort in man-month ACT : Annual change traffic
For Intermediate and Detailed COCOMO, this estimate may be modified due to different cost driver attribute effort multipliers. In such cases, the Maintenance Effort Adjustment Factor (EAF)M is computed as the product of modified effort multipliers.
The annual maintenance effort is then calculated as
(MM)AM = (EAF)M(ACT)(MM)NOM
(MM)NOM : Nominal development effort in man-month, calculated as (MM)NOM = 32. (KDSI)1.05 (Organic mode)
= 3.0 (KDSI)1.12 (Semidetached mode)
= 2.8 (KDSI)1.20 (Embedded mode)
4.2. Maintenance/Development Cost Ratio
The maintenance/development cost ratio M/D is used to estimate the overall life-cycle maintenance cost (MM)M, from acceptance test through phase out, as a function of actual or estimated development cost (MM)DEV
(MM)M = (M/D)(MM)DEV
The value of ratio M/D ranges from 0.67 to 4.5, depending on the type of software.
The Putnam SLIM model uses a value of 1.5 for the ratio M/D.
4.3. Cards-per-person Ratio
This ratio comes from the early days of software industry, and represented the number of cards each software personnel can maintain. Now this ratio is expressed in terms of (KDSI/FSP)M, thousands of source instructions maintained per full-time software person. Thus the number of maintenance personnel (FSP)M required to support a product of size (KDSI)DEV can be estimated as
(KDSI)DEV
(FSP)M = --- (KDSI/FSP)M
The annual maintenance effort (MM)AM is then simply (MM)AM = 12 (FSP)M
The value of ratio (KDSI/FSP)M can vary from 3 to 132, depending on the application type.
4.4. Maintenance Productivity Ratio
The maintenance productivity ratio (DSI/MM)MOD is the average number of instructions which can be modified per man-month of maintenance effort. It can be used to estimate the annual maintenance effort required for a product of size (DSI)DEV by means of the annual change traffic parameter ACT. Thus the number of source instructions to be modified per year (DSI)MOD/YR is given as,
(DSI)MOD/YR = (ACT)(DSI)DEV
And the annual maintenance effort (MM)AM can be estimated as (DSI)MOD/YR
(MM)AM = --- (DSI/MM)MOD
The average values of ACT and (DSI/MM)MOD over 487 business data processing installations [Boehm81] are obtained from the data as follows:
Average Size = 48 KDSI
Average Change/Year = 4.4 KDSI Average ACT = 4.4/48 = 0.092 Average (FSP)M = 1.52
Average (KDSI/FSP)M = 48/1.52 = 32
Average (DSI/MM)MOD = 4400/(12 x 1.52) = 241
5. Conclusion and Discussion
[Stutzke96] mentions an important point, “Software processes must produce software that can be gracefully evolved at reasonable costs. The choice of the software architecture significantly influences modifiability and hence maintainability.”
Also correctly pointed out by [CDS86], “All programs should be written with the expectation that they will be changed later. They should be judiciously modularized, well-commented, and written in proper style so that the effort required to understand them later in order to make changes is significantly less than that of starting over.”
Since we must comprehend what a program does before we can modify that program, the documentation and well-structuredness of the program play a key role to determine the ease of its maintainability. Also the employment of rigorous testing and quality assurance measures during development result in the reduced number of software defects at the time of delivery, thus lowering the maintenance costs. The use of modern programming practices that make it relatively easier to move an application from one environment to another also help in improving maintenance efficiency.
But as correctly stated by [Jones98], “Development estimating is a difficult problem, but estimating maintenance and enhancements is even more complex because of the very tricky relationship between the base application that is being modified and the changes being made to accommodate new features or repair defects.” Moreover the adaptive maintenance and also enhancements are anyway very difficult to predict in advance.
References
[Boehm81] Boehm B. “Software Engineering Economics”, Prentice Hall (1981).
[CDS86] Conte S.D., Dunsmore H.E. and Shen V.Y. “Software Engineering Metrics and Models”, Benjamin/Cummings Publishing Company (1986).
[Jones98] Jones T.C. “Estimating Software Costs”, McGraw Hill (1998).
[Jones02] Jones T.C. “Software Cost Estimation in 2002”, CrossTalk June 2002 (2002).
[MM83] Martin J. and McClure G. “Software Maintenance: The Problem and its Solutions”, Prentice Hall (1983).
[Stutzke96] Stutzke R.D. “Software Estimating Technology: A Survey”, CrossTalk May 1996 (1996).
![Figure 2: Software Development and Maintenance Costs in 487 Business Organizations [Boehm81]](https://thumb-eu.123doks.com/thumbv2/1library_info/4321821.1571922/4.892.78.409.463.742/figure-software-development-maintenance-costs-business-organizations-boehm.webp)
![Figure 3: Software maintenance production function [Boehm81]](https://thumb-eu.123doks.com/thumbv2/1library_info/4321821.1571922/5.892.140.753.423.851/figure-software-maintenance-production-function-boehm.webp)
![Figure 4: Distribution of software maintenance effort [Boehm81]](https://thumb-eu.123doks.com/thumbv2/1library_info/4321821.1571922/6.892.182.782.279.656/figure-distribution-of-software-maintenance-effort-boehm.webp)
![Table 1: Default Values for Maintenance Assignments Scopes and Production Rates (source [Jones98])](https://thumb-eu.123doks.com/thumbv2/1library_info/4321821.1571922/7.892.126.766.172.667/table-default-values-maintenance-assignments-scopes-production-rates.webp)