Prozessmodellen
Dissertation
zur Erlangung des Grades eines
Doktors der Wirtschaftswissenschaften (Dr. rer. pol.)
eingereicht an der
Fakultät für Wirtschaftswissenschaften der Universität Regensburg
vorgelegt von
M.Sc. Wirt.-Inf. Daniel Braunnagel
Berichterstatter:
Prof. Dr. Susanne Leist Prof. Dr. Bernd Heinrich
Tag der Disputation:
28.08.17
Inhaltsverzeichnis
1 Einleitung...1
1.1 Motivation und Problemstellung...1
1.2 Zielsetzung und Forschungsfragen...6
1.3 Aufbau der Arbeit...9
2 Wissenschaftliche Beiträge...13
2.1 Beitrag 1: BPM adoption in small and medium-sized companies in Bavaria...13
2.1.1 Introduction...14
2.1.2 Conceptual Basics...16
2.1.2.1 Related Work...16
2.1.2.2 Methodology...16
2.1.2.3 Case Studies...18
2.1.2.4 Survey...19
2.1.3 Results...21
2.1.3.1 BPM and Strategy...21
2.1.3.2 Process Purpose, Documentation, Quality and Capabilities...21
2.1.3.3 Process Controlling and Improvement...23
2.1.3.4 Overall evaluation...26
2.1.4 Discussion...29
2.1.5 Conclusion...34
2.2 Beitrag 2: Testing the Impact of Wand and Weber‘s Decomposition Model on Process Model Understandability...35
2.2.1 Introduction...36
2.2.2 Basics and Theoretical Foundations...38
2.2.2.1 Event-driven Process Chains...38
2.2.2.2 Understandability and Decomposition in Business Process Modeling...38
2.2.3 The Decomposition Model of Wand and Weber...42
2.2.3.1 Relevance of the Decomposition Model...42
2.2.3.2 The Decomposition Model and its Specification for eEPCs...43
2.2.4 Experimental Design for Testing the Decomposition Conditions...46
2.2.4.1 Scope, Context, Research Model and Hypotheses...47
2.2.4.2 Materials of the Experiment...51
2.2.4.3 Procedure, Setting and Participants of the Experiment...55
2.2.5 Results of the Experiment...56
2.2.5.1 Results Received...56
2.2.5.2 Validity...60
2.2.5.3 Interpretation of the Results...62
2.2.6 Summary, Limitations and Outlook...64
2.3 Beitrag 3: Metrics for evaluating decomposed process models based on Wand and Weber’s good decomposition model...66
2.3.1 Introduction...67
2.3.2 Basics and related work...70
2.3.2.1 Event-driven Process Chains and process model quality...70
2.3.2.2 Decomposition in process modeling and the relevance of Wand and Weber’s decomposition model...72
2.3.2.3 Differences in terms between the good decomposition model and process
modeling with eEPCs...74
2.3.3 Metrics...75
2.3.3.1 Procedure...75
2.3.3.2 Minimality...77
2.3.3.3 Determinism...81
2.3.3.4 Losslessness...88
2.3.3.5 Minimum coupling...92
2.3.3.6 Strong cohesion...98
2.3.3.7 Summary...102
2.3.4 Application of the metrics...103
2.3.5 Prototypical implementation...109
2.3.6 Discussion...110
2.3.6.1 Reflecting the metrics against Wand and Weber’s decomposition conditions110 2.3.6.2 Benefits and Restrictions...112
2.3.7 Conclusion and outlook...114
2.4 Beitrag 4: Analysing the Contribution of Coupling Metrics for the Development and Management of process architectures...116
2.4.1 Introduction...117
2.4.2 Basics and related work...120
2.4.2.1 Enterprise Architecture and Process Architecture...120
2.4.2.2 Coupling and Coupling metrics...122
2.4.3 Methodology...123
2.4.4 Analysis...126
2.4.5 Interpretation and Discussion...129
2.4.5.1 On the application of coupling metrics...129
2.4.5.2 On the definition of coupling...134
2.4.6 Implementation...135
2.4.7 Summary, limitations and outlook...137
2.5 Beitrag 5: Coupling and Process Modelling – An analysis at hand of the eEPC...139
2.5.1 Introduction...140
2.5.2 Basics and Definitions...142
2.5.2.1 Coupling...142
2.5.2.2 EEPC modeling...144
2.5.3 Methodology...145
2.5.4 Coupling metrics in the context of eEPC modeling...146
2.5.4.1 Process Coupling...146
2.5.4.2 Coupling of a module, intramodule coupling of a module...148
2.5.4.3 CBO, RFC...150
2.5.4.4 Direct Coupling, Indirect Coupling, and Total Coupling...152
2.5.4.5 Conceptual coupling...153
2.5.5 Implementation...155
2.5.6 Summary, limitations and outlook...156
2.6 Beitrag 6: Applying evaluations while building the artifact—Experiences from the development of process model complexity metrics...158
2.6.1 Introduction...159
2.6.2 Basics and related work...160
2.6.2.1 Design Science...160
2.6.2.2 Coupling Metrics...162
2.6.2.3 Development of Coupling Metrics...163
2.6.3 Methodology...164
2.6.3.1 DSR methods...164
2.6.3.2 Previous procedure...165
2.6.3.3 Applying the DSR Evaluation pattern...167
2.6.3.4 Evaluation criteria...169
2.6.3.5 Selected metrics...172
2.6.4 Evaluation...173
2.6.4.1 Exemplary application...173
2.6.4.2 Result...176
2.6.5 Discussion...177
2.6.6 Conclusion...179
2.7 Beitrag 7: The Effect of Coupling in EPC Models – A Laboratory Experiment...181
2.7.1 Introduction...182
2.7.2 Basics...184
2.7.3 Related Work...188
2.7.4 Method...189
2.7.4.1 Research Model...190
2.7.4.2 Instruments...191
2.7.4.3 Materials, Setting and Pre-test...193
2.7.5 Results...194
2.7.6 Discussion...196
2.7.7 Implications...198
2.7.8 Summary, limitations and outlook...200
3 Schlussbetrachtung...202
3.1 Zusammenfassung und Fazit...202
3.2 Kritische Würdigung...212
3.3 Ausblick...214
Abbildungsverzeichnis
Abbildung 1: Methodische Einordnung...10
Figure 2: Goal achievement of processes...23
Figure 3: Documentation measures and capabilities...23
Figure 4: Definition of process goals...24
Figure 5: Process goals and organizational integration (n=98)...24
Figure 6: PPM indicators used by SMEs...25
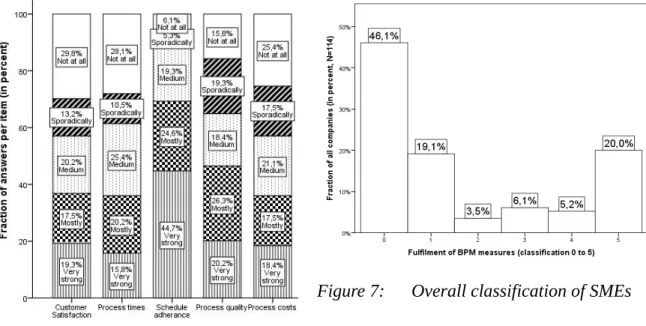
Figure 7: Overall classification of SMEs...25
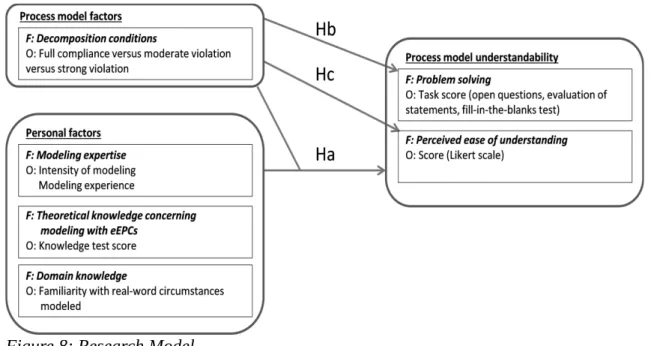
Figure 8: Research Model...48
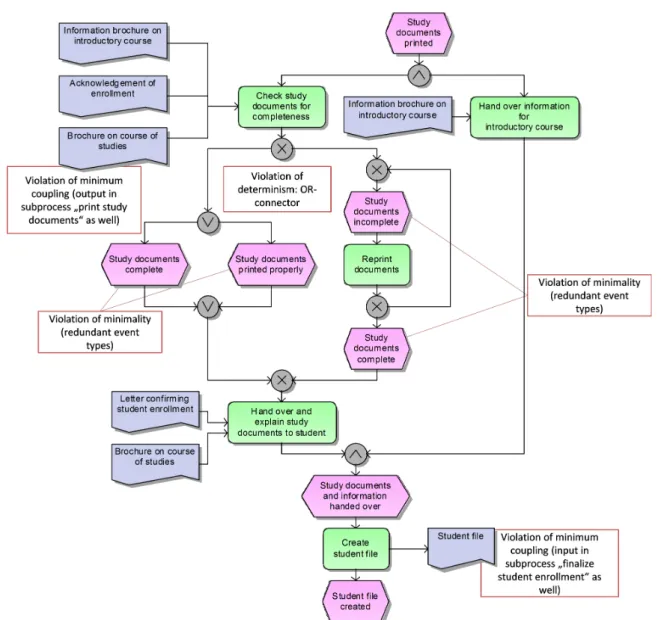
Figure 9: Subprocess "create student file" - model alternative C (strong violation)...53
Figure 10: Boxplots showing the difference between groups A, B and C...60
Figure 11: Subprocess model "trigger creation of student account" at a German university...71
Figure 12: Procedure of the research...76
Figure 13: Example of the minimality condition...79
Figure 14: Example of the determinism condition...85
Figure 15: Example of the losslessness condition...90
Figure 16: Example for the minimum coupling condition...95
Figure 17: Example of the strong cohesion condition...101
Figure 18: Assignment of metrics to cover the decomposition conditions...103
Figure 19: Overview of the decomposition alternatives in our use case...105
Figure 20: Implementation procedure...109
Figure 21: Method...124
Figure 22: Implementation procedure (Example for the metric “Process Coupling”)...135
Figure 23: Methodology...145
Figure 24: Transfer...146
Figure 25: Specification of the CFC metric (Cardoso 2005)...186
Figure 26: Specification of the WC metric (Vanderfeesten et al. 2007b)...186
Figure 27: Specification of the CC metric (Vanderfeesten et al. 2008a)...187
Figure 28: Preparation procedure and outline of the section...190
Tabellenverzeichnis
Tabelle 1: Bibliographische Angaben zu Beitrag 1...13
Table 2: Interviewed Companies...20
Table 3: Categories for the classification of maturity progress...20
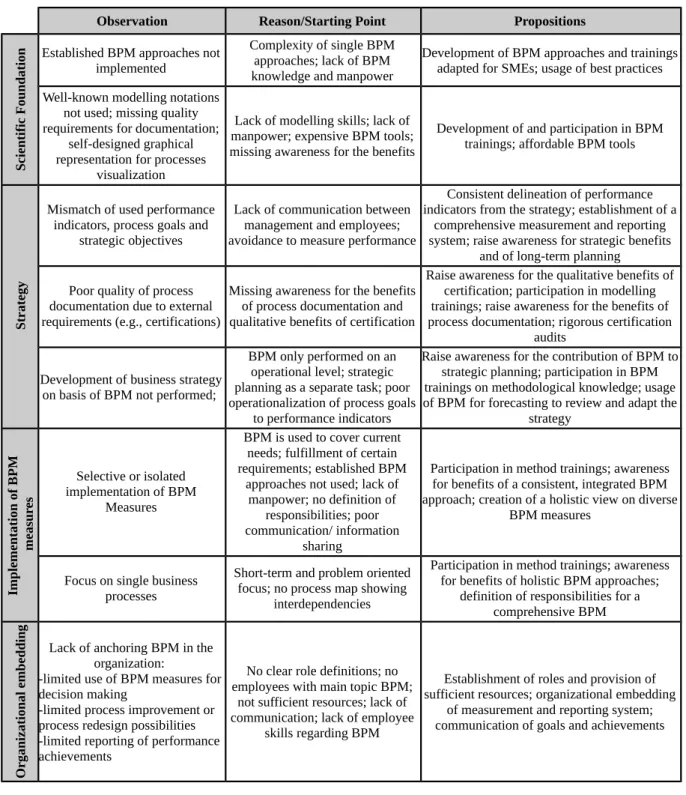
Table 4: Derivation of propositions...30
Tabelle 5: Bibliographische Angaben zu Beitrag 2...35
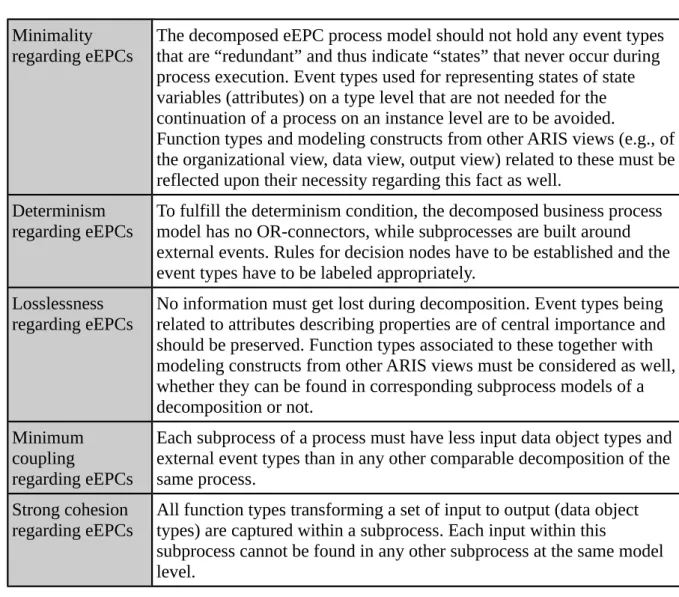
Table 6: The decomposition conditions...43
Table 7: The decomposition conditions specified for eEPCs (Johannsen & Leist 2012b)...45
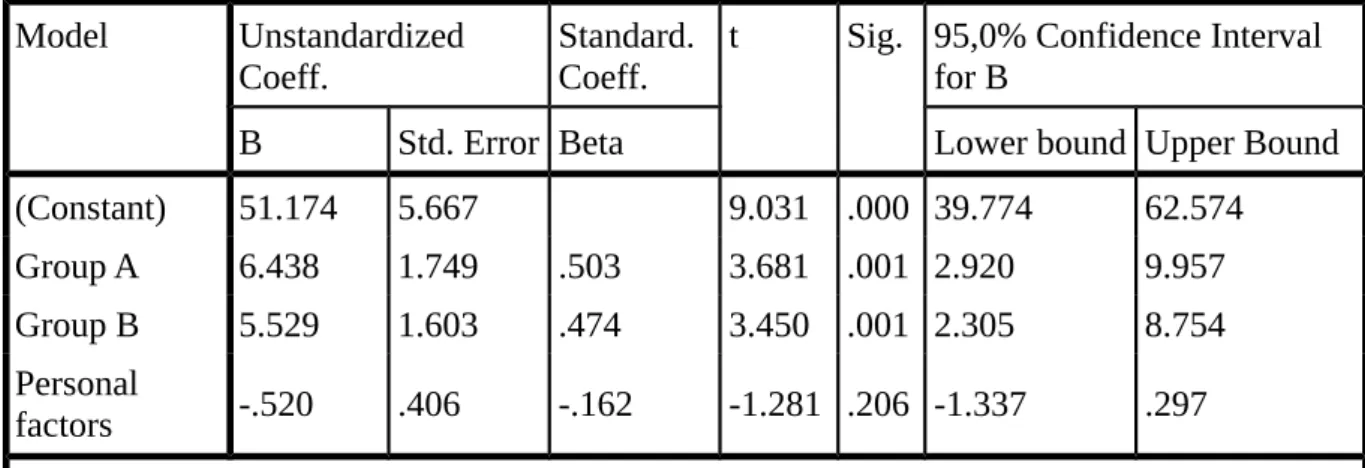
Table 8: Coefficients for H0a/H1a...58
Table 9: Coefficients for H0b/H1b...58
Table 10: Coefficients for H0c/H1c...59
Table 11: Coefficients for order of returned questionnaires...63
Tabelle 12: Bibliographische Angaben zu Beitrag 3...66
Table 13: Average ratio of “redundant” event types for subprocess models on a specific model level —metric 1...80
Table 14: Average ratio of “redundant” event types for subprocess models across model levels of a decomposition—metric 2...81
Table 15: Average ratio of OR splits of subprocess models on a specific model level—metric 3...86
Table 16: Average ratio of OR splits of subprocess models across all model levels of a decomposition—metric 4...86
Table 17: Ratio of missing “external event types” of a decomposition—metric 5...87
Table 18: Ratio of missing “non redundant event types” of a decomposition—metric 6...91
Table 19: Ratio of “coupled pairs of function types” across subprocess models on a model level— metric 7...96
Table 20: Average ratio of “coupled pairs of function types” for a model level—metric 8...96
Table 21: Average number of external event types for subprocess models on a model level—metric 9...97
Table 22: Average number of external event types for subprocess models of the decomposition— metric 10...98
Table 23: Ratio of “duos of function types” sharing a common input data object type across subprocess models on a model level—metric 11...101
Table 24: Average ratio of “duos of function types” sharing a common input data object type for a model level—metric 12...102
Table 25: Calculation results...108
Tabelle 26: Bibliographische Angaben zu Beitrag 4...116
Table 27: Grouped literature review results...124
Table 28: Metrics and their main features...127
Table 29: Classification of coupling metrics...131
Tabelle 30: Bibliographische Angaben zu Beitrag 5...139
Table 31: Grouped literature review results...146
Table 32: Conceptual Mapping...151
Tabelle 33: Bibliographische Angaben zu Beitrag 6...158
Table 34: Comparison of different DS approaches (cf. Fischer & Gregor 2011)...165
Table 35: Measures and properties...176
Tabelle 36: Bibliographische Angaben zu Beitrag 7...181
Table 37: Hypothesis Tests for Ha...195
Table 38: Hypothesis Tests for Hb, Hc, Hd...196 Table 39: R-Values for the Coupling Metrics and Instruments...196
Abkürzungsverzeichnis
ARIS Architektur integrierter Informationssysteme BPM Business Process Management
BWW Bunge Wand Weber CFC Control Flow Complexity CLT Cognitive load theory CM Coupling of a Module CoC Conceptual Coupling CrC Cross Connectivity
CBO Coupling Between Objects DC Direct Coupling
DS Design Science
DSR Design Science Research
eEPC extended event-driven process chain eEPK Erweiterte ereignisgesteuerte Prozesskette FF Forschungsfrage
GDC Good Decomposition Conditions
GOM Grundsätze ordnungsmäßiger Modellierung GPM Geschäftsprozessmodell
GQM Goal Question Metric IC Indirect Coupling ICM Intramodule Coupling
IS Informationssystem / Information System ISO International organization for standardization PC Process Coupling
PPM Process performance Management RFC Response for a Class
SESE Single entry, single exit SME Small- and medium enterprise TC Total Coupling
WC Weighted Coupling
ZHAW Züricher Hochschule für angewandte Wissenschaften
1 Einleitung
1.1 Motivation und Problemstellung
“A model […] allows us to deal with the world in a simplified manner, avoiding the complexity, danger and irreversibility of reality” (Rothenberg 1989, S. 75)
Nach (Schütte & Rotthowe 1998, S. 59) lässt sich ein Modell als „[…] das Ergebnis einer Konstruktion eines Modellierers, der für Modellnutzer eine Repräsentation eines Originals zu einer Zeit als relevant mit Hilfe einer Sprache deklariert“ definieren. Für die hier gegenständ- lichen Geschäftsprozessmodelle (GPM) lässt sich weiter einschränken, dass eine Repräsenta- tion eines Geschäftsprozesses erstellt wird. Dieses wiederum kann exemplarisch anhand von (Davenport 1993, S. 5) definiert werden, wonach ein Geschäftsprozess eine Struktur betriebli- cher Aufgaben mit Ort, Zeit, Anfang und Ende, definierten benötigten Ressourcen und produ- zierten Leistungen sei. Die Struktur betrieblicher Aufgaben in einem (Geschäfts-) Prozessmo- dell wird von (Keller et al. 1992) auch als Kontrollfluss bezeichnet.
Die Nützlichkeit von Prozessmodellen ist seit einiger Zeit bekannt (vgl. Nordsieck 1962).
Prozessmodelle werden erstellt und verwendet, um bspw. das Verständnis von, und das Ge- spräch über Geschäftsprozesse zu fördern, um Geschäftsprozesse zu planen, oder um sie zu verbessern (vgl. Kawalek & Kueng 1997; Nordsieck 1962). Die Notwendigkeit dafür ist eine Folge der aktuellen Entwicklung des Marktumfeldes vieler Unternehmen, das durch steigen- den Optimierungsdruck geprägt ist. Die globale Verfügbarkeit von Dienstleistungen, Waren und Informationen erhöht das Preis- und Qualitätsbewusstsein der Kunden, so aber auch der Wunsch nach Differenzierung und Individualisierung. In der Folge müssen Unternehmen zu- nehmend komplexere Abläufe kosteneffizienter bewältigen und stets neue Ansprüche berück- sichtigen. (Becker 2000) Um die notwendige Anpassung kontrolliert durchführen zu können, wurden Managementansätze entwickelt, die eine ingenieurmäßige Weiterentwicklung des Un- ternehmens (bspw. Österle 1995) oder der Prozesse (bspw. Davenport 1993; Hammer &
Champy 2002; Becker 2000) verfolgen und dabei auf die Prozessmodellierung zurückgreifen.
Folglich treffen Prozessmodelle in Unternehmen (Harmon & Wolf 2014) wie in der For- schung (van der Aalst 2012) auf reges Interesse.
Unternehmen verwenden Prozessmodelle u. a., um betriebliche Prozesse zu entwerfen, zu ver- bessern, alternative Entwürfe zu bewerten oder um auf ihrer Grundlage zu entwickelnde IT- Systeme zu spezifizieren (Kawalek & Kueng 1997). Dabei ist die Qualität der Modelle ent- scheidend für den Erfolg der Initiativen (Moody 2005). Wenn Prozessmodelle für den Anwen- der schwer verständlich sind, läuft dieser Gefahr, den modellierten Sachverhalt falsch zu ver- stehen, was wiederum bspw. zu Fehlern in Implementierungen von Geschäftsprozessen und Systemen oder zu einer falschen Bewertung und Entscheidung von alternativen Entwürfen führen kann (vgl. Gruhn & Laue 2006b; Vanderfeesten et al. 2007a; Mendling 2008; Mend- ling & Strembeck 2008; Gruhn & Laue 2007; Houy et al. 2012; Fettke et al. 2012). Daraus re- sultierende Schäden können, besonders wenn solche Fehler in frühen Phasen der Planung auf- treten und lange unbemerkt bleiben, erheblich ausfallen, hohe Kosten verursachen, die Anpas- sung des Unternehmens an Änderungen im Marktumfeld erschweren und den Nutzen der Mo- dellierungsanstrengungen erheblich einschränken (vgl. Briand & Wust 2001).
Dies macht „Verständlichkeit“ zu einer wichtigen Qualitätsdimension von Geschäftsprozess- modellen (Houy et al. 2014). Eine einheitliche Definition für den Begriff der Verständlichkeit (von Prozessmodellen) hat sich in der Wirtschaftsinformatik zum aktuellen Zeitpunkt nicht etabliert. Aufbauend auf einer umfassenden Analyse der im Zusammenhang mit Prozessmo- dellverständlichkeit verwendeten Definitionen für den Begriff, wird Verständlichkeit von Houy et al. (2012, S. 66) definiert, dass Verständlichkeit sich „aus der Anstrengung ergäbe ein Modell korrekt zu lesen und zu interpretieren, was wiederum ein kognitiver Prozess sei, bei dem den verschiedenen Bestandteilen eines konzeptuellen Modells eine Bedeutung zugewie- sen werde.“1 (vgl. Houy et al. 2012, S. 66). Das Ergebnis dieses kognitiven Prozesses zeigt sich im Wissen, genauer in den mentalen Modellen von Sachverhalten, die sich ein Modell- nutzer erschafft und die es ermöglichen Probleme kreativ zu lösen (Mayer 1989). Es ist anzu- merken, dass die Forschung zur Prozessmodellverständlichkeit von einem Pluralismus an Theorien geprägt ist, welche wiederum den Begriff „Verständlichkeit“ unterschiedlich ausle- gen (Houy et al. 2014). Für diese Arbeit hervorzuheben sind zwei dieser Theorien2, die Bun- ge-Wand-Weber Ontologie (Wand & Weber 1990b) und die Cognitive-Load Theory (Sweller
1 Übersetzung erfolgte durch den Autor. Im Original: „[Understandability] is related to the ease of use, respectively the effort for reading and correctly interpreting a conceptual model, which is a cognitive process of assigning meaning to the different parts of a conceptual model“ Houy et al. 2012, S. 66
2 Vgl. Houy et al. 2014 für eine Übersicht.
1988). Eine detaillierte Beschreibung der Theorien findet sich auf Seite 42 (Bunge-Wand-We- ber Ontologie) und auf Seite 184 (Cognitive-Load Theory).
Die Notwendigkeit, die Qualität von Prozessmodellen in der Praxis bewerten und letztlich steigern zu können, motiviert die Operationalisierung dieser Theorien sowie die Entwicklung weiterer Ansätze wie bspw. Qualitätsframeworks (vgl. Schütte 1998; Krogstie et al. 2006), Sammlungen praktischer Empfehlungen (vgl. Mendling et al. 2010; Sharp & McDermott 2009), oder aber Metriken (vgl. Vanderfeesten et al. 2007a; Overhage et al. 2012), die den Modellierer unterstützen sollen.
Qualitätsframeworks wie bspw. die Grundsätze ordnungsmäßiger Modellierung (Schütte 1998) oder das SEQUAL Framework (Krogstie et al. 2006) explizieren ihre Auffassung von Modellqualität anhand von Dimensionen wie bspw. Konstruktions- und Sprachadäquanz oder aber Knowledge Quality und Domain Quality. Diese Dimensionen beschreiben Relationen, bspw. zwischen Modellersteller und Modellnutzer, oder aber zwischen Nutzerwissen, Modell und Domäne, für die möglichst Konsens bzw. Übereinstimmung anzustreben sei, um hohe Modellqualität zu erreichen. Mit welchen konkreten Maßnahmen dieses Ziel wiederum zu er- reichen sei, das wird von den Verfassern nicht vorgegeben. Diese zu finden bleibt dem An- wender überlassen. Zwar ermöglicht dies eine flexible, situative Anwendung des Frameworks.
Das Erkennen passender Maßnahmen ist aber stets mit Aufwand verbunden und wird durch den Wissens- und Erfahrungshintergrund des Anwenders stark beeinflusst.
Sammlungen praktischer Empfehlungen nennen konkrete Anforderungen an qualitativ hoch- wertige Modelle, bspw., dass Prozessmodelle aufzuteilen seien, wenn diese mehr als 50 Ele- mente besäßen (Mendling et al. 2010), oder, dass stets s.g. Swimlane-Diagramme zu verwen- den seien (Sharp & McDermott 2009). Diese Anforderungen kommen Maßnahmen gleich und lassen sich oft ohne weitere Interpretation anwenden. Jedoch ist die fehlende Flexibilität in der Anwendung leicht zu erkennen. So sind Swimlanes bspw. nicht angemessen, wenn kein Zuordnungsmerkmal modelliert wird. Und während 50 Elemente in einem Modell einen An- wender überfordern, geht anderen Anwendern der Zusammenhang zwischen vielen „kleinen“
Modellen verloren (vgl. „Split Attention Effekt“ Zugal 2013).
Hinsichtlich der einfachen und flexiblen Anwendung können Metriken als dritter Weg gese- hen werden. Sie sind häufig automatisiert berechenbar und erlauben damit die einfache Be- wertung von einer großen Anzahl an Modellen (Braunnagel & Johannsen 2013) (vgl. Malino- va et al. 2013). Ob Maßnahmen notwendig sind oder nicht kann wiederum situativ vor dem Hintergrund des Wertes der Metrik und der Fähigkeiten des Anwenders entschieden werden, wobei konkrete Verbesserungsmaßnahmen von den Metriken nicht vorgegeben werden. Sie stellen das Mittel der Wahl dieser Arbeit dar. Exemplarisch für eine Metrik sei die Cross Connectivity Metrik (Vanderfeesten et al. 2008a) genannt. Diese berechnet die durchschnittli- che Anzahl an Pfaden zwischen zwei Elementen im Kontrollfluss eines Prozessmodells. Da- mit soll eine Aussage über dessen Komplexität und ferner über die Verständlichkeit des Mo- dells getroffen werden.
Für eine möglichst umfassende Betrachtung müssen sowohl die Syntax als auch die Semantik eines Modells berücksichtigt werden. Ein Beispiel für die Bewertung anhand der Semantik findet sich in den Arbeiten von Johannsen und Leist (vgl. Johannsen & Leist 2012b) zur Be- wertung von Prozessmodelldekompositionen, einer verbreiteten Maßnahme zur Verbesserung der Modellverständlichkeit, auf Basis der Good Decomposition Conditions (GDC). Diese operationalisieren die o.g. Bunge-Wand-Weber Ontologie (Johannsen & Leist 2012b).
Die Dekomposition ist eine von vielen gängigen Modellierungssprachen unterstützte Maßnah- me zur Verbesserung der Verständlichkeit der Prozessmodelle. Dabei wird der zu modellieren- de Inhalt derart über Ebenen mit steigendem Detailgrad verteilt, dass Elementen in einem Mo- dell mit niedrigem Detailgrad ein Modell auf einer Ebene mit hohem Detailgrad zugeordnet wird, sodass dieses detaillierte Modell ein Element genauer beschreibt (Reijers et al. 2011) (vgl. Polyvyanyy et al. 2008). Vergleichbar mit einer Landkarte, die bei grobem Maßstab vor allem einen Überblick zur Orientierung vermittelt und bei feinem Maßstab die Details, soll ein Prozessmodell mit niedrigem Detailgrad überblicksartig die grobe Struktur des Prozesses bspw. für strategische Entscheidungen aufzeigen, während, bspw. für die genaue Analyse des Prozesses, weitere Modelle detaillierte Beschreibungen enthalten (Polyvyanyy et al. 2008).
Modelle hierarchisch strukturierter Detailgrade können erstellt werden, indem Elemente eines detailarmen Prozessmodells sukzessive durch detailliertere Modelle verfeinert werden (vgl.
Reijers et al. 2011), oder aber indem ausgehend von der Menge aller Elemente mit höchster Detaillierung diese Elemente nach Zusammengehörigkeit partitioniert werden und jede Parti-
tion durch ein einzelnes Element in einem Modell niedrigerer Detailstufe abstrahiert wird und dieser Vorgang iterativ für Elemente der neu gewonnenen Ebene wiederholt wird (vgl. Poly- vyanyy et al. 2008).
Während einerseits die Zielsetzung der Dekomposition, eine Strukturierung von Detailstufen, in der Literatur beschrieben ist, finden sich andererseits wenige Hinweise darauf, wie eine er- folgte Dekomposition zu bewerten ist (Burton-Jones & Meso 2006) (vgl. Reijers et al. 2011).
Um diese Lücke zu schließen, wenden (Johannsen & Leist 2012b) die s.g. Good Decompositi- on Conditions nach (Weber 1997) an, mit dem Ziel daraus Kriterien zur Bewertung einer De- komposition zu entwickeln. Die GDC basieren auf dem Formalismus einer Dekomposition (Wand & Weber 1989a), welche Teil des ontologischen Modells für Informationssysteme (Wand & Weber 1990a) ist, das wiederum auf der Ontologie von Bunge-Wand-Weber basiert (Weber 1997). Die GDC spezifizieren fünf Anforderungen an die Dekomposition eines Infor- mationssystemmodells, die von (Johannsen & Leist 2012b) für die eEPK formuliert werden.
Bspw. sei das transferierte Losslessness-Kriterium genannt, das besagt, dass in einer Dekom- position keine Informationen verloren gehen dürfen, und, insbesondere Ereignisse der Pro- zessausführung bewahrt werden müssen (Johannsen & Leist 2012b).
Die GDC nach (Johannsen & Leist 2012b) sind die theoretische Grundlage eines Schwer- punktes dieser Arbeit. So ist nach der theoretischen Arbeit von (Johannsen & Leist 2012b) noch nicht ermittelt, ob die Einhaltung der bzw. der Verstoß gegen die Kriterien tatsächlich mit einem messbaren Einfluss auf die Verständlichkeit einhergeht. Weiter setzen die GDC in der Form von (Johannsen & Leist 2012b) eine manuelle Prüfung der Einhaltung voraus, was gerade in Verbindung mit einer hohen Anzahl von Modellen, bspw. in Prozessarchitekturen eine Einschränkung darstellt (vgl. Malinova et al. 2013).
Neben der Semantik nimmt auch die Syntax Einfluss auf die Verständlichkeit von Prozessmo- dellen. Tatsächlich finden sich in der Literatur Metriken zur Evaluation konzeptueller Modelle anhand deren Syntax, insbesondere im Software-Engineering (vgl. DeMarco & Boehm 1982;
Fenton & Pfleeger 1998; Halstead 1977; Henderson-Sellers 1996; McCabe 1976). Bezogen auf Prozessmodelle ist die Entwicklung weniger fortgeschritten. So beschreibt (Vanderfeesten et al. 2007a) eine erste Klassifikation, welche wiederum aus dem Software-Engineering abge- leitet ist. Die Autoren schlagen vor, Metriken in die Klassen „Coupling“, „Cohesion“,
„Complexity“, „Modularity“ und „Size“ zu unterteilen (Vanderfeesten et al. 2007a). Die erste Klasse, „Coupling“, wird dabei definiert als ein Maß für die Stärke des Zusammenhangs, der sich aus Verbindungen zwischen Modulen ergibt, sowie aus Art und Kompliziertheit der Ver- bindungen (Vanderfeesten et al. 2007a). Auch diese Definition ist aus dem Software-Enginee- ring abgeleitet. Bezogen auf Prozessmodelle lässt sie im unklaren, welche Verbindungen ge- meint sind, was Module sind, oder was in diesem Kontext Kompliziertheit ist.
Für diese Klasse existieren im Vergleich zu bspw. den Klassen „Complexity“ und „Size“ ver- hältnismäßig wenige Metriken (González et al. 2010) (vgl. Mendling 2008), obwohl erste em- pirische Untersuchungen einen Zusammenhang mit der Verständlichkeit von Prozessmodellen aufzeigen (Vanderfeesten et al. 2008a). Um weitere Metriken zu finden, wird in (Braunnagel
& Johannsen 2013) zunächst diskutiert Couplingmetriken aus dem Software-Engineering für die Anwendung auf Geschäftsprozessmodelle zu transferieren. Weiter werden Ideen für Metri- ken skizziert, die aus einem solchen Transfer entstehen können. Trotz der Skizzenhaftigkeit zeigt sich in dieser Arbeit bereits die Heterogenität der Metriken bezüglich ihrer Aussage und Anwendung, aber auch bezüglich der theoretischen Grundlagen. Manche Metriken operatio- nalisieren die o.g. Cognitive-Load Theory, andere Metriken wiederum wenden ein Text-Mi- ning Verfahren an. Die Aussagen der möglichen Metriken beziehen sich teils auf die Verständ- lichkeit der konzeptuellen Modelle, teils auf funktionale Redundanz in den Prozessen. Jedoch sind die skizzierten Metriken in Folge dieses Beitrages noch nicht anwendbar. Ihre konkrete Entwicklung ist der zweite Schwerpunkt dieser Arbeit.
Zusammenfassend besteht die Problemstellung dieser Arbeit darin, Instrumente zur Bewer- tung der Verständlichkeit von Prozessmodellen zu entwickeln. Die vorgestellten Ergebnisse haben zwei Ansatzpunkte: Einerseits adressiert Coupling vorwiegend die Verständlichkeit der Syntax bestehender Prozessmodelle. Demgegenüber adressiert die Dekomposition eine Maß- nahme zur Verbesserung der Verständlichkeit und die Bewertung anhand der GDC die Seman- tik der Modelle.
1.2 Zielsetzung und Forschungsfragen
Die oben skizzierte Problemstellung leitet die beiden Zielsetzungen dieser Arbeit ein: Die Entwicklung von Metriken zur Messung der Prozessmodellverständlichkeit, einerseits auf Ba-
sis der Good Decomposition Conditions, und andererseits anhand der Qualitätsdimension
„Coupling“.
Ausgangspunkt der Arbeit ist die Frage nach dem Bedarf an Forschung im Bereich BPM.
Während bereits ausgeführt wurde, warum lt. herrschender Meinung in der Forschung BPM für Unternehmen in der aktuellen Marktsituation besondere Relevanz hat, soll zunächst ermit- telt werden, inwieweit Unternehmen Methoden und Techniken des BPM tatsächlich einsetzen.
So sollen die aktuelle Verbreitung sowie Gründe warum oder warum nicht Methoden und Techniken eingesetzt werden empirisch erhoben werden. Hieraus folgt die erste Forschungs- frage (FF):
• Forschungsfrage 1: Zu welchem Grad setzen Unternehmen BPM Maßnahmen ein und welche Faktoren motivieren oder behindern den Einsatz von BPM in Unterneh- men?
Im Schwerpunkt Good Decomposition Conditions soll die Arbeit von (Johannsen & Leist 2012b) so fortgeführt werden, dass die Conditions zu Metriken weiterentwickelt werden.
Hierfür ist es notwendig die GDC empirisch dahingehend zu untersuchen, ob die Einhaltung der GDC bzw. der Verstoß dagegen einen messbaren Einfluss auf die Verständlichkeit dekom- ponierter Prozessmodelle hat, zunächst unter den Idealbedingungen einer Laborsituation.
Grund hierfür ist, dass ein Artefakt, dass seine Tauglichkeit unter Idealbedingungen nicht zei- gen kann, im praktischen Einsatz ebenfalls keine Tauglichkeit erwarten lässt. In diesem Fall wäre es angezeigt, die theoretischen Vorarbeiten zu hinterfragen. Hieraus folgt die For- schungsfrage.
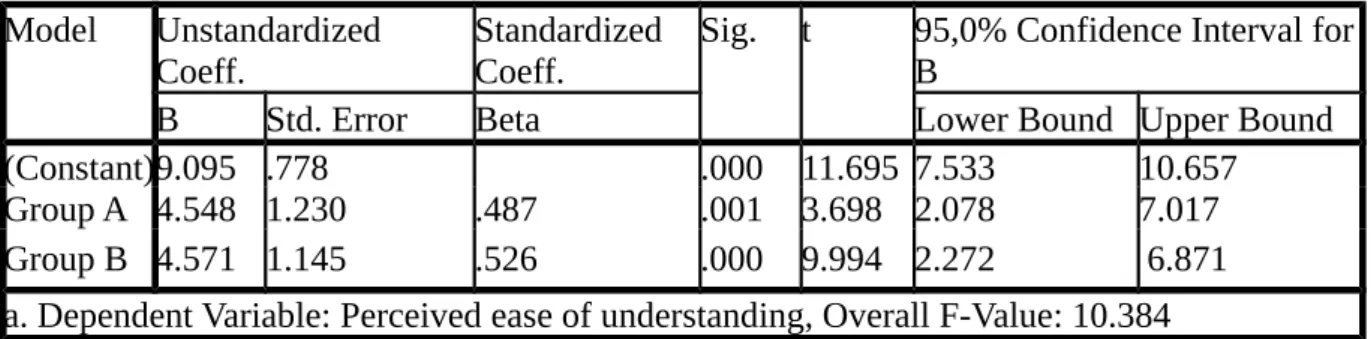
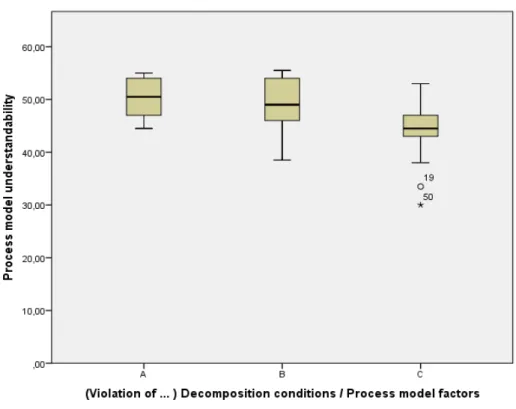
• Forschungsfrage 2: Haben Verstöße gegen die Good Decomposition Conditions nach (Johannsen & Leist 2012b) einen Einfluss auf die Verständlichkeit von Prozessmodel- len?
Die GDC, in der von (Johannsen & Leist 2012b) vorgestellten Form kommen in ihrer Ver- wendung den oben diskutierten Sammlungen praktischer Empfehlungen gleich. Sie sind Kri- terien für die Bewertung und gleichzeitig Empfehlungen für die Durchführung der Dekompo- sition. Ebenfalls bereits diskutiert wurden die Vorteile von Metriken, insbesondere, dass diese
die Bewertung einer großen Anzahl an Modellen erleichtern, während die Interpretation situa- tionsgerecht vom Anwender vorgenommen werden kann. Es soll also im Sinne der prakti- schen Verwendbarkeit der GDC untersucht werden, ob sich diese geeignet als Metriken for- mulieren lassen. Hieraus folgt die nächste Forschungsfrage:
• Forschungsfrage 3: Welche Metriken lassen sich aus den Good Decomposition Con- ditions ableiten, um Modellierer bei der Dekomposition von Prozessmodellen zu un- terstützen?
Dem Forschungsschwerpunkt Coupling liegen Arbeiten aus dem Software-Engineering und die skizzenhafte Beschreibung in (Braunnagel & Johannsen 2013) zugrunde, die der Untersu- chung von Coupling in der Prozessmodellierung in mehrfacher Hinsicht dienlich sind. Zu- nächst ist der Begriff „Coupling“ im Zusammenhang mit Prozessmodellen bisher nur vage de- finiert, jedoch kommt in jeder Coupling Metrik eine spezifische Auslegung zum Ausdruck.
Eine genauere Untersuchung des Begriffsverständnisses in der Literatur soll zu einer präzise- ren Definition führen. Weiter ist es für die Entwicklung von Coupling Metriken notwendig, Anforderungen an das Artefakt zu spezifizieren. Hierfür ist es besonders wichtig zu ermitteln, welche Problemstellungen im Einsatz von BPM mit Coupling Metriken adressiert werden können, um eine Zielsetzung für das Artefakt festzulegen, und welche Anforderungen dabei bestehen. Hieraus folgt Forschungsfrage vier.
• Forschungsfrage 4: Wie kann Coupling im Kontext von Geschäftsprozessmodellen definiert werden und was sind mögliche Einsatzszenarien für und Anforderungen an Coupling Metriken im praktischen Einsatz?
Für die Entwicklung der Coupling Metriken für Geschäftsprozessmodelle soll auf bereits er- probte und etablierte Metriken zurückgegriffen werden, wie bspw. solche, die für konzeptuelle Modelle im Software-Engineering entwickelt wurden. Um sicherstellen zu können, dass das ursprüngliche Verständnis von Coupling möglichst erhalten bleibt bzw. weiterhin eine sinn- volle Messung stattfindet, muss die Methode für den Transfer den Qualitätsaspekt der Coup- ling begründet, separat ermitteln. Auf die bestehenden Metriken angewandt, können so Coup- ling Metriken für Geschäftsprozessmodelle entwickelt werden. Es folgt daher als fünfte For- schungsfrage:
• Forschungsfrage 5: Wie und welche Coupling Metriken, bzw. der jeweils gemessene Qualitätsaspekt, aus verwandten Disziplinen lassen sich für Prozessmodelle operatio- nalisieren?
Bei der Entwicklung von Artefakten kommt der Evaluation eine besondere Wichtigkeit zu (Sonnenberg & Vom Brocke 2012a). Dem wird in dieser Arbeit Rechnung getragen, indem die Metriken auf zwei Arten evaluiert werden. Zunächst soll der Konstruktionsprozess der Metriken anhand von Kriterien in der Theorie evaluiert werden, um den Stand der Forschung adäquat zu berücksichtigen. Anschließend soll empirisch der Frage nachgegangen werden, ob die Metriken tatsächlich eine Veränderung in der Verständlichkeit von Geschäftsprozessmo- dellen anzeigen. Daraus folgen Forschungsfrage sechs und sieben.
• Forschungsfrage 6: Erfüllt die Konstruktion der Metriken bekannte Kriterien aus der Forschung?
• Forschungsfrage 7: Zeigen die Coupling Metriken eine verminderte oder verbesserte Verständlichkeit von Prozessmodellen an?
1.3 Aufbau der Arbeit
Um die Lösung zu o.g. Forschungsfragen zu präsentieren, ist diese Arbeit wie folgt aufgebaut.
Auf die vorausgehende Vorstellung von Motivation, Problemstellung und Forschungsfragen in Kapitel 1 hin, werden in Kapitel 2 die einzelnen Forschungsfragen bearbeitet. Kapitel 3 fasst die Arbeit zusammen. Weiter werden dort auch die Ergebnisse kritisch gewürdigt und ein Ausblick auf weiteren Forschungsbedarf gegeben.
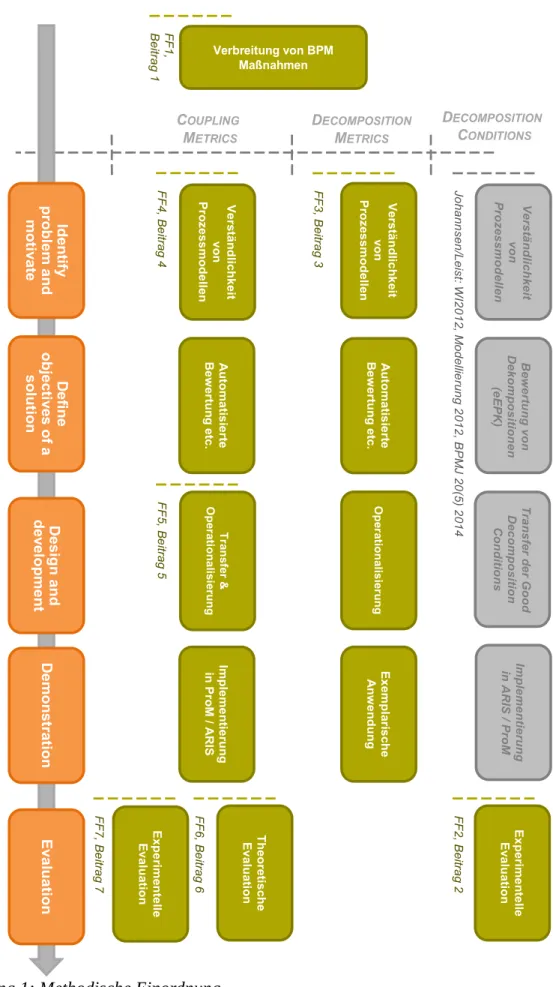
Abbildung 1 zeigt auf, wie die Beiträge in Kapitel 2 den einzelnen Forschungsfragen und den inhaltlichen Schwerpunkten „Coupling“ und „Dekomposition“ zugeordnet sind. Darüber hin- aus nimmt Abbildung 1 eine methodische Einordnung der Beiträge vor. In beiden Schwer- punkten wird das Ziel verfolgt Artefakte zu entwickeln. Im Schwerpunkt „Coupling“ werden, wie vorher beschrieben, Coupling Metriken entwickelt, während im Schwerpunkt „Dekompo- sition“ die Conditions für die eEPK sowie die Metriken als Artefakte entwickelt werden.
Abbildung 1: Methodische Einordnung
Identifyproblem andmotivate Defineobjectives of asolution Design anddevelopment DemonstrationEvaluation VerständlichkeitvonProzessmodellen Bewertung vonDekompositionen(eEPK) Transfer der GoodDecompositionConditions Implementierungin ARIS /ProM ExperimentelleEvaluation
VerständlichkeitvonProzessmodellen AutomatisierteBewertungetc. Operationalisierung ExemplarischeAnwendung
Transfer &Operationalisierung ImplementierunginProM/ ARIS TheoretischeEvaluation
AutomatisierteBewertungetc. VerständlichkeitvonProzessmodellen Johannsen/Leist: WI2012, Modellierung 2012, BPMJ 20(5) 2014FF2, Beitrag 2
FF3, Beitrag 3
FF4, Beitrag 4FF5, Beitrag 5 FF6, Beitrag 6
ExperimentelleEvaluation
FF7, Beitrag 7
Verbreitung von BPM Maßnahmen
FF1,Beitrag 1
DECOMPOSITION
CONDITIONS
DECOMPOSITION
METRICS
COUPLING
METRICS
Aus methodischer Sicht lässt sich der Zusammenhang der Beiträge anhand der Design Sci- ence Methode nach (Peffers et al. 2006) erläutern, welche für den Forschungsprozess hin- sichtlich der Artefaktentwicklung die folgenden Schritte vorschlägt:
1. Problem identifizieren und Lösung motivieren 2. Zielsetzung der Lösung definieren
3. Entwurf und Entwicklung 4. Demonstration
5. Evaluation
6. Kommunikation der Ergebnisse
Als Motivation für beide Schwerpunkte kann die empirische Erhebung des ersten Beitrages herangezogen werden. So folgt aus diesem u. a. die Erkenntnis, dass viele Unternehmen auf den Einsatz von BPM und Prozessmodellierung verzichten, weil gute Prozessmodelle nur kompliziert zu erreichen sind (vgl. Kapitel 2.1.4). Daraus wird im Rahmen dieser Arbeit die Notwendigkeit abgeleitet, zusätzliche Hilfestellung für das Modellieren von Prozessen zu bie- ten.
Im Schwerpunkt „Dekomposition“ liegen dem Design Science Prozess Publikationen zugrun- de, die nicht Teil dieser Arbeit sind. In den Beiträgen (Leist & Johannsen 2012; Johannsen &
Leist 2012a, 2012b; Johannsen et al. 2014b) wird die Entwicklung damit motiviert, dass die Verständlichkeit von Prozessmodellen für den Unternehmenserfolg entscheidend sei, sowie die Anforderungen an das Artefakt definiert, bspw., dass durch das Artefakt die Bewertung von Dekompositionen von eEPK Modellen ermöglicht werde. Weiterhin werden in diesen Ar- beiten die Good Decomposition Conditions für die eEPK spezifiziert und in Form von Imple- mentierung als Plug-Ins in den Frameworks ProM (Dongen et al. 2005) und ARIS demons- triert (Scheer 2000). Der darauffolgende Schritt, die Evaluation, wird in Forschungsfrage 2 (bzw. Beitrag 2, Kapitel 2.2) als Laborexperiment verfolgt. Die Ergebnisse dieses ersten De-
sign Science Zyklus, die Good Decomposition Conditions, sind Grundlage für die Entwick- lung der Good Decomposition Metriken.
Wie auch zuvor, wird die Entwicklung der Good Decomposition Metriken mit der Notwen- digkeit der Forschung zur Verständlichkeit von Geschäftsprozessmodellen begründet (siehe Kapitel 2.3.1). Darüber hinaus erklärt Beitrag 3 (bzw. FF 3), dass Werkzeuge zur Bewertung von Prozessmodellverständlichkeit zusätzlichen Nutzen gewinnen, wenn diese eine automati- sierte Bewertung erlauben, weshalb für Good Decomposition Conditions entsprechende Me- triken als Ergänzung entworfen und entwickelt werden. Beitrag drei nimmt zuletzt die De- monstration des Artefakts vor, indem es die Metriken auf die Prozessmodelle aus dem Labor- experiment in Beitrag drei anwendet und die Resultate diskutiert.
Zuletzt wird der Forschungsschwerpunkt „Coupling“ behandelt. Dieser wird in Beitrag vier zunächst mit der Notwendigkeit verständlicher Prozessmodelle motiviert. Weiter wird unter- sucht, welchen Nutzen Coupling Metriken bei der Anwendung auf Prozessarchitekturen ha- ben, woraus sich Anforderungen, wie bspw. die Bewertung des Kontrollflusses, insbesondere aber die Möglichkeit für eine automatisierte Bewertung ergibt. Beitrag fünf setzt den For- schungsprozess fort, indem Coupling Metriken für die eEPK auf Basis existierender Metriken in verwandten Disziplinen entwickelt werden. Das Ergebnis wird außerdem anhand einer Im- plementierung als Plug-Ins in ProM (Dongen et al. 2005) und ARIS (Scheer 2000) demons- triert.
Zuletzt lässt sich Forschungsfrage 6 der Evaluationsphase des Design Science Zyklus zuord- nen. Diese erfolgt zunächst in Beitrag sechs, indem der Entwicklungsprozess hinterfragt wird und die Metriken anhand von Kriterien aus der Literatur geprüft werden. Beitrag sieben wie- derum prüft die Metriken in einem Laborexperiment daraufhin, ob Designänderungen am Pro- zessmodell, die zu Änderungen im Wert der Metrik führen, auch zu einer messbar anderen Verständlichkeit des Prozessmodells führen.
Der letzte Schritt des Forschungsprozesses nach (Peffers et al. 2006), die Kommunikation der Ergebnisse, erfolgt in Kapitel 2 dieser Arbeit.
2 Wissenschaftliche Beiträge
2.1 Beitrag 1: BPM adoption in small and medium-sized companies in Bavaria
Adressierte Forschungsfrage
Forschungsfrage 1: Zu welchem Grad setzen Unternehmen BPM Maßnahmen ein und welche Faktoren motivieren oder behindern den Einsatz von BPM in Unternehmen?
Erscheinungsort 24th European Conference on Information Systems, ECIS 2016, Istanbul, Turkey, June 12-15, 2016 (VHB Jourqual 3: B)
Autoren Daniel Braunnagel 30 %
Thomas Falk 30 %
Benjamin Wehner 30 % Prof. Susanne Leist 10 %
In diesem Beitrag wird die Verbreitung von BPM Maßnahmen in bayerischen Unternehmen ermittelt und aufgezeigt, dass der Umsetzungsgrad polarisiert: Unternehmen setzen die Maß- nahmen entweder zu einem sehr hohen oder zu einem sehr niedrigen Anteil um. Ebenfalls werden mögliche Ursachen für den jeweils hohen oder niedrigen Umsetzungsgrad ermittelt und dazu genutzt, 22 Vorschläge für die Weiterentwicklung des BPM in Wissenschaft und Praxis zu entwickeln.
Die Ergebnisse des Beitrages zeigen sowohl den Forschungsbedarf im Bereich BPM als auch die Tatsache auf, dass Methoden der Prozessmodellierung als wichtig wahrgenommen wer- den. Damit motiviert der Beitrag die allgemeine Zielsetzung dieser Arbeit und lässt sich im DS Zyklus dem ersten Schritt zuordnen.
Die besondere Herausforderung dieses Beitrages liegt im Anspruch die Zielsetzung in Breite und Tiefe gleichermaßen zu bedienen. So soll der Umsetzungsgrad von BPM Maßnahmen bei einer ausreichenden Anzahl an Unternehmen erhoben werden, um das Resultat verallge- meinern zu können. Ebenso sollen Argumente für oder gegen die Umsetzung aufgezeigt wer- den.
Gelöst wird diese Problematik durch eine eigens für diese Erhebung entwickelte Methode.
Diese kombiniert den Stand aus einer Umfrage mit 114 Teilnehmern mit Ursachen, die per Fallstudien bei zehn Unternehmen erhoben wurde. Für die Erhebung wurde ein eigenes Messinstrument auf Basis der Literatur zur BPM Maturity Messung konstruiert.
Tabelle 1: Bibliographische Angaben zu Beitrag 1
Small and medium sized (SMEs) companies are a pillar of the Bavarian economy. With busi- ness process management (BPM) providing an important competitive advantage in the global- ized economy, the adaption of BPM by SMEs has societal relevance. However, the reasons why, or why not, SMEs implement BPM measures are still not fully understood. Previous re- search addressed this topic either breadthwise as surveys or in depth as case studies, and thus only has a limited perspective. Therefore, in our work, we carry out a mixed method analysis.
We conduct 10 case studies to analyse the current state of adoption as well as the reasons for or against implementing further BPM measures. The insights gained guide the design of the subsequent survey. 114 results allow us to evaluate how widespread a particular reason may be. Lastly, the combined discussion of the results of both the case studies and surveys allow us to identify reasons that hinder or foster BPM adoption in SMEs, which are in-depth as well as generalizable.
The study results are analyzed to derive propositions to research and practitioners alike that support SMEs to introduce further measures of BPM and improve their global competitive- ness. For example, we could identify that BPM is in some cases enforced by customers, that stricter certifications are necessary, and that BPM trainings aligned to the needs of SMEs are desirable.
2.1.1 Introduction
Business Process Management (BPM) is one of the key concepts in information systems and represents a comprehensive approach for managing an organization’s business operations (Hammer 2010). The BPM concept has continually evolved over the last few decades by in- tegrating methods, techniques and tools from various fields (Harmon 2010). Today BPM is re- cognized as a holistic management approach encompassing a wide range of aspects (e.g., stra- tegic alignment, governance, methods, information technology, people, and culture (Rose- mann & Vom Brocke 2015). Over the years, BPM has been adopted by organizations in vari- ous industries all over the world. One main motivation is found in the development of the globalized markets. Increasing demands on organizations for e.g., delivery speed, quality and flexibility together with a growing information transparency force companies to continuously optimize their processes in order to survive in competition.
BPM, if applied in an appropriate manner, facilitates process optimization and is thus con- sidered a competitive advantage (Trkman 2010). A significant number of studies confirm pos- itive effects of BPM on organizational performance (e.g., Kohlbacher 2010; Komus 2011).
Further, several studies investigate the adoption of BPM by organizations, both on a world- wide scale (e.g., Harmon & Wolf 2014) and for specific regions (e.g., Brucker-Kley et al.
2014; Minonne et al. 2011). Studies dealing with BPM adoption commonly show (cf. Roeser
& Kern 2015 for an overview), despite the generally acknowledged importance of BPM, con- siderable differences in the BPM adoption between countries, industries and company sizes.
In addition, many organizations do not fully exploit the potential of BPM (cf. Minonne &
Turner 2012). Whereas large organizations have been making effective use of BPM for quite some time, especially for small and medium sized enterprises (SMEs), the successful adoption of BPM seems to be a particular challenge. Possible reasons identified by (Kolář 2014) in- clude, among other things, the lack of internal manpower dedicated to BPM and the different levels of process rigidity in SMEs compared to large organizations. As smaller companies tend to have a higher portion of flexible or ad-hoc processes, it is even more difficult for them to apply existing BPM measures in a SME context. However, a broader evaluation of BPM adoption in SMEs is missing.
Our research, for this reason, focuses on BPM in small and medium-sized enterprises. Espe- cially in the German economy, SMEs play an important role. Currently, they represent 47% of the gross value added and 39% of the aggregated turnover (Söllner 2014). Further, SMEs cur- rently employ 94% of the employees in the private sector; even more, e.g., in the German state Bavaria, they employ 99.6% of the employees in the private sector (DESTATIS 2015). In summary, because of their high societal relevance and the role of BPM to sustain their com- petitiveness, the adoption of BPM by SMEs is a highly relevant topic for research. However, what is needed are reliable insights into this domain to derive the pivotal aspects of how to ex- tend or enrich the future BPM research agenda towards SMEs.
The aim of this paper is to capture the status quo of BPM adoption in Bavarian SMEs. This aim is operationalized with three research questions. (1) To which extent are BPM measures realized in those companies? (2) Which factors influence the adoption of BPM? (3) Which of these factors are distinctive to foster or hinder SMEs in adopting BPM? To address these
questions, we use a mixed method approach combining qualitative (i.e. case study) and quant- itative (i.e. survey) research.
The remainder of this paper is organized as follows. Section 2.1.2 describes the conceptual basics including related work as well as our research method, which is a mixed method ap- proach that integrates a survey and case studies. The results of the survey and the findings of the case studies are presented in section 2.1.3. There we elaborate on the findings related to specific BPM topics and carry out an overall evaluation. In section 2.1.4, the results are sum- marized and discussed in the light of SME-specific characteristics. Section 2.1.5 concludes the paper.
2.1.2 Conceptual Basics
2.1.2.1 Related WorkPreviously, the adoption of BPM was empirically adressed by surveys. For example, the bi- annual survey “The State of Business Process Management”, a survey on the adoption of BPM, has been focusing operational BPM measures and tools from companies of all sizes and locations since 2006 (cf. Harmon & Wolf 2014). Another example is the ZHAW study (Brucker-Kley et al. 2014; Minonne et al. 2011), which has a particular focus on the strategic aspects of BPM adoption (see section 2.1.3.4). A literature review by Roeser and Kern (2015) examines the status quo and the use of surveys published in the BPM domain. They classify the surveys based on the research goals into six classes. Class IV shows surveys on the status quo of BPM in practice. However, none of these surveys answer our research questions be- cause they focus different objectives or subjects. More empirical research in this area has been conducted by means of case studies, which also follow a slightly different focus in their re- search. E.g., Dallas and Wynn (2014) carried out a BPM initiative in a middle-sized Aus- tralian accounting firm analysing whether BPM can be successfully applied in this particular SME, and Chong (2007) conducted a BPM initiative in an Australian wine company analys- ing factors that drive or hinder BPM adoption.
2.1.2.2 Methodology
To address the research questions, we follow a mixed method approach combining qualitative (i.e. case study) and quantitative research (i.e. survey). Since these two methods complement
each other well, they have been advocated for the study of organizations in IS in particular.
Whereas a case study allows an in-depth investigation into the fuzzy and complex nature of an organization, its findings can be tested for generalization with a survey. (cf. Goes 2013; Huys- mans & Bruyn 2013; Venkatesh et al. 2013)
Gable (1994) formalized such an approach. He argues that a preceding case study may inform the survey design, e.g., by pilot testing the survey instruments or construct validation. Also, in his case, notes from the case study were used to interpret survey findings (cf. Gable 1994).
Our work instantiates the mixed method approach as presented by Gable (1994). The meth- ods’ consistency is ensured in two ways. First, in both methods, the targets were selected from the same list of companies. Second, both methods’ instrument is built on the same theoretical groundwork.
Regarding the aforementioned statements, our case studies involved repeated visits at the companies’ sites over a longer period of time to conduct the studies in person. To make the case studies logistically possible and ensure their consistency, we decided to focus the re- search context on SMEs in Bavaria. As for that, Bavaria is suitable as it is an economically strong state in Germany having the majority of private sector employments in SMEs. Thus participants of both the case study and the survey were recruited from a list of Bavarian com- panies that have previously declared their interest in research cooperation. This list—provided by the Bavarian State Ministry of Economy—contained 10,864 companies fitting the criteria of SMEs.
Our measurement is based on the literature on BPM maturity models. BPM maturity models are meant to measure an organization’s capabilities of implementing business processes which achieve their business goals (van Looy et al. 2011). Characteristically, the said models provide, among others, lifecycle levels and capability areas for improvement. The levels re- flect the progress of implementing measures towards a mature BPM (van Looy et al. 2011).
The adaption for our study was done as follows.
First are the assessment items resulting from a systematic search for BPM maturity literature.
From these sources, we assembled the means for survey-based maturity assessment. Van Looy et al. (2011) found a common structure among maturity models’ capabilities according to
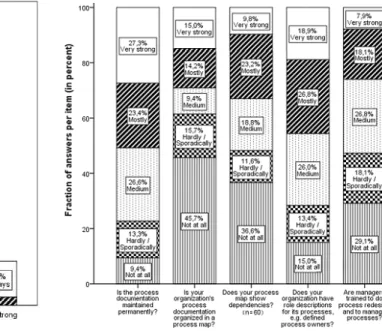
which we grouped our assessment items (see Table 3). For example, the category #1 items “Is the process documentation of your organization maintained permanently?” or “Does your or- ganization have a process map?” stem from the maturity model by Schmelzer and Sesselmann (2008).
The second aspect of our instrument is the level classification. While the maturity models do not share a common calculation scheme, they are designed for an assessment of a finer scope than used in our study. However, each assessment item can be mapped to a category of BPM measures (see Table 3), and the item categories have a natural order. E.g., it is clearly mandat- ory to properly identify and document processes before it makes sense to introduce process performance management (PPM). In fact, this is the systematics of process maturity models and, as Paulk et al. (1993) observe, companies should follow this order. Also, we do realize that companies do not implement a full set of BPM measures for each and every auxiliary process. Because of that, we map the current progress of such companies to the highest cat- egory whose items are rated with at least 50% fulfilment on average. To further avoid termin- ological confusion, we will use the term ‘category’ for rating progress instead of ‘maturity level’. The common list and the common measurement instrument were used in both the case study and the survey to ensure consistency.
2.1.2.3 Case Studies
To find participants for the case studies, we randomly selected companies from the list of Bavarian SMEs (see section 2.1.2.2) until ten companies agreed to participate in the study (see Table 2). In total, we contacted 137 companies. After 10 companies had agreed, the case studies, which consisted of two phases, were performed between March and October 2014.
First, we conducted a semi-structured interview with a representative from each of the parti- cipating companies, with these interviews being based on an interview protocol asking about the current situation of the company and its market, current and previous initiatives of BPM, the existence of process documentation, and the measure regarding process performance man- agement. Due to the explorative nature of the interviews, we refrained from more specific in- terview items. The interviews, which usually took about one day, were conducted by two re- searchers, protocolled and consolidated afterwards.
Second, we launched a basic BPM initiative with the company, e.g., documenting or revising the existing documentation of a process, which served to provoke a very intensive discussion about BPM. Regarding the documentation, we conducted separate interviews with all employ- ees involved in the process. We used these interviews to also ask about their knowledge of, experience with and attitude towards BPM. Finally, we presented the results of the initiative to the leading board in a workshop. This workshop also served to initiate a discussion of both potential uses and benefits of BPM initiatives and potential drivers or hindrances of imple- menting further BPM measures. In summary, this second phase produced a rich background of information about why or why not BPM is installed at Bavarian SMEs.
Integrating the case study, we could realize some of the benefits of the mixed method ap- proach by Gable (1994). We piloted the survey at the companies, testing whether the parti- cipants were able to understand and answer the survey correctly. Moreover, while not general- izable, the case study notes provide in-depth information for the interpretation of the quantit- ative results. Even though these information are valid only for the company where the study was conducted, they can serve for triangulation with the survey results. Section 2.1.3 com- bines findings from the survey with our notes from the case study.
2.1.2.4 Survey
Our survey is built from measures for maturity assessment in literature and informed by the case study. The questionnaire contains the following items. After starting with five demo- graphic questions (e.g., industry, number of employees, etc.), four questions about BPM as a strategic asset are asked. Subsequently we addressed process documentation (five questions), definition of process goals (five questions), process controlling and reporting (six questions), and process improvement (two questions).
Wherever possible, the answers are formulated as a 5-point Likert scale (e.g., degree of agree- ment, degree of fulfilment). In other cases, the items ask for a yes/no answer or for an open text. The survey was originally in German and items were translated into English for this pub- lication.
The survey was conducted anonymously and the questionnaire was implemented as an inter- active PDF file that could be sent by pressing a button at the end. All terminology was ex-
plained by mouse-overs, to reduce subjective interpretations. The PDF was distributed via e- mail to 10,864 Bavarian SMEs in total 128 of which responded.
Responses were filtered for relevance, completeness and internal consistency. First, we checked whether the demographics actually fitted with the definition of a SME. Regarding completeness, we eliminated incompletely answered responses, e.g., when the survey was blank from some point on, as this would have distorted our analysis. The consistency check refers to the natural order of categories mentioned before. If a responder claimed to have es- tablished all measures of performance measurement without even defining processes at all, we removed the survey for lack of plausibility.
After filtering the responses for completeness and internal consistency, 114 responses re- mained for evaluation and built the basis for the interpretation and discussion in the next sec- tion. If logical dependencies among survey items reduced the number of relevant responses (e.g., “Is your companies process documentation organized in a process map: Yes or No” and
“Does your process map show dependencies”), the size of the subset is noted.
# Industry Employees
A Cereal R&D 20
B Automatization machines 240 C Bottling machines 250
D Car accessory 10
E Electronics 230
F Measurement instruments 50 G Electric components 200 H Fittings and Couplings 120 I Steel construction 25 J Steel processing 150 Table 2: Interviewed Companies
# Category 0 Initial category
1 Processes are defined and documented 2 Roles and resources are defined and
documented
3 Process goals are continually revised and communicated
4 Process performance is continually measured and evaluated
5 Processes are continually optimized Table 3: Categories for the classification of maturity progress
The demographic distribution of responses is as follows. As to the number of employees, 65.2
% of the companies report to have less than 50, while the remaining 44.8% have more em- ployees. The most represented industries are electrical & mechanical engineering (20.9%) as well as the service sector (20.0%). The persons who answered the survey are usually head or
CEO of the company (77.2%) and BPM is part of their daily work (71.1%). The results and their interpretation are subjects of the following sections.
2.1.3 Results
2.1.3.1 BPM and Strategy
The first part of the questionnaire aims at discovering the value of BPM for the companies’
strategy and accordingly for their top management. 31.3% of the companies evaluate BPM as very important, as contrasted with 37.4%, which rate BPM as not important for their strategic planning. This corresponds to the objectives that SMEs try to achieve with BPM. The object- ives mentioned most frequently are standardization (91.5%), increasing productivity (89.6%) and quality management (87.7%) all of which put the emphasis on operational activities. On the contrary, the impact of BPM for the companies’ strategy is not well developed: only a few companies use BPM to support in-/outsourcing decisions (31.1%) or for the application of new technologies (e.g., support of mobile processes; 33.0%). The commitment of top manage- ment for BPM is respectable, 53.9% rate a strong commitment, which reflects the widespread knowledge and use of BPM in the Bavarian SMEs. However, it seems that, foremost, BPM means standardization and cost reduction to top management, while they do not see the poten- tial of the knowledge achieved by conducting BPM measures to support strategic planning.
From our preceding case study research, we found two examples, which provide possible reasons for the most frequently named objectives (quality management, standardization) for the use of BPM in SMEs. A certification according to ISO (International Organization for Standardization) standards was mandatory for some companies to prove a certain level of quality to their partners, e.g., suppliers and customers. In those cases, meeting the certification requirements was the main motivation for e.g., documenting a company’s processes. The in- troduction of ERP systems was another reason for a detailed process analysis with the aim of selecting an appropriate ERP system or replacing the existing one.
2.1.3.2 Process Purpose, Documentation, Quality and Capabilities After the strategic perspective on BPM, the further items address the operational dimension.
Items asked whether the processes achieve their goals and whether the goal is achieved reli- ably, a differentiation pointed at by company C. If the process runs through, it produces the