Contents lists available atScienceDirect
Journal of Experimental Marine Biology and Ecology
journal homepage:www.elsevier.com/locate/jembe
Photosynthesis and light-dependent proton pumps increase boundary layer pH in tropical macroalgae: A proposed mechanism to sustain calcification under ocean acidification
C. McNicholl
a, M.S. Koch
a,⁎, L.C. Hofmann
baBiological Sciences Department, Florida Atlantic University, 777 Glades Road, Boca Raton, FL, USA
bAlfred Wegener Institute Helmholtz Center for Polar and Marine Research, Am Handelshafen 12, 27570 Bremerhaven, Germany
A R T I C L E I N F O Keywords:
Diffusive boundary layer Photosynthesis Tropical Inhibitor
A B S T R A C T
Ocean acidification (OA) projections predict ocean pH to decline between 0.2 and 0.4 by 2100 with potential negative consequences for marine calcifiers without acclimation or adaption strategies to accomodate greater [H+] in seawater. Biotic control of calcified reef macroalgae thalli surface diffusive boundary layer (DBL) chemistry may overcome low pH in seawater as one strategy to accommodate OA conditions. To investigate this strategy, we examined surface DBL O2and pH dynamics in five calcifying macroalgae (Halimeda,Udotea,Jania, Neogoniolithon, crustose coralline algae [CCA]) from the Florida Reef Tract under ambient (8.1) and low (7.65) pH using microsensors (100 μm) at the thalli surface in a flow-through flume. The role of photosynthesis and photosystem II (PSII)-independent proton pumps in controlling DBL pH were examined. Four of the five mac- roalgae exhibited a strong positive linear relationship between O2production and increasing pH in the first 15–30 s of irradiance. Once a quasi-steady-state O2concentration was reached (300 s), all species had DBL pH that were higher (0.02–0.32) than bulk seawater. The DBL pH increase was greatest at low pH and dependent on PSII. Some evidence was found for a light-dependent, but PSII-independent, proton pump. High DBL Δ pH upon illumination was likely in response to carbon concentrating mechanisms (CCMs) for photosynthesis. CCMs may be a HCO3−–H+symport, OH–antiport or other DIC transport system, accompanied by proton efflux. HCO3–
dehydration by external carbonic anhydrase (CAext) also produces OH–that can neutralize H+in the DBL. CO2or HCO3–uptake for photosynthesis may also engage H+/OH–fluxes as part of intracellular acid-base regulation changing DBL pH. A higher Δ pH within the DBL at low pH could be accounted for by greater CO2diffusion and/
or lower efficiencies in exporting cellular H+across a lower concentration gradient, and/or a more efficient removal of H+by CAext-driven dehydration of HCO3−. In the dark, Δ pH was less than in the light as these dynamics were primarily due to photosynthesis. We present a conceptual model of inorganic carbon uptake and ion transport pathways, as well as other processes associated with photosynthesis that drive DBL Δ pH and sustain tropical macroalgal calcification in the light under OA. In the dark, unless PSII-independent proton pumps are present, which do not appear to be ubiquitous amongst species, acidification processes likely dom- inate, resulting in CaCO3net dissolution, particularly under OA conditions.
1. Introduction
Ocean acidification (OA) projections (RCP2.6 and RCP8.5 AR5;
IPCC et al., 2013), predict surface ocean pH to decline between 0.2 and 0.4 by 2100 (Gehlen et al., 2014;Hartin et al., 2016;IPCC, 2013). This results from ocean sequestration of ~30% of anthropogenically re- leased CO2 (Sabine et al., 2004) which is predicted to triple under RCP8.5 scenario to ~28 Pg C yr−1by 2100 (Riahi et al., 2011). A 0.1 decrease in pH already observed in the oceans since the industrial
revolution (Caldeira and Wickett, 2003) equates to a 30% increase in hydrogen ion [H+] concentration. Ocean dissolved inorganic carbon (DIC) chemistry is influenced by changes in pH due to its regulatory effect on the carbonate equilibria. In response to a pH decrease of 0.4, the carbonate equilibria under OA leads to a ~200% increase in CO2
and a ~25% increase in bicarbonate (HCO3−), while lowering carbo- nate (CO32−) by ~50–60% (Fabry et al., 2008;Koch et al., 2013). The decline in CO32–lowers the saturation state (Ω) of carbonate minerals of calcite and aragonite (~60%). The high concentration of Ca2+ in
https://doi.org/10.1016/j.jembe.2019.151208
Received 19 April 2019; Received in revised form 19 July 2019; Accepted 12 August 2019
⁎Corresponding author.
E-mail addresses:cmcnicholl2015@my.fau.edu(C. McNicholl),mkoch@fau.edu(M.S. Koch),laurie.c.hofmann@awi.de(L.C. Hofmann).
Journal of Experimental Marine Biology and Ecology 521 (2019) 151208
0022-0981/ © 2019 Elsevier B.V. All rights reserved.
T
seawater (~10,000 μmol kg−1) is considered non-limiting for calcifi- cation, thus calcium carbonate production is chemically controlled by the concentration (100–200 μmol kg−1) of CO32– (Millero, 2007;
Millero et al., 2006). The reduction in CO32– under OA is a major concern because of the potential negative consequences for calcification in marine organisms (Doney et al., 2012; Doney et al., 2009; Fabry et al., 2008;Gattuso et al., 2015;Kroeker et al., 2010;Orr et al., 2005;
Sabine et al., 2004). Calcification rates have been shown to be corre- lated to seawater ΩCaCO3and studies indicate higher calcification rates under elevated [CO32‐] (Anthony et al., 2008;Gao et al., 1993;Gattuso et al., 1999;Hoegh-Guldberg et al., 2007;Langdon et al., 2000).
While the saturation state of CaCO3, [CO32‐], and [Ca2+] are re- cognized as important for calcifiers (Comeau et al., 2012;Waldbusser et al., 2016), some studies show no relationship between calcification rates and ΩCaCO3 in the bulk seawater and inconsistent calcification responses by a diversity of marine organisms to lower ΩCaCO3(Comeau et al., 2018;Comeau et al., 2016;Dutra et al., 2015;Hendriks et al., 2010; McDonald et al., 2009; Peach et al., 2017b; Rodolfo-Metalpa et al., 2011;Shamberger et al., 2014). These results led Jokiel (Jokiel, 2013,2011) and others (Bach, 2015;Cyronak et al., 2015) to re-eval- uate the importance of ΩCaCO3and put forth an alternative hypothesis.
They suggest that limitations to calcification are a consequence of a buildup of [H+] at the site of calcification due to an inability to expel protons from the calcifying space into the bulk seawater under OA conditions. However, this theory is based primary on corals where mineralization is below an epithelial layer separating the calcification site from seawater, while marine macroalgae calcify in their cell walls and extracellularly in close proximity to bulk seawater. In macroalgae, the diffusive boundary layer (DBL) microchemistry, driven by cellular metabolic processes, membrane transport systems and/or thalli morphologies control the calcification site exposure to bulk seawater chemistry.
Therefore, the question for macroalgae is can they control their DBL chemistry through proton pumps and employ mechanisms to take up CO2and HCO3-that raise DBL pH and maintain calcification under OA.
Relatively new applications of the boron isotope provide evidence that marine calcifiers, including corals and calcifying algae, have the ca- pacity to maintain a high pH in their calcifying fluid (pHcf) even under OA conditions (pH 7.64) where [CO32‐] and ΩCaCO3of the bulk seawater are low (Comeau et al., 2018;Cornwall et al., 2017a;Donald et al., 2017; McCulloch et al., 2012). Understanding these mechanisms are particularly critical in calcifying autotrophs that require HCO3–and/or CO2for photosynthesis (Hurd et al., 2011;Koch et al., 2013), a major driver of high calcification rates (De Beer and Larkum, 2001), and in some species initiates calcification (Wizemann et al., 2014). For marine calcifying macroalgae, the increase in HCO3–and CO2under OA pro- mote DIC availability for photosynthesis (Cornwall et al., 2017b;Koch et al., 2013;Zweng et al., 2018). Greater [DIC] may result in higher rates of calcification or compensate for OA effects, as photosynthesis and calcification may be in competition for DIC or control the DIC/H+ ratios affecting calcification. Further, the majority of marine macro- autotrophs are restricted to energetics from photosynthesis, while corals and other heterotrophs can acquire energy to maintain a high pHcfthrough feeding (McCulloch et al., 2012).
Several recent studies examining the thallus boundary conditions of marine macroalgal calcifiers indicate a high degree of biotic control to elevate pH in the light at the thalli surface (Cornwall et al., 2014,2013;
Hofmann et al., 2018,2016;Hurd et al., 2011) and in their calcifying fluids (Comeau et al., 2018;Cornwall et al., 2017a;Donald et al., 2017).
As pH increases at the thalli surface across species and calcification location, a general model may emerge on the role of biotic pH control on calcification with closer examination of a diversity of calcifying macroalgae. In the present study, five tropical reef macroalgae were examined for their ability to regulate thalli surface DBL pH when bulk seawater pH was reduced from ambient conditions (8.1) to those pro- jected for the year 2100. Microsensors were used to establish pH and O2
dynamics to discern potential mechanisms controlling DBL micro- chemistry under OA conditions and how these DIC and ion fluxes may subsequently influence calcification. The DBL pH dependence on light, photosynthesis, and light-dependent photosystem II-independent proton pumps were also examined for each species. We present a gen- eral conceptual model to formulate our hypothesis of how DIC path- ways and biotic control of pH could shift under OA and subsequently affect calcification.
2. Methods 2.1. Algal collection
Five dominant calcified Florida Reef Tract macroalgae (Fig. 1) were collected from a patch reef (~4 m depth) inshore of Looe Key Reef and offshore of Big Pine Key, FL (24° 37.233′ N, 81° 22.247′ W; Oct 2017 – Jan 2018); hereafter referred to by genus names. The five tropical reef calcifiers in this study include: three high-Mg calcite rhodophytes (Neogoniolithon strictumandJania adhaerens[branching], and crustose coralline algae (CCA) [prostrate]) and two aragonite filamentous chlorophytes (Halimeda scabra [segmented, branching plates] and Udotea luna[fan shaped]). CCA was collected following establishment onto settlement plates (2 × 6 cm) over a 4-month period. All species and settlement plates were transported back to the Florida Atlantic University (FAU) lab in an aerated cooler and experiments run within two weeks. During collections, irradiance was determined using an underwater 4π spherical quantum sensor (LI-COR). Temperature, sali- nity and O2of the overlying water were measured using a multisensor probe (600 XLM, YSI Inc.). Surface water pH was also measured from discrete samples (Orion A211, 8302BNUMD) following calibration with NBS standards pH 7.00 and 10.00 and corrected with a standard TRIS buffer (Dickson Lab, Scripps Institute of Oceanography). Seawater samples (150 mL) from the collection site were stored cooled (4 °C) in the dark and total alkalinity (TA) determined by titration within 48 h.
Algae were held in 9 L aquaria with seawater (35 psu) collected from FAU's marine lab (Atlantic Ocean, Boca Raton, FL) in a water-bath Fig. 1.Images of the (a) experimental flow-through flume system illustrating the setup of macroalgae and pH (black) and O2(clear) microsensors at the thalli surface ofUdotea. The other species (b =Neogoniolithon, c =Jania, d = CCA, e =Halimeda) are also depicted with microsensor tips positioned at the thalli surface.
maintained at 28 °C and illuminated (~300 μmol photons m−2s−1) under a 12 h day/night cycle. Aquaria seawater was replenished (75%) every other day to maintain salinity and provide nutrients with pH and TA similar to collection site (8.09 and 2298 μmol kg−1 sw, respec- tively); aquaria were continuously aerated.
2.2. Microsensors and experimental setup
Microsensor measurements were conducted in a flow-through flume system (Fig. 1a) using filtered (0.45 μm) seawater from the FAU marine lab maintained at 28 °C. Flume seawater pHNBS was continuously measured (1 min) in the flume (Orion A211, 8302BNUMD) after cali- bration and corrected with a TRIS buffer (Dickson Lab, Scripps Institute of Oceanography). The O2was measured using an optical sensor (Orion A329) at the beginning and end of each microsensor experiment.
During each run, TA was determined on flume seawater and used to calculate carbonate speciation with CO2SYS (Pierrot et al., 2006).
Carbonate chemistry parameters were calculated using the pH treat- ments and average Florida Reef tract temperature (28 °C) and salinity (35 psu) used for microsensor runs. The pCO2treatment was 1200 μatm for low pH (7.66 ± 0.02) and 360 ± 28 μatm for ambient pH (8.12 ± 0.03) controls (Table S1). The calcium carbonate saturation state (ΩCa/Arag) of aragonite and calcite were 2–3 times higher in the ambient controls (6.0/3.8) relative to low (2.5/1.6) pH treatments (Table S1). The Δ pH during the runs in the bulk seawater from the initial to end of experiments was 0.01 to 0.03.
Within the flume system, macroalgae were secured approximately 10 cm from the chamber bottom in the center of the flume to receive laminar flow (Fig. 1a–e). Water flow was provided by a submersible 300 L hr−1 pump in the sump tank. Seawater was pumped from the sump to the flume where seawater passed through a perforated barrier in order to create laminar flow. Laminar flow and velocity were pre- viously determined by injecting dye into the sump tank and recording flow in the flume. The flume was illuminated by a full-spectrum LED light (Kessil, A360W E-Series Tuna Sun) set at 500 μmol photons m−2s−1during light runs. The O2 and pH microsensors were posi- tioned within 200 μm of each other on the thalli surface using a manual dual-head micromanipulator arm (MM33–2, Unisense) and measure- ments set to record simultaneously every second. Thalli surface O2and pH dynamics were determined using miniaturized amperometric sen- sors detecting oxidation-reduction signals (pA range) with rapid re- sponse times (0.3 s) and recorded with a highly sensitive picoammeter (Unisense UnderWater Meter System, Denmark). The microsensors (100 μm) are connected to a 4-channel underwater recorder equipped with amplifiers (ISA) that provide a high-quality signal with low background interference. Prior to measurements, the sensors are po- larized and calibrated. The O2microsensor (OX-100, Unisense Inc.) was calibrated using aerated seawater at 100% saturation and an anoxia solution used for 0% saturation (0.1 M sodium ascorbate and NaOH;
~2 g sodium ascorbate in 100 mL of 0.1 M NaOH). The pH microsensor (pH -100, Unisense Inc.) was calibrated using NBS buffers (7.00 and 10.00) and corrected using a TRIS buffer (Dickson Lab, Scripps Institute of Oceanography).
2.3. pH and O2dynamic experiments
After samples were secured in the flume and microsensors moved into position, light:dark cycle runs proceeded. There was an initial 10- min dark pretreatment period followed by 3 continuous light:dark cy- cles run at 5 min intervals. The first was conducted at a pH of ~8.1 (ambient). The flume seawater or bulk water pH was then lowered to
~7.65 (low pH) by the addition of acidified seawater produced by bubbling with pure CO2(Riebesell and Gattuso, 2011) and added in 20 ml aliquots to the water bath in line with the flume system. Once bulk seawater pH and thalli microsensor pH stabilized, the algae was again pretreated for 10 min in the dark, followed by another light:dark
cycle. At the end of the low pH light:dark cycle, the bulk seawater pH was adjusted to pH 8.1 by adding 0.05 M NaOH in 2 ml aliquots to the water bath and inhibitor experiments conducted. Test runs showed no difference in pH and O2surface dynamics after the addition of NaOH to re-establish ambient pH conditions, and adjustments were only per- formed before the inhibitor experiment.
To determine the role of photosynthesis in thallus surface pH dy- namics, a photosystem II inhibitor, herbicide 3-(3,4-Dichlorophenyl)- 1,1-dimethylurea (DCMU), was amended to the flume system. The concentration to be used for each run was established by the minimum level needed to inhibit O2production at the thalli surface of the species examined (~2–4 μM DCMU). Although DCMU has been shown to ele- vate respiration in some macroalgae, no change in [O2] was found with DCMU for any species or run (Table S2). Diminished O2concentrations at the thalli surface and no O2change under irradiance was used to confirm photosynthesis inhibition before light:dark cycles commenced.
The light:dark cycle runs were conducted at pH 8.1 and 7.65 as de- scribed above.
3. Statistical analysis
To compare amongst treatments and define O2and pH dynamics,t- tests and regression analyses were performed (SigmaPlot 13.0, Systat Software Inc.). A t-test was used to examine O2and pH changes at the thalli surface in response to light (light-dark) and pH (ambient-low) changes. For these comparisons, the average of the first and last 10 s of the dynamic runs (n= 3) were calculated and the differences used in the analysis. The same approach was used for the runs with the pho- tosynthetic inhibitor (DCMU). Thalli surface pH was also compared to the bulk seawater pH in the light and dark, as well as in the ambient and low pH treatments. A Mann-Whitney U non-parametric test was used if data were non-normal or variances were not homogeneous.
Linear regression analysis was used to establish the relationship (slope, R2) between photosynthesis (O2production) and pH change using the initial 30 s of the light run. The dynamics in the light and dark across the entire 300 s dynamic run were described using linear and non-linear regression analysis.
4. Results
4.1. Microsensor runs
Three independent microsensor runs using different individuals produced a range of thalli surface O2concentrations after 300 s for each species ranging from 73 to 852 μM of O2(Table 1). However, the re- plicates within each microsensor run were highly repeatable with low variance across three sequential light-dark cycles and pH treatments (Fig. 2). Thus, pH and light-dark comparisons of O2and pH dynamics were examined within each run (Tables 1–3), and details of the dy- namics are presented in graphs for light-dark incubations in micro- sensor run one (Figs. 2–4) with additional runs presented in the sup- plement (Fig. S1, S2).
4.2. Dark-light O2dynamics
The change in O2from dark to light in ambient, compared to low pH, was not significant for most of the species across all three micro- sensor runs (Fig. 2;Table 1) with the exception of CCA andHalimedain runs one and two. During these runs, the change in O2in response to light was always greatest at low pH. Although these results indicate a potential increase in photosynthesis with greater CO2availability at low pH, the percent increase was only 21 and 23% for CCA andHalimeda, respectively. The consistency of O2dynamic changes from light to dark incubations is clearly seen in the replicate incubations in run one where the O2scale was equivalent for both ambient and low pH runs (Fig. 2) and in runs two and three (Table 1). In contrast to relatively high [O2]
in the light, DCMU [O2] were 1 to 2 orders-of-magnitude lower (Table 1). Further evidence of DCMU's efficiency in arresting photo- synthesis is shown by a negative [O2] difference between the thalli surface and bulk seawater [O2] (surface-bulk) in the light for all species in the presence of DCMU (Table S2).
4.3. Dark-light pH dynamics
The initial (15–30 s) light-induced increase in pH at the thalli sur- face was highly correlated with O2production (R20.86–0.98) for all species (Fig. 3a–d) with the exception of CCA (Fig. 2c). The slope of the initial pH response was relatively similar under ambient and low pH (Fig. 3a–d), but was an order of magnitude greater forHalimedacom- pared to the other species (Fig. 3c). While CCA had an immediate O2
flux response to light, there was a lag in pH increase (Fig. 2c).
In contrast to short-term (15–30 s) pH dynamics, over the entire 300 s light incubation, Δ pH was greater under the low pH treatment (0.12) compared to ambient pH (0.09). This ~38% increase in pH was observed for almost every microsensor run (24–46% change) and for all species with the exception ofUdotea(Table 2). A significantly higher Δ pH dark/light cycle (280–300 s) between ambient and low pH incuba- tions was observed in two runs forHalimedaand one run forNeogo- niolithonandJania, although all average changes in pH for these species tended to be higher at low pH relative to ambient controls (Table 2).
The greatest increase in pH during the light cycle was 0.42 and 0.31 units forHalimedaandJania, respectively, in the low pH treatment during run one. Further, the slopes of pH change over time for the entire 300 s incubation (Table 4) were always higher in the low com- pared to ambient pH incubation based on the non-linear and linear models (Fig. 4, light). The pH dynamics for all species in the light fol- lowed an exponential function with the exception of CCA. CCA pH in- creased linearly in two distinct phases with the first peaking at 100 s, followed by a slow increase that appeared to level off in the ambient pH treatment, but continued to increase in the low pH treatment (Fig. 4c light).
The pH dynamics in the dark were similar forNeogoniolithon,Jania andUdoteawhich all followed a hyperbolic decay model with relatively similar slopes at low and ambient pH (Fig. 4a, b, e;Table 4). The non- linear models of pH decline in the dark were similar between pH treatments compared to more diverse responses in the light.Halimeda showed a rapid decline in pH during the dark incubation for the first 100 s, followed by an increase in pH, fitting an exponential decay
function with a linear combination (Fig. 4d,Table 4). Consistent with the light dynamics, CCA had a slow 2-phase decline in pH over time, but still fit the hyperbolic decay model.
Following treatment with DCMU, Δ pH from dark to light was lowered significantly. There was also no difference in the Δ pH under ambient and low pH. Thus, the dark/light changes in pH at the thalli surface was dependent on photosynthesis for most species. The greater Δ pH under OA conditions was also linked to photosynthesis, as no significant differences in Δ pH at low pH were observed after treatment with DCMU. Only 2 species (Neogoniolithon, Halimeda) continued to exhibit pH dynamics during the dark-light cycles with DCMU, albeit the magnitude of change was significantly reduced. Both at ambient and low pH,Neogoniolithonhad the capacity to raise pH ~0.03 to 0.04 units in the light following a 300 s dark incubation (Fig. 5).Halimedashowed an inverse response toNeogoniolithon, increasing pH ~0.03 to 0.04 units in the dark, and lowering pH at the thalli surface in the light (Fig. 5).
This increase in pH during the dark incubation for Halimedais con- sistent with the 300 s dark incubation that showed an exponential de- crease in pH followed by a slower linear rise over time (Fig. 4d).
4.4. Thalli surface vs bulk seawater pH
In addition to ~33% greater Δ pH between dark-light cycles at low compared to ambient pH, we observed a 133% increase in pH at the thalli surface relative to the bulk seawater pH at low compared to ambient pH in the light. Averaging results from all five species, there was a higher pH at the thalli surfaces relative to the bulk seawater at low (average = 0.14) compared to ambient (average = 0.06) pH in the light, and significant differences detected for at least two out of three runs for each species (Table 3). Even in the dark, the pH was higher at the thalli surface relative to bulk seawater in the low pH treatments compared to ambient pH controls (Table 3). During the entire run (Fig. 2) a higher Δ pH was maintained at the thalli surface relative to the bulk seawater at low compared to ambient pH.
5. Discussion
Four out of five tropical calcifying reef macroalgae exhibited a strong linear relationship between O2production and increasing pH in the first 15–30 s of the runs, with two of the rhodophyte species (NeogoniolithonandJania) andHalimedaexhibiting an R2≥ 95. Once a quasi-steady-state O2concentration was reached after 300 s in the light, Table 1
Changes in O2concentrations from dark to light conditions at the thalli surface (Neo =Neogoniolithon, Jan =Jania, CCA, Hal =Halimeda, Udot =Udotea) under ambient (8.1) and low (7.65) pH with and without the photosynthetic inhibitor DCMU. Replicate microsensor experiments are shown with sequential 300 s dark/
light cycles (AVG ± SD; n = 3). Data are averages of the last 10 s in the light/dark for each run. Runs 1–3 without DCMU and 1–2 with DCMU. Means with asterisk represent significant differences between ambient and low pH (P< .05).
△Oxygen (μM)
Microsensor Run 1 Microsensor Run 2 Microsensor Run 3
(a) Ambient Low Ambient Low Ambient Low
Neo 442 ± 9 421 ± 21 852 ± 63 737 ± 51 256 ± 44 271 ± 26
Jan 328 ± 49 304 ± 48 131 ± 11 170 ± 6 123 ± 9 148 ± 2
CCA 236 ± 12* 265 ± 8* 137 ± 9* 173 ± 7* 213 ± 20 230 ± 32
Hal 559 ± 26* 608 ± 14* 139 ± 10* 190 ± 4* 242 ± 11 236 ± 14
Udot 83 ± 4 71 ± 7 73 ± 3 78 ± 4 101 ± 12 104 ± 6
(b) △Oxygen (μM) (+ DCMU)
Neo 6 ± 2 9 ± 0 9 ± 4 17 ± 5 nd
Jan 3 ± 4 −3 ± 6 7 ± 3 5 ± 7 nd
CCA 21 ± 3 21 ± 2 10 ± 3 5 ± 4 nd
Hal 23 ± 2 22 ± 2 −1 ± 3 2 ± 4 nd
Udot −1 ± 4 1 ± 2 5 ± 6 −2 ± 6 nd
pH at the thalli surfaces was always greater (0.02–0.32) than in the overlying bulk seawater for all species. This increase in pH at the thalli surface was primarily dependent on photosynthesis, as shown by no significant Δ pH between ambient and low pH treatments when PSII was inhibited with DCMU. A metabolically-driven increase in pH within the diffusive boundary layer (DBL) in the light has been observed in fleshy (Noisette and Hurd, 2018) and calcifying (Cornwall et al., 2015, 2013;De Beer and Larkum, 2001;Hofmann et al., 2018,2016;Hurd et al., 2011) macroalgae. Encrusting coralline algae (Sporolithon durum) raised pH in the light 0.88 pH units from 8.0 pH after 1 h under a flow rate of 1.5 cm s−1(Hurd et al., 2011), similar to the flow in our ex- periments (~2–3 cm s−1). Cornwall et al. (2013) attributed a pH
increase of ~0.35 in the light within the DBL of an erect coralline and encrusting algal consortium at flow rates < 4 cm s−1to photosynthesis.
Photosynthetic inhibitors (AZ, DIDS) lowered a 0.3 to 0.7 pH increase by ~30% at the surface of a crustose coralline algae (CCA) (Hofmann et al., 2016). These data, and those showing a correspondence between increasing CO32‐and pH at algal surfaces using microsensors (Chrachri et al., 2018;Hofmann et al., 2018), infer that photosynthesis drives pH and DIC microchemistry within the DBL by the exchange of CO2and ions (H+, OH−, HCO3−) across the plasmalemma (Borowitzka, 1981;
Borowitzka and Larkum, 1987;Gao et al., 1993). HCO3−uptake via a H+symport (or OH–antiport) or other H+transport mechanism (e.g., Ca2+:H+ antiport, Na+:H+ antiport) and/or external carbonic Fig. 2.Complete dark-light cycles (n= 3) showing O2(dark circles) and pH (grey circles) thalli surface dynamics for each species (a =Neogoniolithon, b =Jania, c = CCA, d =Halimeda, e =Udotea). Panels on left show dynamics at ambient pH, while those on the right are at low pH; note different right axis scale for pH treatments. The bulk seawater pH is also shown (grey dotted line) in each figure. Each cycle starts with lights (500 μmol photons m−2s−1) on for 300 s followed by a 300 s dark period.
anhydrase enzyme (CAext)-mediated dehydration of HCO3–to CO2and OH–would raise the pH at the thallus surface. HCO3–dehydrogenation by CAext to CO2, followed by diffusive flux into the cell for photo- synthesis, was predicted byChrachri et al. (2018)to drive a rapid pH change in the DBL of large diatoms. Active HCO3-uptake and CO2 diffusion mediated by CAextmay be not be exclusive. A H+efflux across the plasmalemma, catalyzed by a H+-ATPase in support of a HCO3−/ H+symport, would create microzones of low pH that would enhance external dehydration of HCO3−. While suspected to occur, these low pH microzones at the thalli surface have not been identified (Raven and Hurd, 2012). Although the CAext enzyme speeds up the equilibria
reactions between HCO3–and CO2, an initial mechanism is required to initiate a shift in the carbonate equilibria. Support for additional HCO3– transport mechanisms have been evidenced by incomplete reduction in photosynthetic rates (O2flux) using CAextinhibitors in both macroalgae (Hofmann et al., 2016) and phytoplankton (Chrachri et al., 2018). In addition to direct effects, intracellular acid-base regulation in response to photosynthesis can generate H+/OH–fluxes across the plasmalemma shifting DBL pH. Regardless of the DIC-uptake or ion transport me- chanism, photosynthesis promotes Δ pH which has been attributed to maximum rates of calcification in macroalgae and corals (De Beer and Larkum, 2001; Gattuso et al., 1999; Martin et al., 2013). Thus, an Table 2
Changes in pH from dark to light conditions at the thalli surface (Neo =Neogoniolithon, Jan =Jania, CCA, Hal =Halimeda, Udot =Udotea) under ambient (8.1) and low (7.65) pH with and without the photosynthetic inhibitor DCMU. Replicate microsensor experiments are shown with sequential dark/light cycles (AVG ± SD;
n = 3). Runs 1–3 without DCMU and 1–2 with DCMU. Data are averages of the last 10 s in the light/dark for each run. Means with asterisk represent significant differences between ambient and low pH (P < 0.05).
△pH
Microsensor Run 1 Microsensor Run 2 Microsensor Run 3
Ambient Low Ambient Low Ambient Low
Neo 0.062 ± 0.004* 0.090 ± 0.007* 0.100 ± 0.002 0.118 ± 0.013 0.064 ± 0.009 0.090 ± 0.007
Jan 0.202 ± 0.023* 0.306 ± 0.037* 0.061 ± 0.011 0.071 ± 0.002 0.031 ± 0.004 0.028 ± 0.003
CCA 0.054 ± 0.005 0.082 ± 0.005 0.032 ± 0.004 0.032 ± 0.007 0.031 ± 0.003 0.042 ± 0.011
Hal 0.295 ± 0.006* 0.418 ± 0.014* 0.029 ± 0.005* 0.054 ± 0.005* 0.072 ± 0.009 0.093 ± 0.011
Udot 0.119 ± 0.007* 0.100 ± 0.004 0.029 ± 0.017 0.018 ± 0.004 0.055 ± 0.029 0.027 ± 0.011
△pH (+DCMU)
Neo 0.014 ± 0.001 0.015 ± 0.001 0.006 ± 0.009 0.012 ± 0.013 nd
Jan −0.012 ± 0.007 0.015 ± 0.012 −0.013 ± 0.005 −0.012 ± 0.006 nd
CCA −0.013 ± 0.001 −0.020 ± 0.004 0.013 ± 0.012 0.000 ± 0.000 nd
Hal −0.022 ± 0.039 −0.032 ± 0.025 −0.035 ± 0.007 −0.030 ± 0.008 nd
Udot −0.013 ± 0.009 −0.020 ± 0.002 −0.001 ± 0.003 −0.001 ± 0.004 nd
Table 3
Differences between bulk seawater and thalli surface (Neo =Neogoniolithon, Jan =Jania, CCA, Hal =Halimeda, Udot =Udotea) pH (surface – bulk) in the light and dark under ambient (8.1) and low (7.65) pH conditions and with and without the photosynthetic inhibitor DCMU in the light. Replicate microsensor experiments are shown with replicate light measurements (AVG ± SD; n = 3). Data are averages of the last 10 s in the light/dark for each run. Runs 1–3 without DCMU and 1–2 with DCMU. Means with asterisk represent significant differences between ambient and low pH (P < 0.05).
I) Light △pH
Microsensor Run 1 Microsensor Run 2 Microsensor Run 3
Ambient Low Ambient Low Ambient Low
Neo 0.040 ± 0.004* 0.077 ± 0.007* 0.030 ± 0.017 0.050 ± 0.022 0.032 ± 0.010* 0.095 ± 0.005*
Jan 0.111 ± 0.020* 0.294 ± 0.035* 0.060 ± 0.005* 0.092 ± 0.007* 0.017 ± 0.003 0.071 ± 0.012
CCA 0.052 ± 0.004* 0.073 ± 0.006* 0.040 ± 0.014 0.040 ± 0.003 0.041 ± 0.002* 0.092 ± 0.016*
Hal 0.320 ± 0.008* 0.650 ± 0.021* 0.037 ± 0.005 0.096 ± 0.025 0.018 ± 0.004* 0.073 ± 0.020*
Udot 0.062 ± 0.008* 0.120 ± 0.009* 0.030 ± 0.008 0.015 ± 0.005 0.016 ± 0.003* 0.060 ± 0.004*
△pH (+DCMU)
Neo −0.033 ± 0.006 −0.029 ± 0.003 −0.063 ± 0.010 −0.090 ± 0.010 nd
Jan −0.061 ± 0.008 −0.053 ± 0.020 −0.066 ± 0.002 −0.010 ± 0.018 nd
CCA −0.003 ± 0.000 −0.003 ± 0.012 −0.030 ± 0.011 −0.014 ± 0.002 nd
Hal −0.133 ± 0.047 −0.060 ± 0.030 −0.044 ± 0.008 0.011 ± 0.018 nd
Udot −0.063 ± 0.002 −0.005 ± 0.011 0.049 ± 0.004 −0.032 ± 0.007 nd
II) Dark △pH
Neo −0.022 ± 0.004* −0.013 ± 0.001* −0.093 ± 0.033 −0.068 ± 0.011 −0.032 ± 0.001* 0.005 ± 0.002*
Jan −0.092 ± 0.009* −0.012 ± 0.009* −0.054 ± 0.009* 0.021 ± 0.008* −0.013 ± 0.002* 0.042 ± 0.009*
CCA −0.003 ± 0.001 −0.018 ± 0.003 0.007 ± 0.011 0.008 ± 0.007 0.009 ± 0.003 0.050 ± 0.009
Hal 0.025 ± 0.002* 0.233 ± 0.007* 0.009 ± 0.000 0.042 ± 0.022 −0.055 ± 0.006* −0.021 ± 0.012*
Udot −0.057 ± 0.015* 0.020 ± 0.012* 0.001 ± 0.011 −0.003 ± 0.001 −0.037 ± 0.025* 0.033 ± 0.010*
important question is whether or not photosynthesis and increase of the DBL pH with photosynthesis will be compromised at low pH under OA.
Based on our microsensor data, O2flux at the thalli surface upon irradiance was relatively similar at 7.65 and 8.1 pH for all species, indicating that photosynthesis was not constrained by low pH. In fact, the O2concentration at the thalli surface in the light was significantly higher on average for two species (Halimeda and CCA) in the low, compared to ambient pH treatment. While increased photosynthesis in response to elevated DIC and CO2is not ubiquitous across macroalgal species (Cornwall et al., 2012; reviewed inKoch et al., 2013), the tro- pical calcifiers examined herein, with the exception of CCA andNeo- goniolithon, increased Pgmaxat pH 7.5 relative to pH 8.5 at high satur- ating irradiances (Zweng et al., 2018). Thus, they are likely facultative HCO3–users, also supported by their organic δ13C isotope ratios (−14
to −20;Zweng et al., 2018) that suggest they acquire both HCO3–and CO2(Johnston et al., 1992;Maberly et al., 1992).
Even though relatively similar Δ pH dynamics were observed at ambient and low pH, thalli surface pH was always greater than bulk seawater in the light for all species under OA conditions. These results may partially be explained by a lower buffering capacity in the low pH seawater (Ravelle Factor; RF). However, pH in the DBL was always higher at low pH relative to bulk seawater, the increased Δ pH was always positive, and the pH change was faster than predicted based on chemical equilibria (CO2SYS RF change with pH). Enhanced Δ pH under OA conditions was arrested with DCMU, lending further support for a biotically-controlled process, or one linked to PSII in the light. A similar response was found in a tropical CCA where surface pH was raised 0.6 units at pH 7.8, while only 0.25 at pH 8.1 from dark to light (Hofmann et al., 2016). Recent studies using boron isotopes have also shown that pHcfis increased at low (~0.5 to 1.0 pH units at 7.64 pH) compared to ambient pH (~0.2 to 0.8 pH units at 8.08) in coralline algae (Cornwall et al., 2017a). Also using boron isotopic proxies, the rhodolithNeogoniolithonsp. was found to increase pHcf1.26 pH units at pH 7.64, an almost 2-fold greater Δ pH (0.85) than under ambient (8.19) pH (Donald et al., 2017). An increase in pH within the DBL re- lative to the bulk seawater could be a consequence of greater CO2
diffusion and/or lower export of cellular H+as the plasma membrane proton motive force reverses under OA (Taylor et al., 2012). Alter- natively, the carbonate equilibria shift towards CO2 under lower pH may increase CAext-facilitated CO2uptake resulting in more H+being neutralized by OH–in the DBL, or enhanced cellular acid-base regula- tion increasing DBL pH.
Biotic control of Δ pH in the DBL without PSII was only consistently observed for two species,HalimedaandNeogoniolithon, althoughJania depicted similar, but inconsistent, dynamics toNeogoniolithon. In the presence of DCMU, light/dark DBL Δ pH was only ~0.05 units and in opposite directions. The divergent species-specific patterns of H+efflux within the DBL with respect to the light can be reconciled by con- sidering their respective morphologies and calcification sites.Halimeda is made up of tightly joined filaments that form a semi-enclosed inter- cellular space (ICS) interior to appressed swollen end filaments (utri- cles). At the surface of these appressed cells, small (~3–500 μm;
Borowitzka and Larkum, 1987; Peach et al., 2017a) ion diffusion channels form (De Beer and Larkum, 2001) that may have a light-de- pendent, but PSII independent, proton pump. Lower pH in the DBL from H+efflux was observed in the light with DCMU, but was presumably masked by high Δ pH when PSII was operational. One explanation is that in the light, ΩCaCO3is raised by pumping H+out of the utricular space, lowering surface pH outside the utricles. A similar inverse pH dynamic was observed by De Beer and Larkum (2001) with micro- sensors at the surface ofHalimeda discoidea. In our dynamic observa- tions, theHalimedaH+pump, potentially a proton ATPase or sodium- proton exchange driven by a sodium ATPase (Gimmler, 2000) was in- hibited or reversed in the dark. This reverse dynamic was modeled in the non-DCMU treatments in the dark by an exponential decay function with a linear combination. InHalimeda, net calcification in the light without photosystem II was 30% of controls, and this species showed little to no net calcification in the dark (McNicholl and Koch, un- published data). Thus, photosynthesis is a major driver for calcification (~70%), but a light dependent, potentially a proton ATPase pump, independent of PSII electron transport, may also be important.
In contrast toHalimeda,NeogoniolithonDBL pH increased in the light with DCMU, indicating a proton pump independent of PSII that could potentially enhance calcification within the cell wall. Support for a non- PSII light-driven calcification mechanism in this species is provided by greater net calcification rates in the light with DCMU compared to the dark (McNicholl and Koch, unpublished data). The subsequent de- clining pH may be associated with H+efflux from calcification. The rhodophytes as a group are known to biotically control calcification and dissolution processes that have been linked to the formation of distal Fig. 3.Linear pH change in response to photosynthesis (O2flux) during the first
15–30 s in the light following 300 s in the dark for a =Neogoniolithon, b =Jania, c =Halimeda, d =Udotea. Each point is the average of the 3 light cycles at that time step (Fig. 2). Slopes and R2are shown on the graph for incubations at ambient (dark circles, solid line) and low (grey triangles, dashed line) pH.
cell invaginations increasing their surface area to support H+pumping (Pueschel et al., 2005).
AlthoughUdotea, CCA, andJaniadid not demonstrate species-spe- cific light/dark H+dynamics independent of PSII, they exhibited un- ique H+dynamics relative to the other species.Udoteawas the only species that maintained higher thallus surface pH compared to bulk seawater, but no clear increase of pH under OA conditions relative to controls. This may have been due to diffusion limitation of CO2through filament sheaths, or a greater dependency on HCO3–even at low pH.
This species has the most enriched C isotope ratio (δ13C = −14%o) amongst the five species, and lowered Pgmax by 40% when active (ATPase) ion transport was inhibited (Zweng et al., 2018), perhaps explaining why it was able to raise pH at the DBL in the light, but did
not respond to greater DIC availability. CCA had a slower 2-phase in- crease in pH at the thalli surface in response to light. The shift in pH change with a steeper slope was coincident with a short-term stabili- zation or decline in surface O2concentration, followed by a rapid in- crease in O2flux. This response may be reflective of an initial active HCO3–uptake mechanism, followed by rapid CAext-driven DIC uptake.
Janiaresponded similarly to irradiance, with a rapid 2-phase pH change corresponding to O2flux and an O2decrease or plateau between phases.
While the 2-phase O2/H+dynamics exhibit a similar pattern at 8.1 and 7.65 pH, the efficiency of pH change to O2flux was greater at low pH, consistent with a more rapid conversion of HCO3–to CO2by CAextdue to a shift in the DIC chemical equilibria.
The combination of similar O2dynamics at 8.1 and 7.65 pH, despite Fig. 4.pH light and dark thalli surface dynamics over the 300 s incubation under ambient and low pH for each species (a =Neogoniolithon, b =Jania, c = CCA, d =Halimeda, e =Udotea). The pH response in the light for all species fit an exponential rise to a maximum single 3-parameter model with the exception of CCA that fit a linear model. In the dark, pH decline over time was fit to a 3-parameter hyperbolic decay model with the exception ofHalimedathat had an exponential decay function with a linear combination. Models, parameters and fits are presented inTable 4. Each point is the mean of 3 sequential runs (Fig. 2).
a 3-fold increase in [CO2] in the latter, δ13C isotopic ratios of the species examined, rates of DBL pH change upon illumination at the thalli sur- face, and DIC modeling imply the use of CCMs that simultaneously support photosynthesis and calcification (Fig. 6). The CCMs are most likely comprised of a HCO3– uptake mechanism with a H+symport and/or OH–antiport, or other Na+/Ca2+transport systems (Gimmler, 2000;Raven and Hurd, 2012;Taylor et al., 2012). CAextthat enhances diffusive uptake of CO2(20–65%;Zweng et al., 2018), presumably in combination with proton pumps, may also be important (Fig. 6a). Based on our microsensor study, and applying equilibrium assumptions (CO2SYS), under ambient pH (~8.25, 5.8 nM H+) in the light (Fig. 6a), HCO3– and CO2 provide DIC for photosynthesis and all DIC species (~1494:323:6 μmol kg−1 HCO3−:CO32‐:CO2) are available for calcifi- cation through diffusive and/or paracellular pathways. Photosynthesis also contributes ATP directly and via oxidative phosphorylation of photosynthates for energy-dependent ion transport and organic sub- strates important for crystal nucleation, lowering activation energy, and serving as catalysts, such as acid-rich proteins (Bilan and Usov, 2001;
Borowitzka, 1982;Von Euw et al., 2017). Cellular CO2dehydrogenated by CAext is taken up by diffusion and immediately sequestered for photosynthesis or, because of its “leakiness” out of the cell for a CCM (Raven and Beardall, 2016), cellular CO2is hydrogenated by CAintto HCO3–and H+(Fig. 6a). As part of this reaction, OH– is available to neutralize H+ in the cell wall or DBL. HCO3– is transported to the chloroplast for photosynthesis (or potentially used for calcification) and H+is sequestered by the cell or removed to maintain acid-base reg- ulation. HCO3–uptake may also be driven by other symports/antiports (e.g., Na+/Cl−) and H+/OH– fluxes regulate acid/base conditions within the cells. The morphology of different macroalgal species pro- vide variations on the role of diffusive versus active ion transport op- tions into and out of the calcification site. For example,Halimedaspe- cies possess diffusive pathways to DIC, but appear to have a H+pump to expel protons out of the inter-cellular calcification site. Ion transport through cell walls or mucilage sheaths (e.g., Udotea) are primarily constrained by diffusion gradients, DBL microchemistry, potentially cell wall constituents, and/or are driven by ion transport across the plas- malemma. One rhodophyta species (Neogoniolithon), and another less Table 4
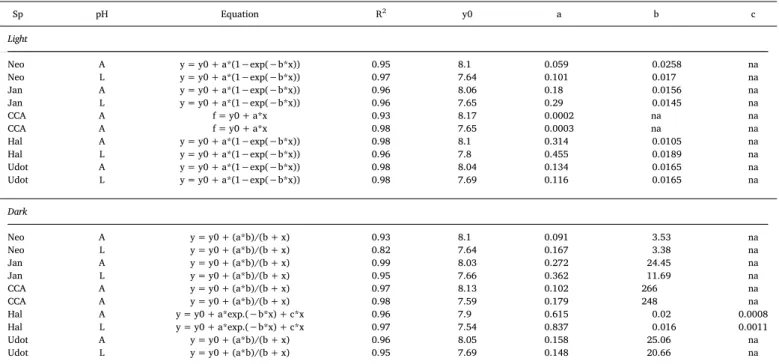
Linear and non-linear regression models, fit (R2) and parameters of the pH dynamics in the light and dark at the thalli surface (Neo =Neogoniolithon, Jan =Jania, CCA, Hal =Halimeda, Udot =Udotea) for 300 s dark-light cycles under ambient (A) and low (L) pH treatments. Data corresponds to models shown inFig. 4.
Sp pH Equation R2 y0 a b c
Light
Neo A y = y0 + a*(1−exp(−b*x)) 0.95 8.1 0.059 0.0258 na
Neo L y = y0 + a*(1−exp(−b*x)) 0.97 7.64 0.101 0.017 na
Jan A y = y0 + a*(1−exp(−b*x)) 0.96 8.06 0.18 0.0156 na
Jan L y = y0 + a*(1−exp(−b*x)) 0.96 7.65 0.29 0.0145 na
CCA A f = y0 + a*x 0.93 8.17 0.0002 na na
CCA A f = y0 + a*x 0.98 7.65 0.0003 na na
Hal A y = y0 + a*(1−exp(−b*x)) 0.98 8.1 0.314 0.0105 na
Hal L y = y0 + a*(1−exp(−b*x)) 0.96 7.8 0.455 0.0189 na
Udot A y = y0 + a*(1−exp(−b*x)) 0.98 8.04 0.134 0.0165 na
Udot L y = y0 + a*(1−exp(−b*x)) 0.98 7.69 0.116 0.0165 na
Dark
Neo A y = y0 + (a*b)/(b + x) 0.93 8.1 0.091 3.53 na
Neo L y = y0 + (a*b)/(b + x) 0.82 7.64 0.167 3.38 na
Jan A y = y0 + (a*b)/(b + x) 0.99 8.03 0.272 24.45 na
Jan L y = y0 + (a*b)/(b + x) 0.95 7.66 0.362 11.69 na
CCA A y = y0 + (a*b)/(b + x) 0.97 8.13 0.102 266 na
CCA A y = y0 + (a*b)/(b + x) 0.98 7.59 0.179 248 na
Hal A y = y0 + a*exp.(−b*x) + c*x 0.96 7.9 0.615 0.02 0.0008
Hal L y = y0 + a*exp.(−b*x) + c*x 0.97 7.54 0.837 0.016 0.0011
Udot A y = y0 + (a*b)/(b + x) 0.96 8.05 0.158 25.06 na
Udot L y = y0 + (a*b)/(b + x) 0.95 7.69 0.148 20.66 na
Fig. 5.Dynamics of light/dark pH cycles run at (a) ambient and (b) low pH in the presense of the photosystem II inhibitor DCMU. All runs were initiated in the light (300 s) followed by dark (300 s) periods. Three sequential replicated light/dark cycles are shown forNeogoniolithonandHalimeda.
consistently (Jania), showed evidence that they possess a PSII-in- dependent light triggered proton pump supported by positive net cal- cification in the dark and in the light with DCMU (McNicholl and Koch, unpublished data).
Based on the present study, under low pH in the light (Fig. 6b), photosynthesis continues to sustain a high pH at the thalli surface even though [H+] increases on average ~130% in the DBL (13.3 nM H+) when pH increases from 7.65 to 7.91. As the carbonate equilibria shifts (~1822:192:17 μmol kg−1HCO3−:CO32‐:CO2) and CO2is taken up for photosynthesis, H+are neutralized by OH–which can raise the DBL pH (Fig. 6b). Higher DBL [H+] could also constrain cellular H+efflux in- volved in acid-base regulation, or as part of a HCO3– uptake me- chanism, due to a lower concentration gradient at the plasmalemma reversing the proton motive force (Fig. 6b). Further, upregulation of a HCO3−/OH– antiport cannot be ruled out (Fig. 6b). Therefore, CO2
uptake by diffusion, H+sequestration through HCO3–dehydration and CO2uptake, and/or OH–efflux to the DBL are all photosynthesis-driven mechanisms that could raise the DBL pH and ΩCaCO3 at macroalgal calcification sites under OA in the light (Fig. 6b). These results support observations of sustained calcification in the light by these species under OA even though equilibria chemistry (CO2SYS) predicts a 47%
decrease in DBL [CO32-] based on averages in this study.
In the dark, H+are not efficiently removed from the DBL and cal- cifying space even at ambient pH (Fig. 6c). Compounding this potential
acidification problem is an internal accumulation of respiratory CO2 that would need to diffuse out of the cell, or be hydrolyzed to HCO3–
and H+. Subsequently, the H+would need to be exported across the plasma membrane for acid-base regulation, and the respiratory CO2
sequestered in CaCO3. In addition to acid-base issues within and ex- ternal to the cell, energetics from photosynthesis, and potentially or- ganics for nucleation and other processes required to sustain optimal conditions for calcification are reduced. Although we measured modest increases in pH at the thalli surface relative to bulk seawater in the dark, only two rhodophyte species (Neogoniolithon,Jania) were able to maintain net positive calcification in the dark at ambient pH (McNicholl and Koch, unpublished data). Under OA in the dark, all species ex- amined herein (McNicholl and Koch, unpublished data) and by Kamenos et al. (2013)(Lithothamnion glaciale) exhibited net dissolution at average pH of 7.72 (19.4 nM H+) when CO32‐ levels declined (~1984:128:26 μmol kg−1HCO3−:CO32‐:CO2).
Thus, for marine calcifying macroalgae, photosynthesis is critical to remove H+from the DBL, promote ion flux that supports CCMs and DBL chemistry, and cellular acid-base homeostasis, particularly under OA conditions. While some rhodophytes sustain H+pumps and calci- fication in the dark, at low pH in the dark, ion pumps likely become overwhelmed by high DBL CO2and H+, even though they maintain the DBL pH above the bulk seawater. Certainly, additional studies are re- quired to further identify tropical macroalgae species-specific Fig. 6.Proposed model of DIC pathways and ion transport in the (a) light and (b) dark at ambient pH and (c) light and (d) dark at low pH indicative of ocean acidification (OA) for the year 2100, and the potential consequences for calcification (see text for details) in tropical marine macroalgae. Diffusive pathways between appressed surface filaments (utricles) are shown forHalimeda. Red dashed arrows depict potential changes in response to OA. The no symbol (∅) represent pathways that are limited and/or shut down under each scenario compared to the ambient pH conditions in the light (a). Yellow triangles (Δ) are proposed mechanisms or transport pathways that are predicted to slow or be negatively affected in the scenario relative to ambient pH conditions in the light (a). (For interpretation of the references to colour in this figure legend, the reader is referred to the web version of this article.)