https://doi.org/10.5194/bg-16-617-2019
© Author(s) 2019. This work is distributed under the Creative Commons Attribution 4.0 License.
Variation in brachiopod microstructure and isotope geochemistry under low-pH–ocean acidification conditions
Facheng Ye1, Hana Jurikova2, Lucia Angiolini1, Uwe Brand3, Gaia Crippa1, Daniela Henkel2, Jürgen Laudien4, Claas Hiebenthal2, and Danijela Šmajgl5
1Università degli Studi di Milano, Dipartimento di Scienze della Terra “A. Desio”, Milan, 20133, Italy
2GEOMAR Helmholtz-Zentrum für Ozeanforschung Kiel, 24148 Kiel, Germany
3Department of Earth Sciences, Brock University, St. Catharines, Ontario L2S 3A1, Canada
4Alfred-Wegener-Institut Helmholtz-Zentrum für Polar- und Meeresforschung, 27515 Bremerhaven, Germany
5ThermoFisher Scientific, Hanna-Kunath-Str. 11, 28199 Bremen, Germany Correspondence:Facheng Ye (facheng.ye@unimi.it)
Received: 16 July 2018 – Discussion started: 24 July 2018
Revised: 9 November 2018 – Accepted: 1 December 2018 – Published: 1 February 2019
Abstract. In the last few decades and in the near future CO2-induced ocean acidification is potentially a big threat to marine calcite-shelled animals (e.g. brachiopods, bivalves, corals and gastropods). Despite the great number of stud- ies focusing on the effects of acidification on shell growth, metabolism, shell dissolution and shell repair, the conse- quences for biomineral formation remain poorly understood.
Only a few studies have addressed the impact of ocean acid- ification on shell microstructure and geochemistry. In this study, a detailed microstructure and stable isotope geochem- istry investigation was performed on nine adult brachiopod specimens ofMagellania venosa(Dixon, 1789). These were grown in the natural environment as well as in controlled culturing experiments under different pH conditions (rang- ing from 7.35 to 8.15±0.05) over different time intervals (214 to 335 days). Details of shell microstructural features, such as thickness of the primary layer, density and size of endopunctae and morphology of the basic structural unit of the secondary layer were analysed using scanning electron microscopy. Stable isotope compositions (δ13C and δ18O) were tested from the secondary shell layer along shell onto- genetic increments in both dorsal and ventral valves. Based on our comprehensive dataset, we observed that, under low- pH conditions,M. venosaproduced a more organic-rich shell with higher density of and larger endopunctae, and smaller secondary layer fibres. Also, increasingly negativeδ13C and δ18O values are recorded by the shell produced during cul- turing and are related to the CO2 source in the culture set-
up. Both the microstructural changes and the stable isotope results are similar to observations on brachiopods from the fossil record and strongly support the value of brachiopods as robust archives of proxies for studying ocean acidification events in the geologic past.
1 Introduction
Since the industrial revolution the surface ocean pH has dropped by 0.1 units and is predicted to drop another 0.3–
0.5 units by 2100 (Caldeira and Wickett, 2005; Orr et al., 2005; IPCC, 2013). This is due to the increasing amount of atmospheric carbon dioxide (CO2) absorbed by the ocean that extensively affects seawater carbonate chemistry (e.g.
Caldeira and Wickett, 2003, 2005; Orr et al., 2005; Feely et al., 2004). Increased concentrations of anthropogenic CO2
are reflected in an elevated concentration of hydrogen ions, which lowers the pH and the availability of carbonate ions.
Effects on marine organisms are of great scientific interest for understanding the geological past and the consequences in the immediate future (e.g. Ries et al., 2009), since the de- crease in calcium carbonate saturation potentially threatens marine organisms forming biogenic calcium carbonate (e.g.
Orr et al., 2005; Guinott et al., 2006; McCulloch et al., 2012;
Jantzen et al., 2013a, b). This applies to calcium carbon- ate shell-forming species, such as brachiopods and mollusks, because they are considered excellent archives documenting
changes in environmental conditions affecting marine organ- isms (e.g. Kurihara, 2008; Comeau et al., 2009; Hahn et al., 2012, 2014; Watson et al., 2012; Cross et al., 2015, 2016, 2018; Crippa et al., 2016a; Milano et al., 2016; Garbelli et al., 2017; Jurikova et al., 2019).
Recently, several experiments were performed to investi- gate whether a change in seawater pH may affect growth rate, shell repair and oxygen consumption of calcifying organ- isms, and how they respond, in general, to ocean acidifica- tion (Supplement Table S1). However, despite the great num- ber of studies, the consequences for biomineral formation re- main not well understood, as most studies focused mainly on growth, metabolic rates, shell dissolution and shell repair (Table S1, and references therein). Only a few studies deal with the effect of acidification on microstructure (Beniash et al., 2010; Hahn et al., 2012; Stemmer et al., 2013; Fitzer et al., 2014a, b; Milano et al., 2016), and most of them focused on bivalves and show that neither microstructure nor shell hardness seem to be affected by seawater pH.
The few studies that examined brachiopods or brachiopod shells suggest that the latter suffered increased dissolution under lower seawater pH. In other studies, the organism ei- ther exhibited no changes or an increase in shell density (cal- culated as dry mass of the shell (g)/shell volume (cm3)), but otherwise no changes in shell morphology and trace chem- istry (Table 1). Cross et al. (2018) found that punctae became narrower over the past 120 years, which partially explained the increase in shell density over this period. Overall, there appears to be little to no apparent effect on brachiopod mor- phology or chemistry with lower seawater pH (Cross et al., 2015, 2016, 2018).
Brachiopods possess a low-magnesium calcite shell, which should be more resistant compared to the more sol- uble forms of CaCO3such as aragonite and high-Mg calcite (Brand and Veizer, 1980; Morse et al., 2007). The shell mi- crostructure of Rhynchonelliformean brachiopods has been used as a powerful tool to understand the biomineral’s re- sponse to modern global ocean acidification and similar events in the geologic past (Payne and Clapham, 2012; Cross et al., 2015, 2016; Garbelli et al., 2017). A comprehensive study focusing on fossil brachiopods during the end-Permian mass extinction showed that brachiopods produce shells with increased organic matter content during ocean acidification events (Garbelli et al., 2017).
Here, we describe the microstructure and carbon and oxy- gen isotopic composition of brachiopod shells belonging to the cold–temperate water speciesMagellania venosa(Dixon, 1789) grown in natural environments as well as under pH- controlled culturing conditions. M. venosa represents the largest recent brachiopod species, is often locally abundant (e.g. in Chile; Försterra et al., 2008), and has the highest growth rate recorded for recent brachiopods (Baumgarten et al., 2014). Its low-magnesium calcite shell consists of a microgranular primary layer and a fibrous secondary layer (Smirnova et al., 1991; Baumgarten et al., 2014; Casella et
al., 2018; Romanin et al., 2018) crossed by perforations – endopunctae.
Since little is known about the microstructural and geo- chemical responses of brachiopods to increased ocean acid- ification, the main goal of this study is to document any changes in this highly important archival marine organism.
We will describe whether and how shell microstructural fea- tures such as the primary layer thickness, density of endop- unctae and fibre morphology, together with their stable car- bon (δ13C) and oxygen (δ18O) isotope compositions, respond to low seawater pH conditions.
2 Materials and methods
2.1 Brachiopod samples and culturing set-up
A full description of the brachiopod sampling and cultur- ing procedure is provided in Jurikova et al. (2019), but we provide an abbreviated version and reiterate the key points.
Nine adult individuals ofM. venosa(Dixon, 1789) were cho- sen for microstructure investigation and evaluation of their δ13C andδ18O values. All specimens were collected by sci- entific SCUBA divers alive from 20 m water depth of Comau Fjord (Chile) at different localities (Fig. 1). Specimens no.
158 and no. 223 did not experience any treatment after col- lection from Comau Fjord. The other specimens, no. 43, no.
63, no. 8004, no. 8005, no. 9004, no. 9005 and no. 9006, were cultured under different pH conditions at either AWI in Bremerhaven or GEOMAR (at KIMOCC – Kiel Marine Organisms Culture Centre) in Kiel, Germany (Tables 2 and 3).
In summary, individuals ofM. venosawere collected alive in Chile and transported to GEOMAR, Germany, in plastic bags filled with seawater, and maintained under controlled conditions in a climate laboratory. The brachiopods were first acclimatized under control conditions for 5 weeks, and prior to the start of the experiment were labelled with a fluores- cent dye – calcein (Sigma, CAS 1461–15–0; 50 mg L−1for 3 h) (e.g. Baumgarten et al., 2014; Jurikova et al., 2019). As a culture medium we used artificial seawater, which was pre- pared by mixing a commercial salt with deionized water until the desired salinity and chemical composition were achieved (Atkinson and Bingman, 1998). An overview of the cultur- ing set-up at both laboratories is available in Table 2. Spec- imens no. 43 and no. 63 were cultured at AWI at pH=7.66 (pCO2=1390 µatm) and pH=7.44 (pCO2=2610 µatm) from 29 August 2013 to 31 March 2014, respectively. Spec- imens nos. 8004, 8005, 9004, 9005 and 9006 were cul- tured concurrently at GEOMAR under control or low-pH conditions. Specimens no. 8004 and no. 8005 were main- tained under pH settings of 8.0–8.15 from 4 August 2016 to 5 July 2017, conditions similar to those of their fjord habitat.
In contrast, specimens nos. 9004, 9005 and 9006 were cul- tured under low-pH artificial seawater conditions. Low-pH
Table1.Culturing,dissolutionexperimentsandnaturalvariationonseveralbrachiopodspeciesandshells. Species n(numberofsample)GrowthparametersShellre- pair/microstructure/oxygen consumption/dissolutionof shell/microstructure MethodandmaterialEnvironment/conditions T:temperature(◦C) S:salinity(PSU) pCO2(µatm) Durationofexperi- mentSource Calloriainconspicua (Sowerby,1846) n=123
(1)>3mminlength undamagedindividuals werenotaffected bylowerpH; (2)<3mminlength undamagedindividu- alsgrewfasteratpH 7.62thanthecontrol conditions Shellgrowthratesandshellre- pairfrequencieswerenotaf- fectedbylowpH(>80%ofall damagedindividualsrepaired after12weeks)
Cultureexperiment(a)pH8.16,T16.5,S33.9,pCO2465, calcite3.5 (b)pH7.79,T16.9,S33.9,pCO2 1130,calcite1.6 (c)pH7.62,T16.6,S33.9,pCO2 1536,calcite1.3
12weeksCrossetal.(2016) Calloriainconspicua (Sowerby,1846) nadult=389forshell morphologyanalyses∗
Punctaewidthdecreasedby 8.26%,shelldensityincreased by3.43%,nochangeinshell morphology,punctaedensity, shellthickness,andshellele- mentalcomposition(Ca,Mg, Na,SrandP) Nochangeswerefoundin shelldissolutionoverthelast 120years.
Collectedeverydecade fromonelocalityLast2decadespHreduced0.1unit Temperaturevariedfrom10.7to 13.0◦C pCO2variedfrom320to400 Salinityandcalcitenotprovided
120-yearrecordCrossetal.(2018) Liothyrellauva (Broderip,1833) n=156
Notaffectedbylower pHandtemperatureShellrepairfrequencieswere notaffectedbylowpHandtem- perature (>83%ofindividualsrepaired after7months) Cultureexperiment(a)pH7.98,T−0.3,S35,pCO2417, calcite1.20 (b)pH8.05,T1.7,S35,pCO2365, calcite1.49 (c)pH7.75,T1.9,S35,pCO2725, calcite0.78 (d)pH7.54,T2.2,S35,pCO21221, calcite0.50
7monthsCrossetal.(2015) Liothyrellauva (Broderip,1833) npost-mortem=5
NotapplicableHigherdissolutioningas- tropodsandbrachiopodsat lowerpHafter14days Emptyshells(a)pH7.4,T4,S35,calcite0.74 (b)pH8.2,T4,S35,calcite4.22 pCO2notprovided 14to63daysMcClintocket al.(2009) ∗Asubsampleof40brachiopods(twotofivespecimensperdecadeoverthelast120years)wereusedforfurthershellanalysisofshelldensity,punctalwidth,punctaldensity,shelldissolution,shellthicknessandshellelementalcomposition.
Table 2.Culture and sensor systems used inM. venosaculturing (specimens: no. 43, no. 63, no. 8004, no. 8005, no. 9004, no. 9005 and no.
9006). Operated under controlled experimental settings in climate-controlled laboratories at Alfred-Wegener-Institut Helmholtz-Zentrum für Polar- und Meeresforschung, Bremerhaven, Germany, and at GEOMAR Helmholtz-Zentrum für Ozeanforschung Kiel, Germany.
Culture system at AWI Automated sensor systems at AWI
Culture system at GEOMAR Automated sensor systems at GEOMAR
Aquarium (150 L/each pH treatment)
Aquarium (150 L/each pH treatment)
Supplied from a reservoir tank (twice a week 20 % water was replaced)
Supplied from a reservoir tank (twice a month 10 % water was replaced)
Temperature Controlled in temperature con- stant room
Controlled using heaters or coolers
Temperature sensor pond
pCO2 Bubbling of CO2 COMPORT, Dennerle, Vin-
ningen; IKS aquastar Aquar- ium computer V2.xx with Aquapilot 2011
Bubbling of CO2-enriched air CONTROS HydroC® under- water CO2sensor
Salinity Mixing Reef commercial sea salt (until October: Aqua Medic, Bissendorf, Ger- many, thereafter Dupla Marin Reef Salt, Dohse Aquaristik, Grafschaft-Gelsdorf, Ger- many) with deionized water
Conductivity electrode Mixing Tropic Marin Pro–
Reef commercial sea salt with deionized water
Conductivity electrode
Filtering Biofilter, protein skimmer and UV sterilizer
Biofilter, protein skimmer and UV sterilizer
Food Regularly fed (typically five times per week) with Dupla Rin, Coral Food, Reef Pearls 5–200 µm, aliveThalassiosira weissflogii,and 1-day old nau- plii ofArtemia salina
Regularly fed (typically five times per week) with Rhodomonas baltica
Substrate Sabia Corallina, 7–8 mm, Dohse Aquaristik, Grafschaft- Gelsdorf, Germany
No
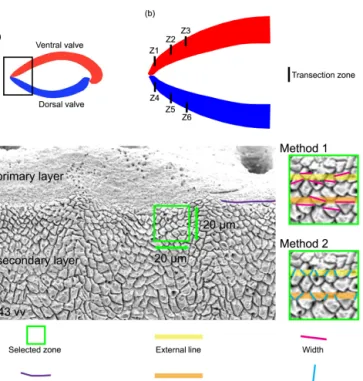
conditions were achieved by bubbling of CO2 through the tanks at AWI, and by bubbling CO2-enriched air through the tanks at GEOMAR (Table 2). The acidification experiment at GEOMAR was performed in two phases; the first one from 4 August 2016 to 18 April 2017 during which thepCO2was set to 2000 µatm (corresponding to a pH of 7.60), and the sec- ond one during which thepCO2was set to 4000 µatm (corre- sponding to a pH of 7.35) from 18 April 2017 to 5 July 2017 (Table 3). In order to distinguish between the shell parts pre- cipitated under the specific pH conditions as well as to al- low exact comparison to shells of the control treatment, cal- cein marking was also carried out prior to the second low- pH experiment of 4000 µatm. Parts of the shell grown under specific pH conditions are indicated in Fig. 2. In addition to the calcein marking, newly grown shell parts may be distin- guished from visible growth lines on the surface of the shell (Fig. 2). The total length (maximum distance from the blue
line to the anterior margin) of the curved dorsal and ventral valves grown during 11 months of culturing (Fig. 2) varied from < 5 to 15.6 mm (Table 4).
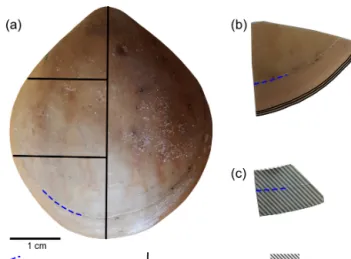
2.2 Microstructural analysis
This study followed the sample preparation method shells suggested by Crippa et al. (2016b). In order to obtain more detailed data on microstructural changes, the samples were cut with a diamond blade along different axes and direc- tions (Fig. 3a). Subsequently, the samples were immersed in 36-volume hydrogen peroxide (H2O2) for 24/48 h to re- move the organic tissue. The sectioned surfaces were manu- ally smoothed with 1200 grit sandpaper, then quickly (3 s) cleaned with 5 % hydrochloric acid (HCl), immediately washed with water and air-dried. The time of acid etching was kept short so as not to affect the microstructure (Crippa et al., 2016b). Finally, the valve sections were gold-coated
Table3.SpecimensofM.venosasampledfromComauFjord,Chile,andnaturalandexperimentalculturingconditions. SampleIDSamplelocalityatCo- mauFjord(Chile)1Sampleseawater conditions2DateofcollectionLengthofventralvalve (mm)Durationofex- perimentExperimentalconditions No.43LilliguapipH:∼7.9 T:∼13 S:∼32 D:20
Feb201237214days3pCO2:1390,pH:7.66±0.04 T:11.6±0.5,S:32.6 cal:2.0 No.63LilliguapipH:∼7.9 T:∼13 S:∼32 D:20
Feb201223214days3pCO2:2600,pH:7.44±0.08 T:11.7±0.5,S:32.7 cal:1.4 No.158HuinayDockpH:∼7.9 T:∼13 S:∼32 D:20
Dec201136no No.223CahuelmópH:∼7.9 T:∼13 S:∼32 D:23
Feb201230no No.8004ComauFjordpH:∼7.9 T:∼13 S:∼32 D:21
Apr201631335days4pCO2:600 pH:8.00to8.15±0.05 T:10±1,S:30 cal:2.0–3.5 No.8005ComauFjordpH:∼7.9 T:∼13 S:∼32 D:21
Apr201646335days4pCO2:600 pH:8.00to8.15±0.05 T:10±1,S:30 cal:2.0–3.5 No.9004ComauFjordpH:∼7.9 T:∼13 S:∼32 D:21
Apr201641335days4pCO2:2000–40005 pH:7.60to7.35±0.05 T:10±1,S:30 cal:0.6–1.1 No.9005ComauFjordpH:∼7.9 T:∼13 S:∼32 D:21
Apr201625335days4pCO2:2000–40005 pH:7.60to7.35±0.05 T:10±1,S:30 cal:0.6–1.1 No.9006ComauFjordpH:∼7.9 T:∼13 S:∼32 D:21
Apr201643335days4pCO2:2000–40005 pH:7.60to7.35±0.05 T:10±1,S:30 cal:0.6–1.1 Note:D:depth(m),T:temperature(◦C),S:salinity(PSU–practicalsalinityunits),pCO2(µatm).1Cahuelmó42◦1502300S,72◦2604200W,Cross–Huinay42◦2302800S,72◦2702700W,Jetty(HuinayDock)42◦2204700S, 72◦2405600W,Lilliguapi42◦904300S,72◦3505500W;samplenos.8004,8005,9004,9005,and9006wereharvestedfromthreesitesinComauFjord(Cross-Huinay,Jetty,andLiliguapy),Chile.2Reference:Laudienetal.(2014)and Jantzenetal.(2017).3CultureexperimentsconductedatAlfred-Wegener-InstitutHelmholtz-ZentrumfürPolar-undMeeresforschung,Bremerhaven,Germany.4CultureexperimentsconductedatGEOMARHelmholtz-Zentrum fürOzeanforschungKiel,Germany(Jurikovaetal.,2019).5CO2concentrationwaschangedduringtheexperiment:to2000µatmfrom4August2016to18April2017andto4000µatmfrom18Aprilto5July2017.
Table 4.Shell length of specimens ofM. venosabefore and during the culture.
Sample ID Valve Initial length New shell pH New shell pH
before culturing growtha growthb
(mm) 257 days (mm) 78 days (mm)
No. 8004 ventral 15.4 14 8.00 1.6 8.15
No. 8005 ventral 40 5 8.00 < 1 8.15
No. 8005 dorsal 36 4 8.00 < 1 8.15
No. 9004 ventral 26.8 13 7.60 1.2 7.35
No. 9005 ventral 11.2 12 7.60 1.8 7.35
No. 9006 ventral 33 9 7.60 < 1 7.35
No. 9006 dorsal 29 8 7.60 < 1 7.35
Note:aculturing from 4 August 2016 to 18 April 2017;bculturing from 18 April 2017 to 5 July 2017.
Figure 1.Map of Comau Fjord.(a)Overview of Chilean Patagonia.
(b)Gulf of Ancud with connections in the north and south to the Pacific Ocean.(c)Comau Fjord with brachiopod sample collection localities. In both maps the rectangle marks the location of Comau Fjord.
and analysed by a Cambridge S-360 scanning electron micro- scope with a lanthanum hexaboride (LaB6) source operating at an acceleration voltage of 20 kV (Dipartimento di Scienze della Terra “A. Desio”, Università di Milano).
Figure 2.Growth tracked with calcein and marked by blue and red lines on the surface of the brachiopod specimens (no. 9006).
Figure 3.Brachiopod shell sample cut along different axes.(a)Lon- gitudinal and transverse sections;(b)transverse sections at the an- terior margin of the shell;(c)plane grinding of the external surface of the shell.
The methods described by Ye et al. (2018a) were fol- lowed to investigate the basic microstructural units (fibres) in SEM images. We focused primarily on the anterior mar- gin of the valves, the part that was produced during cultur- ing (hereinafter referred to asduring-culturing) under differ- ent pH conditions. Therefore, additional transverse sections along the growth lines were obtained in the most anterior part (black lines in Fig. 3b) by manually smoothing with 1200 grit sandpaper. Plane grinding was performed on the external sur- face of the shell (Fig. 3) to investigate the distribution of en- dopunctae.
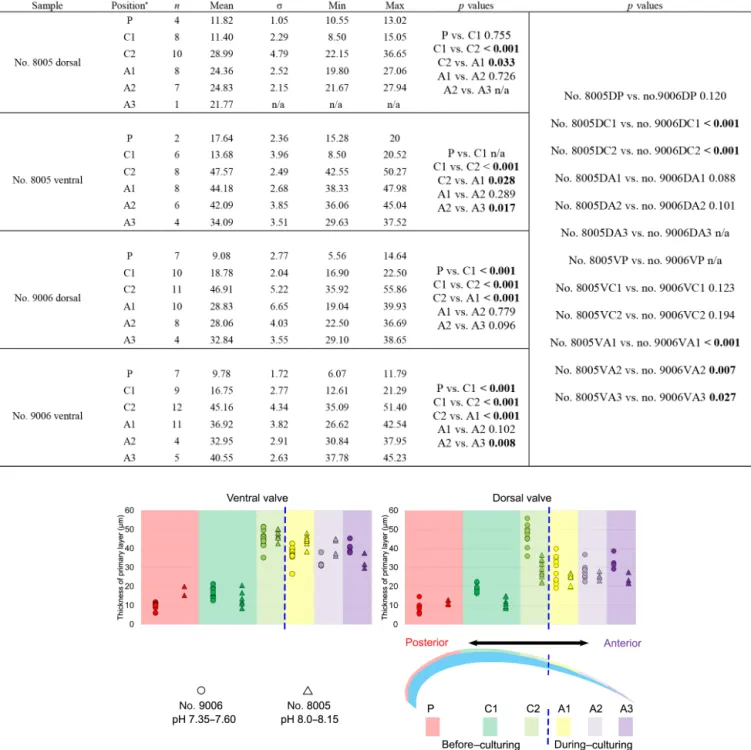
The thickness of the primary layer was measured on the SEM images of specimens no. 8005 and no. 9006 (Fig. 4a) in different positions along the longitudinal growth axis (pos- terior, central and anterior regions). In the vicinity of the tran- sition from natural growth to cultured growth, the region was further subdivided into four sub-zones.
To calculate and measure the density and diameter (max) of endopunctae, squares (800 µm×800 µm) were located randomly over the smoothed external surface of the an- terior shell (Fig. 4b). Four sub-zones (C2, A1, A2, A3) were defined according to their position along the posterior–
anterior direction (Fig. 4), while distinguishing the part of the shell produced before-culturing and that producedduring- culturing.
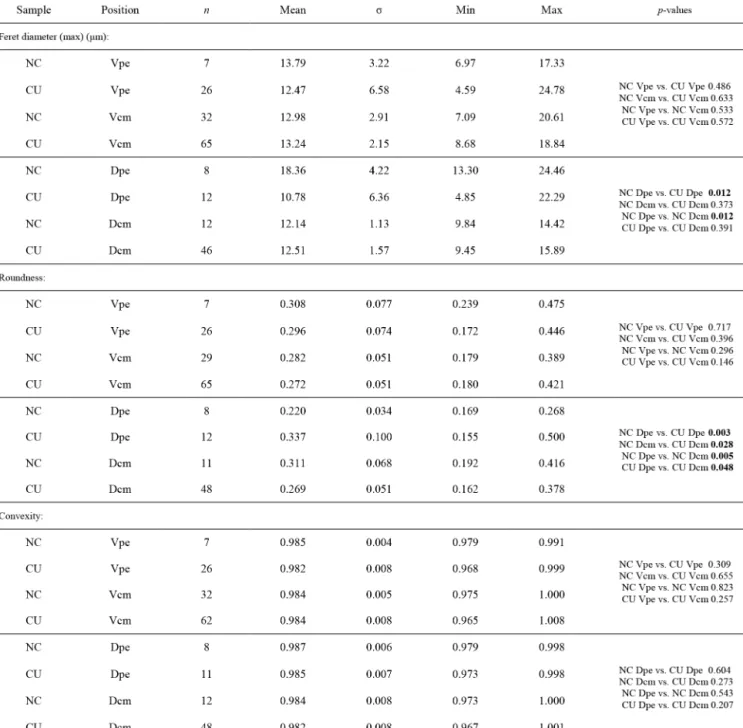
For morphometric analyses, fibres were manually outlined using polygonal lasso in Adobe Photoshop CS6, and size and shape parameters were measured with Image-Pro Plus 6.0 and ImageJ (for convexity). In particular, following Ye et al. (2018a, b) we measured/calculated the Feret diame- ter (max), area, roundness (4area/π×Feret diameter (max)2) and convexity (convex perimeter / perimeter). The width of an individual fibre roughly corresponds to its Max Feret di- ameter, whereas its height corresponds to the Min Feret di- ameter (see Fig. 6 in Ye et al., 2018a).
As individual fibres are irregular in shape in the most an- terior section of brachiopods, the morphometric measure- ment method proposed by Ye et al. (2018a, b) is not always suitable. Thus, modifications had to be made to the Ye et al. (2018a, b) measurement method to make the comparative morphometric analysis of the fibres from the anterior part (Fig. 5a, b). First, all SEM images were oriented in the same direction with the base of the primary layer facing upwards.
Then a uniformly sized zone (20 µm×20 µm) was selected for additional measurements with the upper side of the square always placed at the boundary between the primary and sec- ondary layers (Fig. 5c). Two new methods were developed and applied: for Method 1, the width of fibres crossed by two standard lines was measured, which were always located in the same position and at the same distance in all the se- lected zones (yellow and orange lines in Fig. 5, Method 1).
For Method 2, we calculated the number of boundaries based on the number of fibres crossed by the two standard lines (Fig. 5, Method 2). Sub-zones were named according to the following nomenclature: the most anterior transection zone
of the ventral valve was named Z1, the second most ante- rior transection zone of the ventral valve Z2, and so on; the most anterior transection zone of the dorsal valve was named Z4. The standard line facing the primary layer was named
“1” and the second standard line “2” (example: “Z1-1” is the sample of the standard line facing the primary layer at the most anterior transect zone of the ventral valve).
2.3 Stable isotope analyses of shells
Cleaned shells of specimens nos. 8004, 8005, 9004, 9005 and 9006 were chosen for carbon and oxygen isotope anal- yses. For specimens no. 8005 and no. 9006, surface con- taminants and the primary layer were first manually and then chemically removed by leaching with 10 % HCl, rinsed with distilled water and air-dried. As the primary layer is not secreted in equilibrium with ambient seawater (e.g. Car- penter and Lohmann, 1995; Brand et al., 2003, 2013), it is important to chemically remove it in order to avoid cross- contamination of results. Individual growth increments ex- clusively come from the secondary layer, and were sepa- rated from the shell in both dorsal and ventral valves us- ing a WECHEER (WE 248) microdrill at low speed with a tungsten–carbide milling bit. Shell increment fragments, of similar width, were then powdered using an agate mor- tar and pestle. For carbon and oxygen isotope analyses about 250 µg of powdered calcite of each sample was analysed us- ing an automated carbonate preparation device (GasBench II) connected to a Delta V Advantage (Thermo Fisher Sci- entific Inc.) isotopic ratio mass spectrometer at the Earth Sciences Department, University of Milan, Italy. The car- bon and oxygen isotope compositions are expressed in the conventional delta notation calibrated to the Vienna Pee- Dee Belemnite (V-PDB) scale by the international standards IAEA 603 (International Atomic Energy Agency 603;δ18O:
−2.37±0.04 ‰,δ13C:+2.46±0.01 ‰) and NBS 18 (δ18O:
−23.2±0.1 ‰,δ13C:−5.014±0.035 ‰). Analytical repro- ducibility (1σ ) for these analyses was better than±0.04 ‰ forδ13C and±0.1 ‰ forδ18O (Appendix A). Another set of shells, no. 8004, no. 9004 and no. 9005, were gently rinsed with ultra pure water (Milli-Q) and dried for a few days on a hotplate at 40◦C in a clean flow hood. Targeted parts of the shell were sampled for powder under binoculars using a precision drill (Proxxon) with a mounted dental tip. Stable isotope analyses of powders of these specimens were per- formed at GEOMAR, Kiel, on a Thermo Finnigan MAT 252 mass spectrometer coupled online to an automated Kiel car- bonate preparation line. The external reproducibility (1σ) of in-house carbonate standards was better than ±0.1 ‰ and
±0.08 ‰ forδ13C andδ18O, respectively (Appendix A).
2.4 Stable isotope analyses of water samples
In addition to carbon and oxygen isotope analyses of shells, analyses were also carried out on seawater samples collected
Figure 4.Measurement methods used for the thickness of the primary layer(a)and the density of the endopunctae(b). Note that for the latter, endopunctae were counted when included for more than their half-diameter inside the square. dv: dorsal valve.
Figure 5.Methods of measurements used in the anterior transverse sections. All SEM images are oriented in the same direction: base of the primary layer facing upwards. A square (20 µm×20 µm) was analysed with its upper side just overlapping the boundary between the primary and secondary layers. Method 1 refers to the measure- ment of the width of the fibres crossed by two standard lines, which were located in the same position and at the same distance in all 194 squares (yellow and orange lines); Method 2 involved the cal- culation of the numbers of boundaries between the fibres that are crossed by two standard lines. vv: ventral valve.
from the culturing tanks. Measurements of δ13CDIC and δ18OH2O were performed using Thermo Scientific™ Delta Ray™IRIS with URI Connect.
Isotope values (δ13C,δ18O) are reported as per mil (‰) de- viations of the isotopic ratios (13C/12C,18O/16O) calculated to the VPDB scale forδ13C and VSMOW scale forδ18O val- ues. Analytical reproducibility (1σ) on three aliquots of each water sample was≤0.03 ‰ for bothδ13C andδ18O values (Appendix B).
3 Results
3.1 Primary layer thickness
The thickness of the primary layer was measured at differ- ent positions along the shell from the posterior (umbonal) region to thebefore-culturingportion and finally to the an- terior valve margin (Fig. 6). Generally, in the posterior part ofM. venosa, the primary layer is missing or it has the low- est recorded thickness. Then, the primary layer progressively thickens toward the central and anterior parts. The thickest primary layer within the same valve is always located just before the beginning of the culture (before-culturingportion, Table 5).During-culturingthe thickness of the primary layer decreases. A most distinct change was observed in specimen no. 9006 cultured at the lowest pH condition of 7.6, and of 7.35 followed by another progressive increase in both valves during-culturing. In contrast, the thickness of the primary layer of the control condition specimen (no. 8005) remained stable (dorsal valve) or slightly decreased (Fig. 6, ventral valve; Table 5).
Table 5.Statistical comparison of thickness of the primary layer (µm) along the ontogenetic direction of both valves of specimens no.
8005 and no. 9006before-andduring-culturing.∗Position of zonesbefore-culturing: P, C1, C2;during-culturing: A1, A2, A3 (cf. Fig. 6).
n=number of measurements. Population standard deviation (σ) was calculated using the Excel STDEV.P function. Significant values (p- value≤0.05) are marked in bold. “n/a” stands for not applicable.
Figure 6.Variation of the thickness of the primary layer (ventral and dorsal valves) of aM. venosaspecimen cultured at pH 7.35 and 7.6 (no.
9006) and a specimen cultured at pH 8.0 and 8.15 (no. 8005).
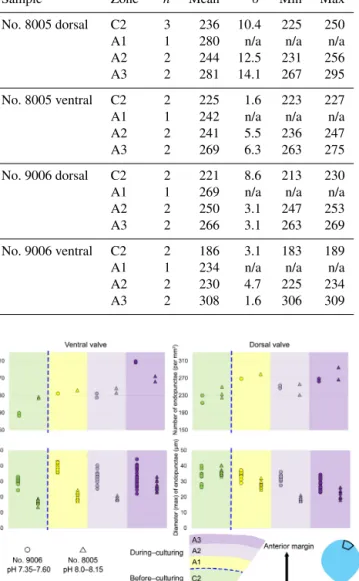
3.2 Endopunctae density and size
On the externally ground surface of the anterior part, the total number and the diameter (max) of endopunctae in a squared area of 800 µm×800 µm were measured in four
before-culturing parts and of the during-culturing parts of the shell (Fig. 7). Generally, the density of endopunctae gradually increased along the selected transect from ca. 185 to ca. 305 mm−2 in the ventral valve and from ca. 220 to ca. 280 mm−2in the dorsal valve (Table 6). The size of en-
Table 6.Statistical comparison of the number of endopunctae (per mm2) on both valves of no. 8005 and no. 9006.∗Position of zones before-culturing: C2, andduring-culturing: A1, A2, A3 (cf. Fig. 7).
“n/a” stands for not applicable.
Sample Zone∗ n Mean σ Min Max
No. 8005 dorsal C2 3 236 10.4 225 250
A1 1 280 n/a n/a n/a
A2 2 244 12.5 231 256
A3 2 281 14.1 267 295
No. 8005 ventral C2 2 225 1.6 223 227
A1 1 242 n/a n/a n/a
A2 2 241 5.5 236 247
A3 2 269 6.3 263 275
No. 9006 dorsal C2 2 221 8.6 213 230
A1 1 269 n/a n/a n/a
A2 2 250 3.1 247 253
A3 2 266 3.1 263 269
No. 9006 ventral C2 2 186 3.1 183 189
A1 1 234 n/a n/a n/a
A2 2 230 4.7 225 234
A3 2 308 1.6 306 309
Figure 7.Variation in the number and diameter (max) of endopunc- tae in the dorsal and ventral valves from a specimen ofM. venosa cultured at pH 7.35 and 7.6 (no. 9006) and a specimen cultured at pH 8.0 and 8.15 (no. 8005).
dopunctae increased along the selected transect in the ventral valve (from ca. 17 to 33 µm; Table 7), but it slightly decreases in the dorsal valve from ca. 36 µm to ca. 21 µm (Table 7).
These density and size trends were observed in both speci- mens cultured under different pH conditions. However, it is noteworthy that in the most anterior part (during-culturing) of the ventral valve of no. 9006 (cultured at a pH of 7.35), the density of endopunctae sharply increases and their diameter reached recorded maximum values (Table 6).
Figure 8.Comparisons of the fibre size and shape ofM. venosa (ventral and dorsal valves) at different positions along the posterior–
anterior axis; pH conditions of culturing or natural environment are reported. One circle point represents one measurement. Out- liers have been removed, identified with Tukey’s fences (Tukey, 1977) when falling outside fences F1 and F2 (F1=Q1−1.5IQR;
F2=Q3+1.5IQR; Q1/Q3: first/third quartiles; IQR (interquartile range): Q3–Q1).
3.3 Shell morphometrics 3.3.1 Before-culturing
Ontogenetic variation in fibre morphometry is not obvious when all six adult specimens are considered (Table 8). How- ever, clearer growth trends can be observed when considering the data from each single specimen separately, wheret-tests on morphometric data from specimens no. 8005 and no. 9006 show that there are significant differences in Feret diameter (max) and roundness between the posterior and the middle part of the shell (Table 9). Overall, in specimens no. 8005 and no. 9006, fibres become wider from the posterior to mid- shell. In contrast, no. 63 shows an opposite trend along the posterior to mid-shell direction (Fig. 8). The fibre size and shape in the other specimens are rather constant.
3.3.2 During-culturing
Transverse sections obtained by smoothing of the anterior part of the shell allowed us to measure the width of 1392 fibres (Max Ferret diameter (max); see in Method 1) and se- lect 388 sub-zones for fibre boundary calculation. In addi- tion, they allowed us to focus on the parts that were produced under the different low-pH treatments (7.66, 7.60, 7.44, and 7.35, respectively).
In all six specimens, the width of fibres increases and the number of boundaries decreases along a transect from the more external sub-zone to the immediately inner sub-zone (e.g. Z1-1 to Z1-2; Z2-1 to Z2-2; and Z3-1 to Z3-2 in Fig. 9a, b, c, d). This means that within a 10 µm distance the sizes of fibres become larger from the exterior part to the interior part of the shell.
Table 7.Statistical comparison of the diameter (max) (µm) of endopunctae on valves of no. 8005 and no. 9006.∗Position of zonesbefore- culturing: C2, andduring-culturing: A1, A2, A3 (cf. Fig. 7). Significant values (p-value≤0.05) are marked in bold.
Figure 9.Differences in sizes of fibres ofM. venosa(ventral and dorsal valves) in the anterior transverse sections of specimens cul- tured under different pH conditions.(a, b)The bottom/top of the box and the band inside the box are the first/third quartiles and the median of the data, respectively; ends of the whiskers represent the minimums and maximums.(c, d)Circle point represents average data;Nm: number of measurement.
Results from specimen no. 9006 (pH: 7.60 and 7.35) were compared to those of control specimen no. 8005 (pH: 8.00 and 8.15). Specimen no. 9006 cultured under low-pH condi- tions (pH: 7.60 and 7.35) had narrower fibres and a higher number of fibre boundaries when compared to those of con- trol specimen no. 8005 (Fig. 9a, c). It is worth noting that, in comparison between the two specimens, the fibres from Z1-2 and Z2-2 of no. 9006 are significantly smaller than those of no. 8005. However, there is no significant difference in the size of fibres from sub-zone Z3-2 between the two specimens (Table 10).
The results from specimens (no. 43 and no. 63) grown un- der low-pH conditions (pH: 7.66 and 7.44) for a short time interval of 214 days are difficult to interpret, as in this case there is no direct control experiment sample to compare with the cultured specimens (Fig. 9b, d). The specimens grown in the natural environment (no. 158 and no. 223) have different sizes and ages, and so different growth rates may affect the size of the fibres.
3.4 Stable isotopes
The carbon and oxygen isotope compositions were measured along the shell growth increments in the dorsal and ventral valves (Fig. 10). In the before-culturing part of the shell, δ13C values varied between−2.02 and+0.45 ‰ in control group specimens no. 8004 and no. 8005, whereas they var- ied between−9.24 and−0.53 ‰ in low-pH group specimens
Table 8.Statistical comparison of fibre size and shape of the posterior external vs. central middle parts of the ventral and dorsal valves. NC:
non-cultured samples no. 158 and no. 223; CU: cultured samples nos. 43, 63, 8005, and 9006; Vpe: ventral posterior external, Vcm: ventral central middle, Dpe: dorsal posterior external, Dcm: dorsal central middle. Significant values (p-value≤0.05) are marked in bold.
nos. 9004, 9005 and 9006. Similarly, in thebefore-culturing shell part,δ18O values varied between−2.39 and+0.21 ‰ in control group specimens no. 8004 and no. 8005, but varied between−4.92 ‰ and+0.05 ‰ in low-pH group specimens nos. 9004, 9005 and 9006.
In theduring-culturingpart,δ13C values varied between
−6.80 and −1.34 ‰ in control group specimens no. 8004 and no. 8005, whereas they varied between −27.09 ‰ and
−9.69 ‰ in low-pH group specimens nos. 9004, 9005 and
9006 (Fig. 10). Concomitantly,δ18O values varied between
−6.80 ‰ and−1.34 ‰ in control group specimens no. 8004 and no. 8005, but varied between−6.97 ‰ and−5.29 ‰ in low-pH group specimens nos. 9004, 9005 and 9006 (Fig. 10).
A marked drop inδ13C andδ18O is recorded in the shell increments producedduring-culturing, particularly so in the specimens grown under low-pH conditions of 7.60 and 7.35, whereδ13C values decreased to−27.09 ‰ (Fig. 10).
Table 9.Statistical comparison of fibre size and shape data of the posterior external vs. central middle area for no. 8005 and no. 9006, considering both valves together. pe: posterior external; cm: central middle. Significant values (p-value≤0.05) are marked in bold.
Figure 10. Plots ofδ13C andδ18O of the ventral and dorsal valves ofM. venosaspecimens along their growth axis. Different colour backgrounds represent different pH conditions during growth. When few data were available, data points were joined by dashed lines.
Table 10.Statistical comparison of fibre sizes ofM. venosa(ventral and dorsal valve) in the anterior transverse sections (during-culturing).
∗For the position of zones (Z1-1, Z2-1, Z3-1, Z1-2, Z2-2, Z3-2, Z4-1, Z5-1, Z4-2, Z5-2), see Fig. 9. Significant values (p-value≤0.05) are marked in bold. “n/a” stands for not applicable.
4 Discussion
4.1 Microstructure and organic component relationship
Before discussing whether and how acidification may affect the microstructure of the brachiopod shell, it is important to examine the relationship between the microstructure and the number of organic components within the shell. It has al- ready been stated that, in fossil and recent brachiopods, dif- ferent shell microstructures have different numbers of shell organic components (Garbelli et al., 2014; Garbelli, 2017;
Casella et al., 2018; Ye et al., 2018a).
This holds true for most rhynchonelliformean bra- chiopods: the primary layer ofM. venosaconsists of acicular and granular calcite (Williams, 1968, 1973, 1997; MacKin- non and Williams, 1974; Williams and Cusack, 2007; Casella et al., 2018). Analyses of electron backscatter diffraction show that the primary layer is a thin nanocrystalline layer with higher micro-hardness and smaller-sized calcite crystal- lites compared to those of the secondary layer (Griesshaber et al., 2004). In addition, each spherical and small unit is coated by a mixture of organics and amorphous calcium carbon- ate (Cusack et al., 2010). This,per se, may suggest a higher amount of organic components associated with the primary layer in contrast to other shell layers (i.e. secondary or in some species tertiary layer), but it has never been proven.
In fossils, the primary layer is likely absent or, if present, diagenetically altered, and it will luminesce (Grossman et al., 1991), suggesting that higher amounts of organics may be present. However, this has also been ascribed to the incorpo- ration of magnesium into the lattice (Popov et al., 2007; Cu- sack et al., 2008). A report of higher sulfur concentration in the primary layer of the brachiopodTerebratulina retusamay suggest the presence of a sulfur-rich organic component, but backscatter electron imaging revealed contradictory results (England et al., 2007). Cusack et al. (2008) showed that, in the same species, the sulfate concentration is higher in the primary layer than in the secondary layer.
Since there is no conclusive evidence for this observation, we cannot relate the increase in thickness of the primary layer to changes in organics within the shell. With respect to previous findings (Williams, 1966; Parkinson et al., 2005), our results show that the thickness of the primary layer of M. venosais much less uniform and shows an increase with growth, which is more evidentduring-culturingunder low- pH conditions. However, disturbances (stress condition with handling before and at the start of the culturing) may also cause an abrupt change in thickness.
Endopunctae, which during life are filled with mantle ex- pansions, are widely distributed in the shell ofM. venosaand show the superficial hexagonal close-packing pattern docu- mented by Cowen (1966). The biological function of endop- unctae is still controversial, with some suggesting that, gen- erally in living organisms, they serve as support and protec-
tion structures (Williams, 1956, 1997), as sensors, or as stor- age and respiration features (Pérez-Huerta et al., 2009). With more endopunctae filled by mantle expansions, the amount of organic tissue would increase in the same volume of shell.
The density of endopunctae has been related to temperature, as species living at higher temperatures have greater endop- unctae density (Campbell, 1965; Foster, 1974; Peck et al., 1987; Ackerly et al., 1993). The present analyses support the concept that the increase in endopunctae density may be re- lated in part to ontogeny and to low-pH conditions. This may be expected, as organisms living under low-pH conditions have to up-regulate their internal pH to be able to calcify, as demonstrated inM. venosaby Jurikova et al. (2019) and also observed in other calcifiers such as corals (McCulloch et al., 2012; Movilla et al., 2014). This would require a higher en- ergy cost and a larger respiration/storage surface would sat- isfy this requirement.
In addition to the thickness of the primary layer and the density of the endopunctae, the size changes in the individual fibres within the fibrous secondary layer may also contribute to the variability in organic components. Most of the recent rhynchonelliformean brachiopods, andM. venosain particu- lar, possess a shell mainly made of a fibrous secondary layer (Williams, 1997; Parkinson et al., 2005; Williams and Cu- sack, 2007). Each fibre of this layer is secreted by the man- tle and it is ensheathed by an organic membrane (e.g. Jope, 1965; Williams, 1968; MacKinnon, 1974; Williams and Cu- sack, 2007; Cusack et al., 2008; Casella et al., 2018). Thus, with a decrease in size but within the same shell volume the surface area increases and with it the number of organic com- ponents. Recently, the relationship between the size of fibres and shell organic components was discussed in detail (Gar- belli, 2017; Garbelli et al., 2017; Ye et al., 2018a). The main conclusion is that the smaller the calcite fibres, the higher the organic component in the shell (cf. Fig. 11). Thus, smaller fibres and a greater endopunctae density may lead to higher organic content per shell volume (Fig. 11).
4.2 Low pH and brachiopod microstructure
Several studies tried to understand how marine carbonate- shelled animals respond to ocean acidification, such as bra- chiopods (McClintock et al., 2009; Cross et al., 2015, 2016, 2018; Jurikova et al., 2019), bivalves (e.g. Berge et al., 2006;
McClintock et al., 2009; Beniash et al., 2010; Parker et al., 2010; Melzner et al., 2011; Talmage and Gobler, 2011; Ama- ral et al., 2012; Hiebenthal et al., 2013; Coleman et al., 2014;
Gobler et al., 2014; Milano et al., 2016), cold-water scler- actinian corals (e.g. Form and Riebesell, 2011; McCulloch et al., 2012; Jantzen et al., 2013b; Büscher et al., 2017) and sea urchins (Suckling et al., 2015) (Table S1). The results of these studies show that, in general, seawater acidification reduces the growth rate of marine calcifiers (Michaelidis et al., 2005; Shirayama and Thornton, 2005; Berge et al., 2006;
Bibby et al., 2007; Beniash et al., 2010; Nienhuis et al., 2010;
Figure 11.Relationship between the microstructure and the organic components of calcified shells of brachiopods. Position informa- tion: see Figs. 6 and 7; dv: dorsal valve; vv: ventral valve; CM:
central middle part; AM: anterior middle part.
Thomsen and Melzner, 2010; Fernández-Reiriz et al., 2011;
Melzner et al., 2011; Mingliang et al., 2011; Parker et al., 2011, 2012; Talmage and Gobler, 2011; Liu and He, 2012;
Navarro et al., 2013; Milano et al., 2016).
For brachiopods, in the Liothyrella uva (Antarctic) and Calloria inconspicua(New Zealand), no ocean acidification effects on shell growth were detected by Cross et al. (2015, 2016, 2018), although the shells of the former species may rapidly dissolve in acidified waters (McClintock et al., 2009).
However, C. inconspicua from the same locality in New Zealand (Paterson Inlet, Stewart Island) laid down a denser shell over the last 120 years, with nearby environmental con- ditions increasing by 0.6◦C from 1953 to 2016 and slightly increasing by 35.7 µatm inpCO2from 1998 to 2016 (Cross et al., 2018). These changes are in line with global trends of ocean pH and temperature since the industrial revolu- tion (Caldeira and Wickett, 2005; Orr et al., 2005; IPCC, 2013). The present experiment showed that growth of spec- imens was not affected by the low-pH conditions; instead, their growth was similar to that of specimens cultured under control conditions (no. 9006,∼0.9 cm in the ventral valve,
∼0.8 cm in the dorsal valve; no. 8005,∼0.5 cm in the ven- tral valve,∼0.4 cm in the dorsal valve). Based on the von Bertalanffy growth function, Baumgarten et al. (2014) calcu-
Figure 12. Projection of shell length of ventral valves on the von Bertalanffy growth function (grey line) Lt=71.53 (1− e−0.336(t−t0)), source from Baumgarten et al. (2014); Lb: shell length at the beginning of culturing;Lm: measured shell growth at the end of culturing; Le: expected shell growth.
lated an expected growth increment and rate, and we com- pared those parameters with the measured ones under con- trol and low-pH conditions. The results in Fig. 12 demon- strate that the measured individual growth rates are within the range of the ones of naturally growing individuals.
A limiting factor is the small database, but in general, the present observations agree with studies that show no or little impact of acidification on the growth rates of marine calci- fiers (cf. Marchant et al., 2010; Thomsen et al., 2010; Range et al., 2011, 2012; Talmage and Gobler, 2011; Dickinson et al., 2012; Fernández-Reiriz et al., 2012; Liu and He, 2012;
Hiebenthal et al., 2013; Cross et al., 2015, 2016, 2018), or even an increase in respiration, shell growth or metabolic rates after having experienced low-pH conditions (Wood et al., 2008; Cummings et al., 2011; Parker et al., 2012). We note however that a combined effect of multiple stressors, such as low pH, lower dissolved oxygen and higher temper- ature or scarce food availability is more complex and poten- tially detrimental. For instance, Steckbauer et al. (2015) re- ported that hypoxia and increasedpCO2could significantly reduce the respiration rate of some marine invertebrates (An- thozoa, Gastropoda, Echinoidea and Crustacea). On the other hand, the highest growth rate in the bivalveMacoma balth- ica (Limecola balthica(Linnaeus, 1758)) was observed in seawater with low O2 and high pH (Jansson et al., 2015).
Gobler et al. (2014) reported that juveniles of the bivalves Argopecten irradians(Lamarck, 1819) andMercenaria mer- cenaria(Linnaeus, 1758) were not affected by hypoxia or
acidification being applied individually, but the growth rate decreased when juveniles were exposed to both conditions simultaneously.
To explore the effects of acidification on brachiopod biomineralization, the microstructures of the specimens cul- tured for 214 days (no. 43, pH=7.66±0.04; and no. 63, pH=7.44±0.08) and the other population cultured for 335 days (no. 8005, pH=8.0 to 8.15±0.05; and no. 9006, pH=7.6 to 7.35±0.05) were investigated in detail. No con- clusive consideration can be carried out on the specimens cultured for 214 days (no. 43 and no. 63), but in the other cul- turing experiments conducted for 335 days, the microstruc- ture produced by the specimen cultured under low-pH con- ditions was different from that produced under control con- ditions: (1) the thickness of the primary layer increased with culturing (Fig. S1a–d); (2) the density and size of the endop- unctae were higher (Fig. 1e–h); and (3) the fibres of the sec- ondary layer were smaller. The punctal pattern detected here is different from that observed by Cross et al. (2018), who recorded no change in the punctal density of the ventral valve ofC. inconspicuaon specimens from the last 120 years. Also different is the trend in size of the endopunctae, which mea- sured in the dorsal valve by Cross et al. (2018) seems to de- crease. However, the slight environmental changes in the nat- ural environment (references in Cross et al., 2018) are very different from those of our culturing experiments. Further- more, the size of the endopunctae was measured from the dorsal valve only by Cross et al. (2018), whereas the increase in size we report was observed only from the ventral valve of M. venosa. A potential factor controlling this could be the du- ration of culturing under low-pH conditions. We note, how- ever, that during the second phase of this acidification exper- iment (pH=7.35), the seawater was strongly undersaturated with respect to calcite (cal=0.6), suggesting that the ob- served structural changes could also be linked to the satura- tion state. Conversely, the duration of low-pH conditions as a controlling factor is also in line with the few data available in the literature on microstructural changes during acidification.
Milano et al. (2016) reported no significant difference in the prismatic microstructure of the cockle Cerastoderma edule when cultured under low-pH conditions for about 2 months, except for dissolution of ontogenetically younger parts of the shell. Similarly, a study by Stemmer et al. (2013) on the clam Arctica islandicarevealed that there was no effect on the shape and size of the crystals in the homogeneous mi- crostructure after 3 months of culturing at low pH (Table S1).
However, the experiments conducted by Fitzer et al. (2014a, b) for 6 months on the blue mussel Mytilus edulis showed that the animals exposed to low pH and highpCO2tend to produce less organized, disorientated calcite crystals and an unordered layer structure.
Thus, in bivalves, and similar to our observations, the du- ration of culturing may be crucial in recording significant ef- fects. The present results lend support to the microstructure variation observed in brachiopods during the end-Permian
extinction event and concomitant ocean acidification (Gar- belli et al., 2017). During this event, both Strophomenata and Rhynchonellata produced more organic-rich shells to cope with the long-term and protracted seawater acidification ef- fects (Garbelli et al., 2017).
4.3 Stable isotope variation under low-pH conditions Brachiopod shells are commonly used as archives for deep- time paleoenvironmental reconstructions as they potentially record the original geochemical composition of the seawa- ter they lived in (Grossman et al., 1993; Banner and Kauf- man, 1994; Mii and Grossman, 1994; Mii et al., 2001;
Brand et al., 2003, 2011, 2016; Jurikova et al., 2019). Sev- eral studies suggest that carbon and oxygen isotope com- positions of the secondary layer of brachiopod shells, espe- cially slow-growing species – and particularly the innermost shell parts – tend to be close to equilibrium with the am- bient seawater temperature (e.g. Popp et al., 1986; Carpen- ter and Lohmann, 1995; Parkinson et al., 2005; Brand et al., 2013, 2015, 2016; Takayanagi et al., 2013; Yamamoto et al., 2013). Recently, Bajnai et al. (2018) documented that bra- chiopods do not incorporate oxygen isotopes in thermody- namic equilibrium with ambient seawater, and appear to be subjected to taxon-specific growth-rate-induced kinetic ef- fects. The documented isotopic offset appears to be relatively constant throughout the range of brachiopod shell production from cold to warm environments. Thus, the brachiopod oxy- gen isotope composition, when corrected for the seawater-
18O contribution, records ambient water temperatures close to those observed for their ambient environment (Brand et al., 2013). Overall, theδ18O values of brachiopods remain a mainstay and robust proxies of paleoenvironmental tempera- ture conditions.
In general, the measured δ13C (between −8.05 ‰ and +0.45 ‰) andδ18O (between−3.04 ‰ and+0.21 ‰) val- ues of the secondary layer produced during growth in the natural environment (Fig. 10) are similar to previous results from the shells ofM. venosa(Penman et al., 2013; Ullmann et al., 2017; Romanin et al., 2018). Furthermore, the present results show that there are no significant differences inδ13C andδ18O values between the dorsal and ventral valves (p- values inδ13C andδ18O of no. 8005 are 0.437 and 0.491, respectively, andp-values inδ13C andδ18O of no. 9006 are 0.862 and 0.910, respectively), which is in agreement with previous findings (e.g. Parkinson et al., 2005; Brand et al., 2015; Romanin et al., 2018).
In the naturally grown shellbefore-culturing, theδ13C and δ18O values are relatively stable along the ontogenetic direc- tion (Table S2), except for the depleted values at approxi- mately mid-shell length in both no. 8005 and no. 9006. In particular, in no. 9006, in this part of the shell values drop to about−6 ‰ for δ13C and−2 ‰ forδ18O values (Fig. 10).
Since the samples were taken from the mid-shell layer and not from the shell interior, we can exclude the isotope nega-
tive shift being produced by shell material added during the during-culturing shell thickening. While this drop may be an artefact of both sampling and analytical uncertainties, a possibility also exists that it could be linked to shell repair processes. Brachiopods are well known to show a remark- able shell repair ability (Cross et al. 2015, 2016), and thus it cannot be ruled out that this shell part, although originally formed early in life under natural conditions, also contains a contribution from material precipitated in the culture sea- water later in life, in particular under low-pH conditions.
Also, negative isotope excursions of a similar magnitude were recorded inM. venosaspecimens from the South Amer- ica shelf by Ullmann et al. (2017) and Romanin et al. (2018).
Ullmann et al. (2017) implied that these variable δ13C and δ18O values indicate isotope disequilibrium with ambient waters in Terebratellids. In contrast, Romanin et al. (2018), who also analysed specimens collected from Comau Fjord, attributed the negative isotope excursion to environmental perturbations, in particular, to changes in seawater productiv- ity and temperature, and/or to anthropogenic activities. Neg- ative shifts in both δ13C andδ18O values during ontogeny have also been observed in the brachiopodTerebratella dor- sata, which co-occurs with M. venosaand which has been explained by the effect of resorption in corresponding mus- cle scar areas (Carpenter and Lohmann, 1995). Here, we fol- low the interpretation of Romanin et al. (2018) to explain the mid-shell excursion observed in our specimens.
The most prominent change inδ13C values was observed in the secondary layer producedduring-culturingunder low- pH conditions (δ13C VPDB:∼ −25 ‰), reflecting the com- position of theδ13CDIC(δ13C VPDB: −24 ‰ for the low- pH/high-pCO2 conditions). The δ13C values were signifi- cantly depleted by more than 20 ‰ in the specimens cul- tured under low-pH/high-pCO2conditions (pH 7.60 and pH 7.35; no. 9004, no. 9005 and no. 9006) (Fig. 10, Appendix A, Table S2), whereas the depletion was lower and only a few per mil (about 0.9 ‰–1.2 ‰) in the control specimens (pH 8.00 and 8.15; no. 8004 and no. 8005). This demonstrates that theδ13C values ofM. venosato a large extent reflect the composition of the CO2source and thus present a valuable geochemical archive. Similar observations have also been re- ported for other calcifiers cultured under controlled experi- mental settings with pH mediated by CO2-bubbling. For a comparison, Hahn et al. (2014) reported a decreasing trend of about 10 ‰ in δ13C values in the blue mussel Mytilus edulis when exposed to seawater conditions of pH 8.03 (pCO2612 µatm) and pH 7.21 (pCO24237 µatm). In corals, a species-specific δ13C response to high-pCO2 conditions was reported by Krief et al. (2010) of more negative 2.3 ‰ and 1.5 ‰δ13C values inPoritessp. after 14 months of cul- turing under low-pH conditions (pH 7.49,pCO21908 µatm and 7.19 pCO2, 3976 µatm), whereas no significant differ- ence was found in other coral species, such as Stylophora pistillata(Esper, 1797).
In our culturing experiments, oxygen isotope composi- tions of the shells record only a minor depletion during- culturing under different pH conditions (δ18O (VPDB):
−6.4 ‰ to−7.9 ‰/(VSMOW):∼ +23.6 ‰ to+24.3 ‰) in comparison to the values observed in the shell parts grown under natural conditions, following the changes inδ18OH2O. The fractionation of carbon and oxygen isotopes be- tween phases – brachiopod calcite and culture seawa- ter – is defined as 113Ccal-DIC or 118Ocal-sw=1000× lnαcal-DIC/sw, whereαcal-DIC/sw=[13C/12C]cal/[13C/12C]DIC or [18O/16O]cal/[18O/16O]sw, respectively. The calculated values based on our culture measurements are presented in Table 11.
For carbon isotopes, we observe variable113Ccal-DICbe- tween the different specimens and culturing treatments, and it is inconclusive whether this is linked to culturing con- ditions, differences between individuals or an ontogenetic component. It appears that there is about a 2 ‰ difference be- tween the control specimen and samples from the acidifica- tion treatments (pH 7.35), with the last one being, strikingly, closer to the equilibrium with seawater DIC. Possibly, this il- lustrates the variability in kinetic effects (Bajnai et al., 2018), but may also be linked to changes in the sourceδ13CDICin the control treatment. More studies are needed to fully an- swer this question.
Similarly, for oxygen isotopes, we find variable118Ocal-sw with an apparent trend with pH. These values are offset from the equilibrium118Ocal-sw (118Ocal-sw= 32.9 at 10◦C) de- termined by Watkins et al. (2013, 2014). This suggests that M. venosapresent non-equilibrium growth-rate-related iso- tope effects up to about −2.9 ‰, larger than the approx.
−1.5 ‰ previously recorded by Bajnai et al. (2018). Pro- vided that this offset can be constrained, brachiopods con- tinue to present robust archives for palaeo-temperature re- constructions.
In summary, although it appears that variable growth rates present the most prominent confounding parameter compli- cating the interpretation of carbon and oxygen data, provided that we account for them, our results support the notion that brachiopods present robust geochemical archives, even when stressed by ocean acidification.
5 Conclusions
This study combines the analysis of shell microstructures on six specimens consisting of 1932 fibre size measure- ments, 170 primary layer thickness measurements, 256 punc- tal density and diameter measurements and stable isotope geochemistry on five specimens of 79 sample analyses, on brachiopods cultured under low-pH conditions for different time intervals. The results suggest the following conclusions.
In brachiopod specimens cultured for a period of 11 months, the microstructure produced by the specimen cul- tured at low pH (from pH 7.60 to pH 7.35) is different from