www.giga-hamburg.de/workingpapers
___________________________
Securing Household Income among Small-scale Farmers in Kakamega District:
Possibilities and Limitations of Diversification Henriette Dose
N° 41 February 2007
Edited by GIGA German Institute of Global and Area Studies / Leibniz-Institut für Globale und Regionale Studien.
The Working Paper Series serves to disseminate the research results of work in progress prior to publication to encourage the exchange of ideas and academic debate. An objective of the series is to get the findings out quickly, even if the presentations are less than fully polished. Inclusion of a paper in the Working Paper Series does not constitute publication and should not limit publication in any other venue. Copyright remains with the authors.
When Working Papers are eventually accepted by or published in a journal or book, the correct citation reference and, if possible, the corresponding link will then be included in the Working Papers website at:
www.giga-hamburg.de/workingpapers.
GIGA research unit responsible for this issue: Research Programme ‘Transformation in the Process of Globalisation’
Editor of the GIGA Working Paper Series: Bert Hoffmann <hoffmann@giga-hamburg.de>
Copyright for this issue: © Henriette Dose
Editorial assistant and production: Verena Kohler and Vera Rathje
All GIGA Working Papers are available online and free of charge at the website:
www.giga-hamburg.de/workingpapers. Working Papers can also be ordered in print. For production and mailing a cover fee of € 5 is charged. For orders or any requests please contact:
E-mail: workingpapers@giga-hamburg.de Phone: ++49 (0)40 - 428 25 548
GIGA German Institute of Global and Area Studies / Leibniz-Institut für Globale und Regionale Studien Neuer Jungfernstieg 21
20354 Hamburg Germany
E-mail: info@giga-hamburg.de Website: www.giga-hamburg.de
Securing Household Income among Small-scale Farmers in Kakamega District:
Possibilities and Limitations of Diversification
Abstract
In the debate of sustainable rural livelihoods, diversification is seen as a way to secure in- comes and to increase food security. On the basis of a data set on income security, this pa- per analyses to what extent this applies to small-scale farmers in Kakamega District, Kenya. Using the sustainable rural livelihoods approach, this paper draws the conclusion, that (1) diversification in agricultural production is not sufficient for securing rural liveli- hoods in Kakamega District; (2) a sufficient income diversification depends heavily on re- quirements like access to education, infrastructure, as well as investment capital; and (3) small-scale farmers in Kakamega District in most cases lack these requirements, therefore not being able to achieve secure household incomes or increased food security.
Key words: agriculture, income security, small-scale farmers, Kenya, sustainable rural livelihoods (SRL), diversification
Henriette Dose
is research assistant at the Institute of African Studies, University of Leipzig. The research for this paper was carried out as part of the project: ‘BIOTA E14 Sustainable Development, Coping Strategies of Micro and Small Enterprise and Farm Households in Kenya – Kakamega Forest’ under the supervision of Prof. Dr. Robert Kappel, president of GIGA, and funded by the Bundesministerium für Bildung und Forschung (BMBF).
Contact: dose@uni-leipzig.de
Sicherung kleinbäuerlicher Haushaltseinkommen im Distrikt Kakamega: Möglichkei- ten und Grenzen der Diversifizierung
In der Diskussion um nachhaltige ländliche Existenzgrundlagen wird Diversifizierung als ein Weg zur Erreichung von Einkommens- und Nahrungssicherheit angesehen. Auf der Grundlage eines Fragebogens zu Einkommenssicherheit analysiert dieser Beitrag, in wel- chem Umfang dies auf Kleinbauern im Distrikt Kakamega, Kenia zutrifft. Anhand des sustainable rural livelihood approach kommt der Beitrag zu folgenden Ergebnissen: 1) Die Di- versifizierung der landwirtschaftlichen Produktion im Distrikt Kakamega reicht nicht aus, um sichere ländliche Existenzgrundlagen zu erhalten. 2) Erfolgreiche Einkommensdiversi- fizierung hängt sehr stark vom Zugang der Haushalte zu Bildung, Infrastruktur und In- vestitionskapital ab. 3) Kleinbauern im Untersuchungsgebiet stehen diese Grundlagen sehr selten zur Verfügung. Daher sind Einkommenssicherheit und ausreichende Nah- rungssicherheit oft nicht gegeben.
Possibilities and Limitations of Diversification
Henriette Dose
Article Outline
1. Introduction: Improving Livelihoods of the Rural Poor 2. Sustainable Rural Livelihoods as Theoretic Concept
3. Kakamega District: Household Structures and Social Environments 4. Testing the Hypotheses
5. Conclusion: Secure Incomes Yet to Achieve
1. Introduction: Improving Livelihoods of the Rural Poor
The World Development Report 2008 is dedicated to ‘Agriculture for Development’ and states, that more than half of the population in developing countries live in rural areas, where poverty is most extreme.1 On this background, it is highly important to improve the livelihoods of the rural poor. Achieving secure household incomes is generally assumed to be a fundamental step out of poverty and food insecurity. With a poverty rate of 52% and the majority of its inhabitants being employed within the agricultural sector, the situation in Kakamega District, Kenya, reflects the importance to improve the living conditions for the rural poor. High population density and extreme demographic pressure further aggravate the problem because agricultural extension in the district is nearly impossible. It therefore seems necessary to look for ways other than agricultural extension to improve the liveli- hoods of small-scale farmers in Kakamega District.
1 See World Bank (forthc.).
For analysing the situation in this district, this paper follows the approach on sustainable ru- ral livelihoods (SRL), which has been invented in the late 1990s by the DFID in Great Britain.
This approach lays an emphasis on livelihood diversification, which is understood to mini- mize the vulnerability of small-scale farmers’ households against risks and shocks. Thus, theoretical findings lead to the assumption, that diversification of income sources and liveli- hoods results in more secure income situations at the household level.2 Two hypotheses un- derlie this paper and will be outlined further in part 2: (1) that all households are, in general, able to diversify their incomes although they need a particular basic capital to do so success- fully; and (2) that investment is not the only basis for successful diversification. Proving them will be done by examining (1) whether diversification in non-farm activities is essential for small-scale farmers in Kakamega District to secure household incomes; (2) whether non- farm diversification is taking place at all; and (3) which preconditions need to be met in or- der to allow diversification in non-farm activities. The latter takes into consideration invest- ments in human capital as well as social networks.
Part 2 gives the theoretical background of the SRL. It points out different assets which are seen to be necessary for sustainable rural livelihoods, and highlightens the relation between diversification and risk minimisation. The data set is analysed in part 3. Examined here are household characteristics, land use and land ownership, the possibilities and limitations of non-farm activities, income and expenditure patterns of the households surveyed, their em- beddedness in social networks as well as the households vulnerability to shocks and risks.
Part 4 discusses whether households in Kakamega District do diversify successful and whether they have secure incomes. It also lines out, whether certain preconditions have to be met for successful diversification. The last part of the paper concludes the findings and gives implications for fostering income security in Kakamega District.
2. Sustainable Rural Livelihoods as Theoretic Concept
In the late 1990s the Department for International Development (DFID), Great Britain, initiated a discussion on sustainable rural livelihoods (SRL) to serve as a basis for poverty reduction and secure livelihoods with a focus on rural areas. This discussion was based on the five capital
2 This paper deals only marginally with agricultural diversification, because most of the households in Kakamega District already do have a highly diversified agriculture. However, due to their small landholdings and their bad financial situation, they cannot increase agricultural outputs further.
approach which takes different kinds of assets3 into account in order to evaluate the actual status of household livelihoods during any analysis.4
When putting the assets in relation to each other, as shown in Carney’s Diamond, the five capital approach serves as a tool for assessing the capital basis of a household (or region). It therefore gains importance through dynamic studies.
The sustainable rural livelhihoods approach focusses on the dynamic analysis of these assets and aims to discover ways to support sustainability. It also includes capabilities and activities of households within the DFID’s working definition:
A livelihood comprises the capabilities, assets (including both material and social res- sources) and activities required for a means of living. A livelihood is sustainable when it can cope with and recover from stresses and shocks, maintain or enhance its capa- bilities and assets, while not undermining the natural resource base. (Chambers/
Conway 1991: 6)
The strength of such a holistic and dynamic approach lies in capturing the complexity of ru- ral life while also taking into consideration the influence of national and international part- ners.5 It therefore takes the political, institutional and historical context as basis for devel- opment. Build on these, there exists an individually particular combination of the before mentioned five assets. These, though, interact with activities the households carry out, lead- ing to individually special outcomes describing the ‘manoeuvering space househods have in making a living’ (Foeken 1997: 119). Meanwhile, assets, activities, and outcomes are influ- enced by a vulnerability context in form of shocks, seasonality, and trends. Thus, in using the SRL, scientists seek for ways to structure these framework conditions in a way that will finally lead to secure and sustainable rural livelihoods. Scoones (1998) and Swift/Hamilton (2001) see workable strategies in agricultural intensivation and extensivation, in livelihood diversification and in migration. Finally, the realisation of strategies leading to poverty re- duction and risk minimalization for single households as well as regions shall take place (Scoones 1998: 10). Points to put this theories into practice are seen in areas like biodiversity, fair trade, land tenure and land rights, cattle breeding and access to water. Key elements to implement the SRL strategy of the DFID therefore lie in promoting decentralisation, diversi- fication, and rural-urban linkages.6
To achieve a secure income, diversification of livelihoods, as well as diversification of in- come sources, is considered most important. Since assets of small-scale farmers such as land,
3 These assets are natural capital, human capital, financial capital, social capital and physical capital.
4 See Carney (1998:6f); Scoones (1998: 7); Johnson (1997:4f).
5 Carney (1998, 1999).
6 See Carney (ed.) 1998.
cattle, and tools are, in itself, considered unproductive7, it is assumed that poor small-scale farmers do profit from diversification into non-farm activities.8 This includes all incomes which are generated independently of the farm as rural wage labour, income from self- employment, pensions and remittances. On the other hand, farm income includes income generated through labour on the farm in terms of output in kind and income from trade with farm products.9 Diversification is widely understood as a form of self-insurance against risks and shocks (see Barrett et al. 2001b; Bryceson 1999; Scoones 1998; Ellis 1998a, 1998b).
While Scoones describes diversification as one possible alternative for risk management, Ellis asks for the preconditions under which households are able to diversify. His conclusion is that every single household should be able to do so, but the results are dependent on their starting position: While poor households diversify for survival, with ‘reasons for diversifica- tion born of desperation’, better off households are able to ‘diversify as a matter of choice and opportunity’10 and therefore accumulate capital. Bryceson, although not fully rejecting Ellis’ thoughts, does not speak of two different approaches to diversification:
Rather than being qualitatively different approaches to risk, they can form a sequential trial-and-error learning curve in which rural farmers are thrown into ‘coping’ in the first year or two of a ‘disaster’, after which they ‘manage the risk’ and in so doing, they eventually ‘adapt’. (Bryceson 1999: 11)
However, studies about East Africa in particular, seem to prove Ellis’ thoughts.11 In these studies, it has been found out that households need to generate a particular income before being able to diversify successfully. Therefore, with increasing income their activities gener- ate a higher revenue from non-farm work, while households having less than this also di- versify, but in activities with low productivity and low incomes. This theorem, due to its graphic expression, is called U-Theorem (see Teklu 1997). Going beyond this theorem shows that households gaining high incomes do not necessarily need to diversify further. Instead, such households often concentrate their activities on one or just a few successful activities (Barrett et al. 2001b).
7 See Bryceson (2004).
8 And therefore also are able to invest into their land, as, e.g., through buying fertilizer or quality seeds. Up to now, in Kakamega, the only method used for maximising agricultural output is through intercropping, which in most cases does not lead to sufficient outputs.
9 See Barrett et al. (2001b); Bryceson (1999); Woldenhanna/ Oskam (2001); and Ellis (1998a, 1998b).
This paper differentiates between farm and non-farm income as before mentioned.
10 Both citations from: Ellis 1998a: 7.
11 See Teklu (1997); Barrett et al. (2001a); Freeman et al. (2004); Lanjouw, P. et al. (2001); Smith et al.
(2001) ; and Block/ Webb (2001).
As a result of the literature review and through the following analysis and discussion, two hypothesises shall be considered:
1) All households are, in general, able to diversify their incomes although they need a par- ticular basic capital (or stable income) to do so successfully, as mentioned by Ellis and the U-Theorem.
2) Investment is not the only basis for successful diversification and income security. Be- sides it, there are the other elements of Carney’s Diamond playing important roles. This paper, therefore, places emphasis on human capital and access to infrastructure as essen- tial for successful rural development.
3. Kakamega District: Household Structures and Social Environments 3.1. Determining the Data Set
Kakamega District, situated in the Western Province (Kenya), employs the majority of its in- habitants within the agricultural sector (GoK 2002), with most of them being small-scale farmers. In fact, 80% of the population live in rural areas, and 62% of all households gener- ate their income from agriculture. At the same time the district suffers from extreme demo- graphic pressure with an annual population growth rate of 2.12%. Therefore, with 76% of the district’s area being under agricultural cultivation and an additional 11% being covered with (gazetted) forest, an extension of cultivated areas seems impossible. This fact, com- bined with the district’s poverty rate of 52%, shows the importance of exploring ways to fa- cilitate secure incomes for households living on small-scale farming.
The findings of this paper are based on a data set collected in March 2005 from five adminis- trative divisions of Kakamega District, namely Shinyalu, Ileho, Ikolomani, Lurambi and Municipality. The first four of the listed divisions have been chosen to enable a follow up to the land use typology pre-test done by the BIOTA E14 group of the University of Bonn, which selected study sites along a land use gradient centering on Kakamega Forest. To im- plement an intermediary as well as to get representative households of an urban category we also included the Municipality division, namely regions surrounding Kakamega town in the survey. The sample size was based on time and resources available for the study.
The data set was collected using probability sampling methods and the study area was de- termined according to the following parameters which specify locations and sub-locations from each of the five administrative divisions: proximity to Kakamega Forest, population density, the rural-urban continuum and the cropping zones of cash crops like tea/coffee and
sugar cane. 15 households were randomly selected from each sub-location, resulting in a sample containing 75 households.
Map 1: Selected divisions and locations in Kakamega District
Note: After printing this map, the locations of the Lurambi Division have been renamed as follows: Shikoti = Butsotso East, Butsotso South = Butsotso Central, Bukura = Butsotso South.
Source: GoK (2002: 5), red outlines by the author.
Although 33.3% of the surveyed households have been classified as ‘urban’, they often de- pend as much on agriculture as the 66.7% regarded as ‘rural’. This stems from the fact that
‘urban’ in this survey represents the distance of the households towards trading centres which is seen as an advantage concerning access to infrastructure and services.
The primary data was collected using a standard questionnaire which assessed aspects of rural livelihoods such as demographic details of a household; details concerning land use, land ownership and acreage, physical quantities of crop outputs as well as household pat- terns concerning their use as food or income source, income and expenditure patterns, own- ership of various assets, responses to shocks, the embeddedness of households in social networks and institutions, future prospects and plans. The aim of the questionnaire was to obtain information about the income of small-scale farmers in the study site, mainly con- cerning the composition of their household incomes and the distribution of their income be- tween farm and non-farm activities. Due to the fact that small-scale farmers tend not to have regular incomes, the questionnaire was designed to assess the different income components.
As such, income from trade or sale of crops was taken into account as well as income from non-farm work; income generated by different household members (including remittances) was added up. All details were used to calculate an estimated annual household income which was compared to a calculated annual household expenditure. However, in doing so, large differences were obtained which are assumed to be the result of varying agricultural prices during the year, unequal seasonal agricultural outputs and differing statements from the interviewees concerning agricultural outputs.
In addition to the primary data, secondary data was used, collected mainly from relevant Government Departments in Nairobi and Kakamega, as well as information from local non- governmental organisations (NGOs). Some of the collected data include details concerning agricultural development, price trends of agricultural inputs and outputs, information about the local business sector and micro credit schemes.
3.2. Household Characteristics
Throughout this paper, a household refers to a group of people, either related or unrelated, who are answerable to one person, often regarded as the household head. Household mem- bers share a dwelling unit or structure and have the same housekeeping arrangements.
Hence a distinction between a family unit and a household has to be made and, as such, family members who are permanently away from the household either through working migration or boarding school are excluded, although they often contribute to the households wellbeing through remittances.12
12 In this study, this is true for 48% of the households.
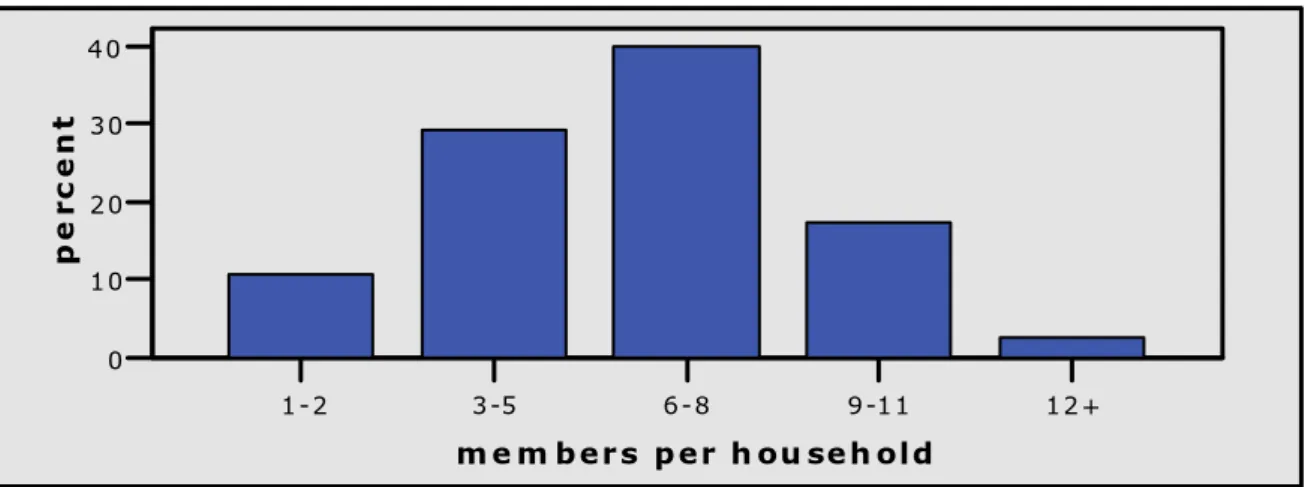
As shown in figure 1, the average household size measured in this survey is 6.28 members.
This differs to the figure stated in the current Kakamega District Development Plan which puts the average at 4.8 members (GoK 2002). However, this divergence could be accounted for by the sample size.
Figure 1: Household size
1-2 3-5 6-8 9-11 12+
m e m b ers p er h ou seh old 0
10 20 30 40
percent
Source: Data set of the household survey, March 2005; own calculations.
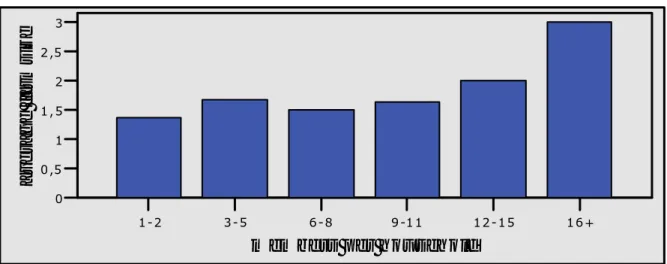
In most households, members tend to be the immediate family and/or close relatives, some- times with up to three generations living together which results in households with a greater than average number of members. In this case, land has often not been divided be- tween grown-up children, thus giving a connection between household size and farm size (figure 2).
However, it has to be mentioned, that, throughout all household size groups, 56% of the sample households have to live from farm sizes smaller than 1 ha.
A survey of income security also requires an analysis of dependencies. According to Kakamega District Development Report 2002-2008, dependents are all people not belonging to the labour force, which accounts for those between the ages of 15 and 64. This leads to a dependency ratio of 64.5/100 concerning the data sample, with 12% of the households hav- ing less than two members in the labour pool. Although this figure is clearly less than for the district as a whole (99/100), it increases if it is taken into account that many young people aged between 15 and 18 go to school and, therefore, do not contribute to the household in- come. Under this consideration, the dependency ratio increases up 94.6:100.
The study also examined the issue of infrastructure as an important aspect for the develop- ing potential. More than 80% of all surveyed households have no access to clean water but must fetch it from rivers or streams. This doubles the district’s average which is 40%. Only 8% of the households have access to electricity which represents the district’s provision. In
2001 only 13 trading centres and five villages were supplied with electricity. Therefore, the most important energy ressources are fuelwood (81.3%) and kerosin (72%). The average dis- tance from the household to the next tarmac road is 5.7 km, or 40 minutes by foot. This is due to the fact that, except for a few main roads, there are hardly any well maintained roads, which also leads to minimal public transport service in remote areas. Health care centres and primary schools seem to be represented quite well in the study area. The median dis- tance to both facilities lies around 1 to 1.5 km.13 However, the district lacks institutions for higher education.
Figure 2: Average farm size in hectar in relation to household size
1-2 3-5 6-8 9-11 12-15 16+
m em be rs p er h ou s eh old
0 0,5 1 1,5 2 2,5 3
average farmsize
Note: Although the data set does not explain the non-linearity of the graph, it can be assumed that there is a connection between household size and the geographical distribution of the households. While the smallest farms can be found close to the forest, it is my impression that greater family sizes can be found there as well.
Source: Data set of the household survey, March 2005; own calculations.
3.3. Land Use and Agricultural Production Land Ownership and Land Use
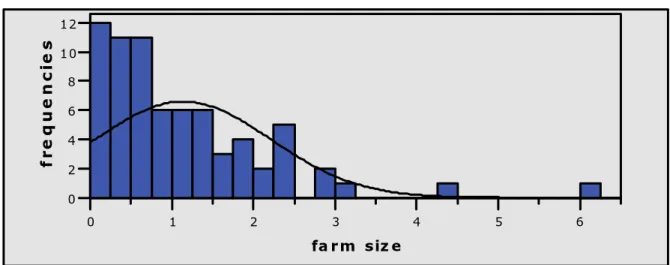
Although the mean farm size measures 1.14 ha and therefore more than the district’s overall average (0.7 ha, GoK 2002), figure 3 clearly indicates that this is due to two farms falling out of the frame. It should be noted that the farm size represents the whole property including land being used as building land, occasional wood plantations, hedges and areas for fruit trees, as well as small parts for pasture. Therefore, the land used for agricultural cultivation, represents on average 0.4 ha.
13 The survey here is not conform with the current District Development Plan (2002) which ascer- tains both being underrepresented. This could be explained first through the sample size, and sec- ond through a possible increase in facilities since 2002.
Figure 3: Farm size in hectar
0 1 2 3 4 5 6
fa rm siz e 0
2 4 6 8 10 12
frequencies
Source: Data set of the household survey, March 2005; own calculations.
Land is owned by individuals (72%) or families (25.3%) and, as the sample indicates, it is not common to rent land or to hold land rights as a community. In more than 80% of the cases men own the title deed, and Mackenzie (1993) illustrated that the land will generally be in- herited by sons. Moreover, Sobania (2003) reports that in Kenya, a title deed often still be- longs to a person who has already divided the land among his (or her) children. This be- comes important with regard to access to credit, for without the land title as security, formal credits are seldom provided, thus complicating diversification in non-farm as well as in farm activities.
Land is mostly used for the production of food such as maize (by 97,3% of the farmers), beans and greens (96% each). Not to mention sweet potatoes (72%), cassava (61.3%), bananas (90.7%) and occasionally ground nuts, irish potatoes, soybeans, arrow roots, tomatoes, and pineapple. The farmers use inter-cropping as a method to maximize and diversify the out- put (see Njeru 1996).
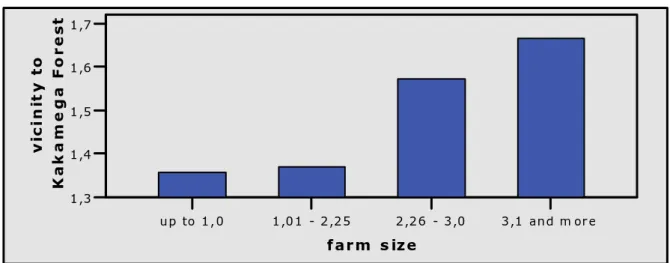
Only slightly more than one third of all surveyed households cultivate cash crops, with nearly all af them being sugar cane farmers (33.3%) as opposed to 6.7% tea farmers. For tea cultivation is possible in areas close to the forest, this focusses the problem of farm sizes compared to the distance of the forest (figure 4).
In these areas, farms are too small to produce cash crops as well as food. However, figure 4 also represents the spreading of poverty: Ikolomani and Shinyalu are the poorest divisions in the whole district (GoK 2002).
Figure 4: Distance to Kakamega Forest (in km) compared to farm size (in hectar)
up to 1,0 1,01 - 2,25 2,26 - 3,0 3,1 and m or e farm s ize
1,3 1,4 1,5 1,6 1,7
vicinity to Kakamega Forest
Source: Data set of the household survey, March 2005; own calculations.
Agricultural Production and Marketing
With plots being slightly smaller than 0.4 ha, it appears difficult for small-scale farmers to produce enough food to achieve food security, let alone a revenue from marketing. Combin- ing the amount of food harvested14 with the monthly expenditure on food shows that the surveyed households can cover only 55% of their food needs through their own production (table 1). This has to be considered given the facts of decreasing agricultural productivity (GoK 2002) and increasing food15 and input prices.
Table 1: Average value of food per month (in Ksh) Staple food
from own production
Staple food bought
Vegetables/greens from own production
Vegetables/greens bought 2,039.18
(55.5%)
1,638.41 (44.5%)
411.53 (57.9%)
299.79 (42.1%) Source: Data set of the household survey, March 2005; own calculations.
Promoting agricultural productivity is the responsibility of the Agricultural Extension Ser- vice.16 However, the marketing of agricultural products (excluding cash crops) does not take place, except that ‘[m]ost rural households will sell what they need [as cash] […] only to buy
14 Valued in Ksh per month (exchange rate at the date of survey: 1 Euro = 98,69 Ksh [Kenya Shil- ling]).
15 Prices for food crops as maize, beans, cabbage, tomatoes, sweet potatoes, and irish potatoes nearly doubled since 2001. This increase cannot be accounted for by inflation, for prices of other products like eggs, meat, groundnuts, and different kinds of seeds or fertilizer have stayed constant.
16 From own experience and conversations with AES members it became clear that their work is be- ing hindered by missing equipment like, e.g. cars or motorbikes to reach small-scale farmers in remote areas.
it back later, indicating their great need for cash’.17 They therefore become trapped in a vi- cious circle, selling food when seasonal prices are low, and having to buy it back later at higher prices to cover their food needs. These seasonal differences can be extreme, as shown in a price list of Shinyalu, 2003: the range of the prices for one unit (90kg bag) of maize or beans, the staple food, was 800 Ksh during the year. For crops that are harvested throughout the year such as bananas, sweet potatoes and greens, there are no such price differences re- ported.18 Bananas (18,4%) and greens (43,9%) belong to the products that are sold most of- ten, although households cannot gain high revenues from such trade with a bundle of greens ranging from 1-5 Ksh and a bunch of bananas from 80-100 Ksh.
Cash crops, on the other hand, do incorporate revenue. Although the interviewed farmers did report that productivity is declining (sugar cane: 50%, tea: 33%), tea farmers earned an average of 144,575 Ksh a year, with a price per kg of 7-8 Ksh. Sugar cane, which can be sold to private owned jaggeries or to sugar companies like Mumias Sugar Company (MSC), earns a slightly lower revenue: with an average harvest of 2 tons and an average price of 1,670 Ksh per ton, the revenue per harvest is 100,200 Ksh. Prices, however, have declined during the last few years with the downward trend likely to continue.19
Compared to crops, cattle does not seem to contribute to the household wellbeing. Although 92% of households own either cattle or poultry, this does not lead to a significant difference in monthly expenditure patterns concerning milk and eggs. As indicated in the literature20, however, it can be assumed that ownership of poultry, but to a larger extend of cattle, is, by the interviewees themselves, seen as a form of insurance against shocks, as well as a long- term capital investment. However, due to their overall bad income situation, the small-scale farmers lack the opportunity to gain a revenue from cattle breeding or from their poultry, which is proofed further by the missing determinants for successful cattle breeding21, namely access to agricultural cooperations as well as the amount of space needed.
3.4. Possibilities and Limitations of Non-farm Activities
Possibilities and Limitations of Non-farm Activities in Kakamega District
The industry of Kakamega District is characterised by its links to the agricultural sector with even the few large companies (Kabras Millers, West Kenya Sugar Company, and Sembi Saw Millers) depending on it. As such, with most of the inhabitants living on agriculture in one
17 Karanja (1996: 134).
18 Divisional Agricultural Office (2004).
19 GOK (2004).
20 See for example Freeman et al. (2001), Imai (2003) for Kenya.
21 See Imai (2003).
way or another, formal employment is rare. The District Office (DO) in 2004 counted only 12 formal industries, with employment possibilities being extended through public services as well as through the government. Therefore, many people, especially the young, make their living through informal jobs in the jua kali sector, such as carpenters, hawkers, in boda boda- transport and welders. The most important occupational status is that of the casual worker.
For the informal employment status, there are no official figures stating the income or em- ployment structure of these enterprises.
The biggest employer is the sugar industry providing, 6,500 direct and 15,000 indirect jobs.
Another 4,500 jobs are available through other manufacturing industries. However, this clearly shows that Kakamega District lacks formal employment possibilities. With more than 6,000 people reporting themselves unemployed or job seeking every year, most of them be- tween the ages of 15 and 25, the official number of unemployed people for 2002 was 10,55922. However, estimates lead to the suggestion, that this figure accounts for only 15% of the un- employed.
Possibilities and Limitations of Non-farm Activities According to This Survey
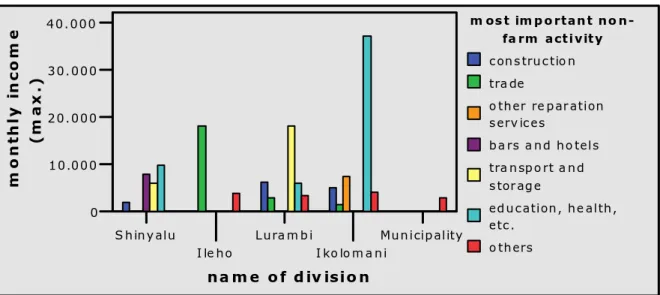
The results of this survey suggest that the poverty of Kakamega District acts as a limitation to diversification. Therefore, each person within a household generates just 16% of the GNP per capita according to the national level. This fact is explained by the high number (80%) of interviewees who depend on agriculture as their main source of income. This is followed by trade (5.35%), construction (4%) and education, health, political/social/religious activities (4%). This pattern has remained fairly constant over the last five years, with only 18.7% of all households reporting changes to it, often due to retirement.
Although generating income is concentrated in agriculture, most households include mem- bers who deal with non-farm activities as described in table 2.
Table 2 clearly shows a concentration in trade, including trade in agricultural products, thus indicating an income possibility for women (see Karanja 1996). As assumed for the whole district, the sample emphasizes employment in health, education, and politi- cal/social/religious activities as another important non-farm activity, which is also responsi- ble for relatively high incomes (see figure 5).
Ileho, Ikolomani, and Shinyalu are the poorest divisions in the district. Besides this, figure 5 also indicates that even the outer circles of the Municipality division, which is reported to be the richest of the whole district, cannot benefit from the profits generated in Kakamega town. The average income of the sample from this division (people living exclusively in the
22 The district’s overall population for the same year has been reported to be 643,457 inhabitants.
poor outer circles) is 5,700 Ksh and shows a significant difference to the average income of the whole sample, 50,476 Ksh. Teamed with the fact that this households hardly ever par- ticipate in income generating (non-farm) activities, it appears that poor households do not have the opportunities to diversify their income sources for securing household incomes (see Ellis 1998, Swift/Hamilton 2001).
Table 2: Forms of diversification: non-farm activities done by the households
Activity First activity
(percent)
Second activity (percent)
Third activity (percent)
Manufacturing 6.7 - -
Construction 5.3 2.7 -
Trade 14.7 4.0 -
Sale, maintenance, and repair of mechanical
and electrical devices 1.3 1.3 -
Other repair services 4.0 - -
Hotels, bars, restaurants 2.7 - -
Transport and storage 5.3 - -
Communication, finance, real estate, law, etc. 1.3 - -
Defence and related services 2.7 - -
Education, health, political/social/religious
activities 9.3 - 1.3
Casual labour 6.7 - -
Painting services 2.7 - -
Remittances 9.3 - -
No answer given 28.0 92.0 98.7
Total 100.0 100.0 100.0
Source: Data set of the household survey, March 2005; own calculations.
Figure 5: Maximum income from the most important non-farm activity per division
S hiny alu
I le ho
Lura m b i
I ko lo m a ni
Municip ality
n a m e o f d iv isio n 0
10.000 20.000 30.000 40.000
monthly income (max.)
m os t im p o rtan t n o n - fa rm acti vity c ons truc tio n tra de
o ther re p ar ation s erv ic es
b a rs a nd ho tels tra nsp o rt a nd s tor ag e
ed uc ation, he alth, etc .
o thers
Source: Data set of the household survey, March 2005; own calculations.
The high significance of agriculture is also reflected in the relative decrease of non-farm in- come which goes hand in hand with an increase in subsistence farming. More than 40% of all households stated that the importance of a non-farm income for their houshold has de- creased in the last five years, while more than 25% reported having no non-farm income.
However, nearly 95% of the households would like to have more non-farm activities. This difference is reported as being due to financial constraints (80%) and lack of knowlegde (6.7%), e.g. concerning credits mostly.
3.5. Income and Expenditure Patterns
Although agriculture is the most important activity in the surveyed area, the cultivation of food is not a sufficient income source. As such, 72% of all households have broadened their activities. In this sense, households can be grouped into three categories: (1) small-scale farmers with cash crops (mostly sugar cane), (2) small-scale farmers without cash crops, (3) small-scale farmers with non-farm income, e.g remittances, wages or income from self em- ployment. Altogether, the average household income23 is 50,458 Ksh. The highest incomes are generated through the cultivation and marketing of cash crops and while the average in this group lies annually at 75,755 Ksh, the maximum income is 287,310 Ksh. For the second group, who rely only on the cultivation of food, the average income is 200 Ksh. However, there are only a few households belonging to this category. Most households carry out di- versified activities, therefore belonging to the third group. The average income here is 66,112 Ksh and the highest income of 448,000 Ksh noted in this survey belongs to this group. This summary clearly indicates that diversification in the cultivation of cash crops, as well as in non-farm activities, helps households to generate financial incomes.
The fact that even subsistence farmers need cash is demonstrated by Bryceson who, on the one hand, speaks of ‘[…] the relatively high costs of purchased food, drastic cutbacks in government social service provisioning and the declining value of ex-migrant workers’ pen- sions […]’ and on the other hand, mentions ‘[…] costs, depending on local circumstances, included: equipment associated with more capital-intensive farming, community-centred gift-giving, and food purchases’. Such expenditures can also be found in the surveyed area.
Households must spend an average of 2,871 Ksh per month on (staple) food like maize (flour), beans, vegetables, bread, meat, eggs, milk, sugar and fruits. Furthermore, there are
23 Financial income has been calculated and summarised to annually incomes from following details:
wage, revenue from self-employment, revenue from trade with agricultural products and remit- tances. For answers given have often not been sufficiently detailed and prices for agricultural products do not stay constant during the year, the ascertained numbers are estimates. For 34.7% of the households no financial income could be determined, although this does not exclude the fact that they have financial incomes.
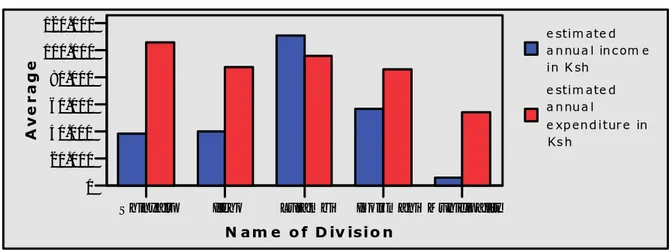
additional costs for the purchase of kerosine, fuel wood and charcoal as well as commodities such as soap or washing liquid. These account for an additional 1,000 Ksh per month. Be- sides these regular costs there are occasional costs such as medicine and health care fees, en- rollment fees (for secondary school onwards), transport, clothing (including school uni- forms), communication technology and, finally, market taxes when selling farm products on local markets. This expenditure amounts to an annual average of 85,927 Ksh and exceeds the average income by far (figure 6).
Figure 6: Estimated annual income and expenditure per division in comparison
S hinyalu Ileho Luram bi Ik olom ani Municipality N am e o f D iv isio n
0 20.000 40.000 60.000 80.000 100.000 120.000
Average
e stim ate d a nnua l inc om e in K sh
e stim ate d a nnua l
e xp end itur e in Ks h
Source: Data set of the household survey, March 2005; own calculations.
This is primarily due to difficulties in obtaining information about the income of small-scale farmers. For instance, it should be noted that farm products are often sold in small quantities (piece meal). As a result, to obtain financial information we relied on the memories of the farmers in question with regard to quantities and prices. Secondly, many farmers seem to underestimate occasional non-farm activities such as (seasonal) casual or wage labour, there- fore having ‘hidden’ income sources.24 Only in connection with income from sugar cane, as in Lurambi, do expenditures not outrange the incomes. With this in mind, the discrepancies between expenditures and incomes must be taken into consideration.
3.6. Social Networks and Institutions
Belonging to a social network or being a member of a social institution gives security and support in everyday life as well as in times of crisis. Of the households questioned, over 60%
confirmed that they hold a membership to a self-help group, with women groups and
24 Such difficulties often occur in household surveys and repeated themselves in the household sur- vey following this pre-test. Again, the data set showed a discrepancy in incomes and expenditures, but, due to the larger number of interviewees, the gap is not as big as in this data set.
church groups being the most attractive (each 20%). There they seek mutual help (30.7%) and social support (13.3%). A few households decided against membership to such a group, but, more often than not, they told us that this kind of social support does not exist near their home (12%). Those who decided against joining stated reasons such as bad experiences (8%) and no interest (6.7%). Compared to self-help groups, agricultural or business associa- tions play an unimportant role. Only 26.7% of the farmers belong to any form of agricultural cooperative or association, mostly as outgrowers of sugar companies.
Social institutions and self-help groups also function as credit groups. For instance, the Sav- ings and Credit Cooperative (SACCO) was named by 12% of the households. However, more attractive and accessible are Rotating Savings and Credit Associations (ROSCA), which can have either a formal or an informal character. Most often in the study area this is a form of women’s group called merry-go-round, which not only functions as a credit group, but also as a social institution. Altogether, with only 20% of the households being members of credit groups, the area seems to lack access to such groups. This was reported by 40% of the households, and 16% giving bad experience as reason for not being a member.
Therefore, nearly 50% stated that they do not know anyone to ask for cash in times of need, while communal groups account for the most frequented source (12%).
3.7. Responses to Shocks
To maintain successful risk management, a secure income is seen as a precondition. This survey therefore asked for shocks experienced in the last five years and the implications of these shocks on the household as well as coping strategies. Shocks have been defined as se- rious illness of one month or longer (experienced by 32%), separation (experienced by 1.3%), unemployment (experienced by 5.3%), loss of productive capital (experienced by 12%), death of household members (experienced by 12%), and theft (experienced by 1.3%). Inter- estingly, problems concerning agriculture like crop or animal diseases or weather distur- bances were not mentioned. With 64% of households being affected by these shocks, illness, death and loss of productive assets account for the most common reasons. However, Ma- laria is not included in the numbers given, for it is not covered in the given definition of se- rious illness. Still, being the dominant illness in the region, it regularly leads to loss of work- ing hours throughout the year, and therefore to loss in needed agricultural output, if agricul- tural production is hindered by illness throughout the year.
Death mostly seems to occur in children, therefore not only confirming the district’s statistic which dates child mortality at 62.5/1000, but also indicating a connection between child mor- tality and poverty/undernutrition as well as a lack of medical care. This survey comes to the
conclusion that most households lacking a regular income do not have the capital to spend a given amount on medicines or health care.
Trauma, loss of agricultural products and hunger are the results of these shocks most often named. This is often due to missing the right time to sow through loss of working hours.
Coping strategies include selling food as well as cattle to get cash for medical care or funer- als. In more than half of all cases, the affected households had to cope alone with the situa- tion. When there was help available, this was generally given by relatives.
Since all recorded shocks lead to a higher need for cash, it seems clear that securing a house- hold income is important for attaining risk management.
4. Testing the Hypotheses
4.1. Diversification and Income Security in Kakamega District
In relation to my first hypothesis, I found out that 72% of all households participating in this survey diversify their activities into the non-farm sector. This figure does not, however, ex- plain whether this diversification is successful. It is therefore unclear whether these house- holds secure their incomes by accumulating capital or whether these households are in need of as many income sources as possible just to survive.
Types of Diversification
The questioned households can be grouped into eight categories according to their diversifi- cation level, as shown in table 3, with the cultivation of food being the common feature. The ownership of cattle has been left out due to my definition of diversification.
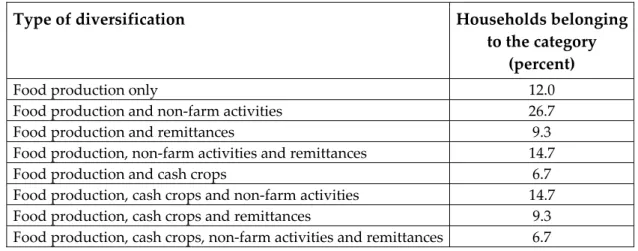
Table 3: Types of diversification
Type of diversification Households belonging
to the category (percent)
Food production only 12.0
Food production and non-farm activities 26.7
Food production and remittances 9.3
Food production, non-farm activities and remittances 14.7
Food production and cash crops 6.7
Food production, cash crops and non-farm activities 14.7 Food production, cash crops and remittances 9.3 Food production, cash crops, non-farm activities and remittances 6.7 Source: Data set of the household survey, March 2005; own calculations.
The largest share of households (26.7%) can be found in agricultural food production com- bined with non-farm activities, followed by households who further diversify in either culti- vating cash crops (14.7%) or getting remittances (14.7%). Remittances play a particularly im- portant role in this survey and although Mathse/Young (2004) found out that obtaining re- mittances leads to a decrease in the interest of a household to diversify its income sources, this is not true for the households questioned. Food production aside, only 9.3% of house- holds are relying on remittances alone. This is even more significant when compared to the number of households not diversifying at all (12%).
Upon considering only households who diversify in non-farm activities, it is clear that the cultivation of cash crops somehow reduces the investment in non-farm activities. Therefore, the basis of different activities in the non-farm sector is wider when no cash crops are culti- vated. However, the spreading of activities does not represent the success of securing the generated incomes.
Successful Diversification and Income Security between Theory and Reality
A stable income throughout the year is not guaranteed for the agricultural sector. This is due especially to varying prices according to harvesting times. Describing this phenomenon, Ellis uses the term ‘seasonality’ and broadens the term, not only covering agriculture, but also non-farm activities which are highly related to agriculture such as trade with farm in- puts and outputs as well as repair of agricultural devices. He therefore defines seasonality as follows:
In economic terms, seasonality means that returns to labour in both on-farm activities and off-farm labour markets vary during the year, causing seasonal changes in occu- pation as labour time is switched from lower to higher return activities. (Ellis 1998a:
11)
Thus, all forms of income generation which are independent of such seasonal variations in income and, as a result, smooth the cash flow during the year, are regarded as probably se- cure. Seasonality, therefore, is used as an indicator to define income security.25 This is also proved by Iliya/Swindel (1997) who have, in their article about Nigeria, found out that poor households tend to drift towards non-farm activities which are either seasonally offered or casual labour. Marenya et al (2003), on the other hand, showed in their study of Western
25 Other possible indicators should be coming from national laws (e.g. concerning protection against dismission), from the moral of payment for received services, etc. For in this survey there is a focus on agriculture, I take seasonality as an indicator, but will further consider the amount of income as well as its regularity towards the future.
Kenya that working in education and public services are the most promising jobs. However, they also found out that in these sectors many jobs get cancelled, which leads to the opinion that the better educated leave the region and migrate due to bad working conditions.
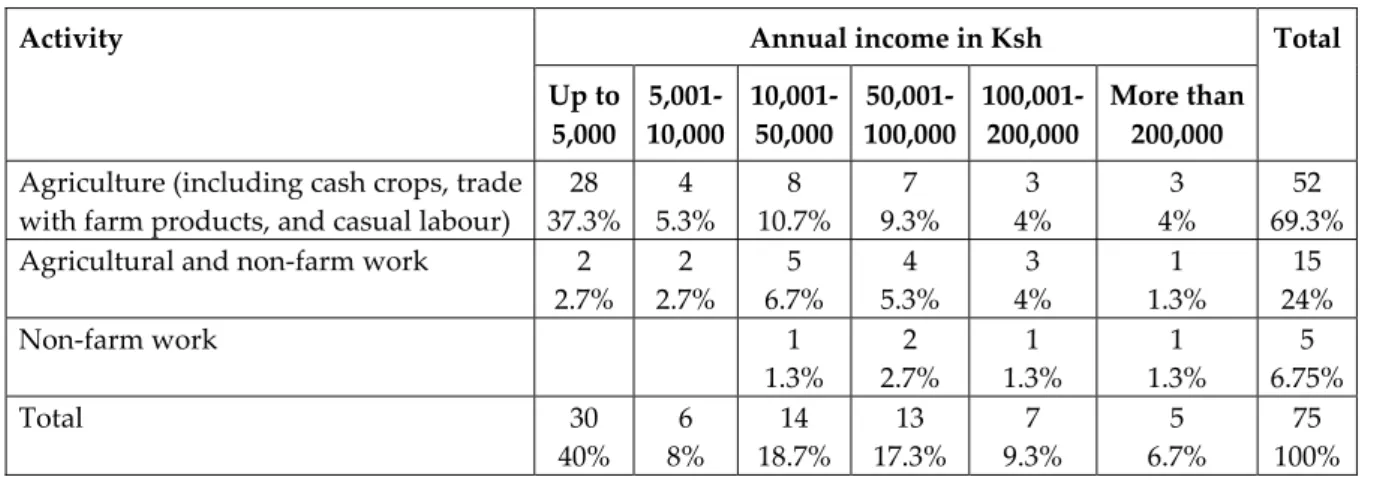
Table 4 illustrates that 69.3% of all households belong to Ellis’ category of insecure incomes, for these vary seasonally. It is also clear from this table that incomes within this group are low, with nearly 50% having incomes under 10,000 Ksh per year. Exceptionally high in- comes are generated through the cultivation of cash crops, particularly sugar cane. Having said this, income from sugar cane production also varies between seasons since it is har- vested every 1½ to 2 years and jaggeries, as well as the sugar companies, pay only after the cane is delivered.
Table 4: Annual household income referring to three types of household activity Annual income in Ksh
Activity
Up to 5,000
5,001- 10,000
10,001- 50,000
50,001- 100,000
100,001- 200,000
More than 200,000
Total
Agriculture (including cash crops, trade with farm products, and casual labour)
28 37.3%
4 5.3%
8 10.7%
7 9.3%
3 4%
3 4%
52 69.3%
Agricultural and non-farm work 2 2.7%
2 2.7%
5 6.7%
4 5.3%
3 4%
1 1.3%
15 24%
Non-farm work 1
1.3%
2 2.7%
1 1.3%
1 1.3%
5 6.75%
Total 30
40%
6 8%
14 18.7%
13 17.3%
7 9.3%
5 6.7%
75 100%
Source: Data set of the household survey, March 2005; own calculations.
This survey shows that trade revolves mainly around agricultural products such as the sale of agricultural products at local weekly open-air markets. It therefore belongs to the cate- gory of insecure activites, which also contains casual labour which is either processed in the agricultural sector or whenever the farmers have working time to spare, in other words not working on their own land.
This paper therefore accords with Ellis (1998a), but also with Barrett et al. (2001b) and Block/Webb (2001), saying, that not until households combine farm with non-farm activities the first step to reaching a secure income is done. This is true for 26.7% of the households, but has to be moderated further: Non-farm activities do not appear to automatically lead to long-term and secure employment. On the contrary, 18.7% of all households questioned mentioned that their most important activity has changed during the last five years.
Amongst them, around 1/3 belongs to the category combining farm with non-farm activities, therefore, theoretically at least, generating secure incomes. However, this is questionable when considered against the facts of reliability and regularity concerning the future.
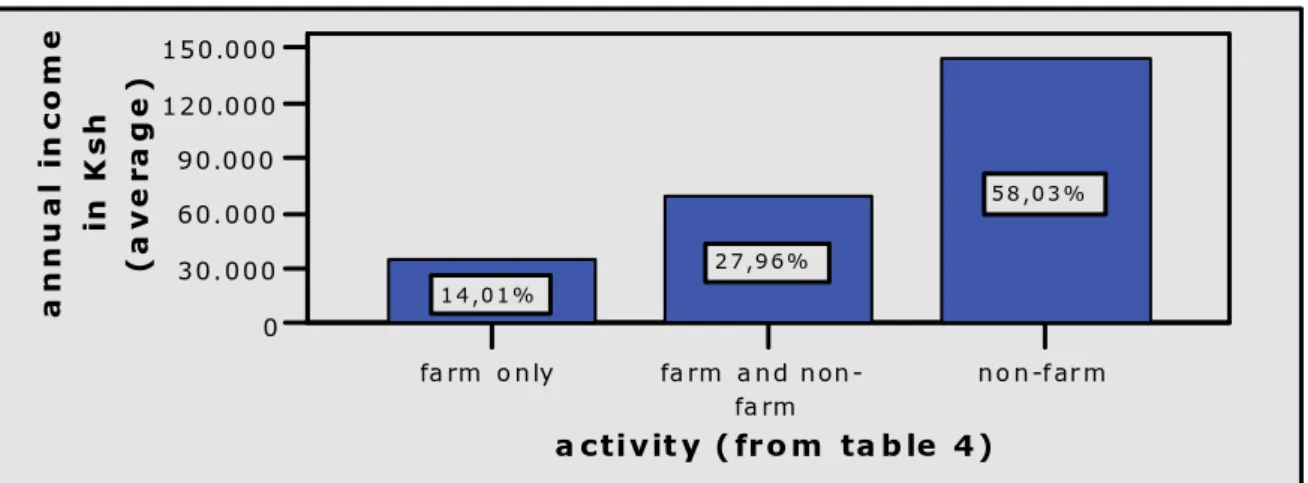
This is again shown in figure 7, which displays the average annual income according to the three income categories and the share of these household groups in the total income of the sample.
Figure 7: Activity to annual income
fa rm o nly fa rm a nd non- fa rm
no n-far m
a ctivit y ( fro m ta b le 4 ) 0
30.000 60.000 90.000 120.000 150.000
annual income in Ksh (average)
1 4 ,0 1 %
2 7 ,9 6 %
5 8 ,0 3 %
Source: Data set of the household survey, March 2005; own calculations.
Returning to my first hypothesis, it can be stated from the facts shown here that most house- holds are living below the poverty line of one dollar per person per day. With an average household size of 6.28 persons, the critical household income in question is slightly more than 170,000 Ksh. Compared with table 4, this income is reached or exceeded by roughly 10% of all households, with again 2% of these having incomes defined as insecure due to seasonality. Therefore, only 8% of all households in this survey have the possibility to diver- sify for accumulation, while 92% of the households can only diversify for survival.
The U-Theorem states that poor households do diversify their livelihoods, but are not able to do so successfully. They need a certain income to diversify broader and to achieve secure livelihoods and secure incomes. The households in this survey do appear to conform to the U-theorem. If households with high enough incomes on the other side diversify lesser, can- not be proved with the data sample used.
4.2. Preconditions to Diversification: Searching for the SRL’s Most Important Assets
The theoretical thoughts of the SRL, the assets of the five capital approach, play an impor- tant role in securing rural livelihoods. I therefore founded my second hypothesis on these assets, stating, that they are equally important for successful diversification. My focus, there- fore, is on human capital, social capital, infrastructure (belonging to physical capital) and partly on financial capital, neglecting natural capital.
Human Capital
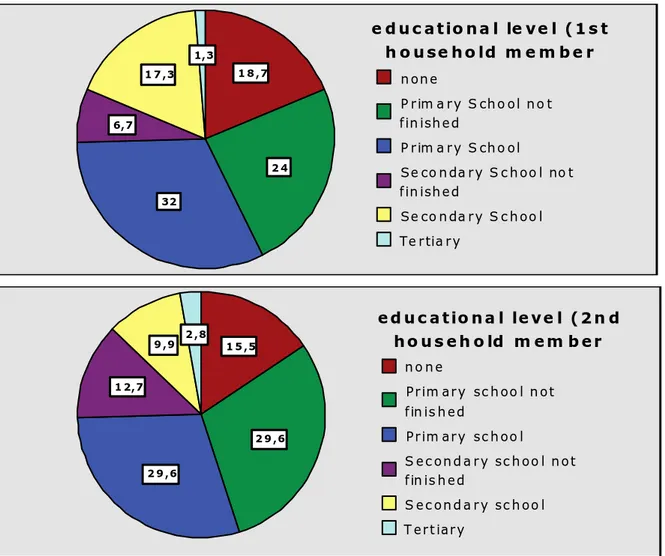
As a basis for SRL, human capital means the ability to adopt strategies for securing a liveli- hood. I have therefore focussed on the educational level of the people questioned. In 74.7%
of cases, this does not exceed primary school level, with 18.7% claiming to have never been to school at all (see figure 8).26
Figure 8: Educational level of the first and second household members
1 8 ,7
2 4 32
6,7 1 7 ,3
1,3
e d u c atio n a l le v e l (1 s t h o u se h o ld m e m b e r
n on e
P rim a ry S ch o ol n o t fin ish ed
P rim a ry S ch o ol
Se co n da ry S c h oo l no t fin ish ed
Se co n da ry S c h oo l Te rtia ry
1 5 ,5
2 9 ,6 2 9 ,6
1 2,7
9 ,9 2 ,8
ed u c a tio n a l le v e l (2 n d h o u s e h o ld m e m b er
n o n e
Prim ary sc h oo l n ot fin is h ed
Prim ary sc h oo l
S ec on d a ry sc h oo l n ot fin is h ed
S ec on d a ry sc h oo l T ert iary
Source: Data set of the household survey, March 2005; own calculations.
However, the level of education does not seem to influence the choice of the most important activity for the household. Within all the groups this is agriculture, which accounts for more than 70%. Further, table 5 shows that the most important non-farm activity is trade, which is explained by the fact that many households sell farm products, often in smallest quantities
26 I concentrated on the first and second household member, for these are, in most cases, the house- hold head and his or her partner. They have to be agreed on being the ones responsible for diversi- fication, as well as for the education of their children.
(piece meal), throughout the year. Income from trade is therefore of high importance, but the revenue still is in most cases negligeable.
Table 5: Most important activity and most important non-farm income source as well as annual income of the households compared to educational level first household member
Educational level (1st household member)
Most important activity of the household
Percent Most important non-farm income source
of the household
Percent Annual income of the group
in average (maximum in brackets)
Agriculture 85.7 Manufacturing 14.3
Manufacturing 7.1 Trade 35.7
Trade 7.1 Defence and related services 7.1
Education, health, political/
social/religious activities
7.1 No education
No answer 35.7
16,557.14 (122,700)
Agriculture 72.2 Manufacturing 5.6
Construction 5.6 Trade 72.2
Trade 11.1 Sale, maintenance, and repair of mechanical and technical devices
5.6
Sale, maintenance, and repair of mechanical and technical devices
5.6 Education, health, political/
social/religious activities
5.6 Primary school
not finished
Defence and related services 5.6 No answer 11.2
26,975 (193,200)
Agriculture 87.5 Manufacturing 12.5
Trade 4.2 Trade 62.5
Education, health, political/
social/religious activities
4.2 Sale, maintenance, and repair of mechanical and technical devices
4.2 Casual labour 4.2 Transport and storage 8.3 Primary school
Education, health, political/
social/religious activities
4.2
55,555.04 (287,310)
Agriculture 80 Trade 40
Other repairs 20 Education, health, political/
social/religious activities
40 Secondary school
not finished
Hotels, restaurants, bars 20
23,200 (90,000)
Agriculture 69.2 Manufacturing 7.7
Construction 15.4 Construction 7.7
Education, health, political/
social/religious activities
15.4 Trade 46.2
Education, health, political/
social/religious activities
15.4 Secondary school
Communication, finance, real estate, law, etc.
7.7
104,050 (448,000)
Others Agriculture 100 Manufacturing 100 265,010
(265,010) Source: Data set of the household survey, March 2005; own calculations.
Table 5 ascertaines that the higher the level of education, the higher the income. This is true for all groups except ‘secondary school not finished’. Thus, diversification becomes more successful in partnership with education. Therefore my hypothesis in this part is confirmed, which also goes hand in hand with findings from Marenya et al. (2003) for the Vihiga Dis- trict, Western Kenya, as well as from Bryceson (1999) for other countries.
However, there is a difference between the most important non-farm income source and the most important non-farm activity. Looking at the last named, it shows that households on primary school level, whether school has been finished or not, have diversified the most. But this does not indicate higher or secure incomes. This is also shown when comparing the educational level with the categories of activities (table 5 above): Many households with a low level of education belong to the group relying on agricultural incomes alone, while in relation there is a high number of better educated household heads involved in non-farm ac- tivities. The point is confirmed further when looking at the changes in non-farm activities during the last five years. More than half of the 18.7% of households which experienced such changes have not finished primary education. A higher level of education therefore not only stabilises employment, but these household heads also invest more in the education of their children27, thus improving future prospects.
Social Capital
The importance of social capital, and of trust, has often been emphasised in the literature (see Alila (1990); Fukuyama (2002); Barr (2002); Scoones (1998)). The data from this survey also leads to the conclusion that most households do belong to social groups such as self- help groups. These memberships are independent of their diversificational status or income.
This, on the other hand, is not true for agricultural orientated groups or associations where the members mainly stem from households who generate their income from agriculture alone. This can be explained by the fact that many sugar cane farmers are outgrowers of sugar companies. Proved by the Kenyan Central Bureau of Statistics (CBS) and also found in this survey, it seems to be common that belonging to a business association is correlated with the educational level of the entrepreneur. Thus, holding a university degree supports such membership, while lesser educated entrepreneurs tend to remain either in self-help groups or in no social group at all.
As for subsistence farmers, it is assumed that they are embedded in reciprocal networks, ei- ther on family or on village level, which, according to Omosa (n.d.), they cannot afford to leave behind without having secured their economical situation in different ways. Interest- ingly, in this survey more than 50% of the households admitted to not asking anyone for help in times of financial stress and with problems concerning agriculture, transport needs and so on. This leads to the conclusion that reciprocity is not important in Kakamega Dis- trict. However, looking at financial and transport problems, it is clear that neighbours, as well as family members themselves, are not in a position to offer help, for they neither own
27 70.51% of the expenditures on education are spent by households living mostly from non-farm in- come (third income group in figure 7).