www.giga-hamburg.de/workingpapers
___________________________
Seeking Opportunities:
Migration as an Income Diversification Strategy of Households in Kakamega District in Kenya
Lena Giesbert
N° 58 September 2007
Edited by GIGA German Institute of Global and Area Studies / Leibniz-Institut für Globale und Regionale Studien.
The Working Paper Series serves to disseminate the research results of work in progress prior to publication to encourage the exchange of ideas and academic debate. An objective of the series is to get the findings out quickly, even if the presentations are less than fully polished. Inclusion of a paper in the Working Paper Series does not constitute publication and should not limit publication in any other venue. Copyright remains with the authors.
When Working Papers are eventually accepted by or published in a journal or book, the correct citation reference and, if possible, the corresponding link will then be included in the Working Papers website at:
www.giga-hamburg.de/workingpapers.
GIGA research unit responsible for this issue: Research Programme 3 ‘Transformation in the Process of Globalisation’
Editor of the GIGA Working Paper Series: Anja Zorob <zorob@giga-hamburg.de>
Copyright for this issue: © Lena Giesbert
Editorial assistant and production: Silvia Bücke and Vera Rathje
All GIGA Working Papers are available online and free of charge at the website:
www.giga-hamburg.de/workingpapers. Working Papers can also be ordered in print. For production and mailing a cover fee of € 5 is charged. For orders or any requests please contact:
E-mail: workingpapers@giga-hamburg.de Phone: ++49 (0)40 - 428 25 522
GIGA German Institute of Global and Area Studies / Leibniz-Institut für Globale und Regionale Studien Neuer Jungfernstieg 21
20354 Hamburg Germany
E-mail: info@giga-hamburg.de Website: www.giga-hamburg.de
Seeking Opportunities:
Migration as an Income Diversification Strategy of Households in Kakamega District in Kenya
Abstract
Migration and remittances are widely seen as major components of diversification strate- gies aimed at coping with risky environments in developing countries. The debate in the literature mainly concentrates on effects of and access to the strategy of migration. Against this background, the paper investigates patterns, determinants and the impact of internal migration on households based on data from a densely populated rural area in Western Kenya. The motivation behind migration is largely economic in kind. Accordingly, remit- tances account for a substantial share of household incomes. Results derived from a probit model estimation indicate that the likelihood of migration is independent from the wealth position of households. Instead, demographic household factors, education-related vari- ables and migrant networks are of central importance. Migration and remittances are ob- viously more easily accessible than other opportunities of income diversification beyond farming for households across all levels of wealth, including the poorest households.
JEL classification: R23, Q12, D13
Key words: Migration, remittances, income diversification, coping strategies, sub-Saharan Africa, Kenya.
Lena Giesbert, M.A.
is a research fellow at the GIGA Institute of African Affairs Hamburg, Germany. The re- search for this paper was carried out as part of the project: ‘BIOTA E14 Sustainable Devel- opment, Coping Strategies of Micro and Small Enterprise and Farm Households in Kenya – Kakamega Forest’ under the supervision of Prof. Dr. Robert Kappel, president of GIGA, and funded by the Bundesministerium für Bildung und Forschung (BMBF).
Contact: giesbert@giga-hamburg.de, website: http://staff.giga-hamburg.de/giesbert.
versifizierung von Haushalten des Kakamega Distrikts in Kenia
Migration und damit verbundene remittances werden weithin als wesentliche Bestandteile von Diversifizierungsstrategien betrachtet, die von Haushalten in Entwicklungsländern zur Bewältigung von Risiken angewendet werden. Im Mittelpunkt der wissenschaftlichen Diskussion stehen dabei die Auswirkungen und der Zugang zu Migration und remittances.
Vor diesem Hintergrund untersucht die Studie die Muster, Bestimmungsfaktoren und Auswirkungen von Migration auf die Haushalte der Migranten im Distrikt Kakamega, einem stark bevölkerten ländlichen Gebiet Westkenias. Die Motivation zur Migration ist hauptsächlich ökonomischer Art. Dementsprechend machen remittances einen hohen Anteil an den Einkommen der Empfängerhaushalte aus. Die Ergebnisse der Schätzungen des für die Analyse verwendeten Probit-Modells deuten darauf hin, dass die Wahrscheinlichkeit von Migration unabhängig von der Wohlstandsposition der Haushalte ist. Von hoher Be- deutung sind dagegen demographische und bildungsbezogene Faktoren sowie die Existenz von Migrantennetzwerken. Migration (und remittances) sind offenbar für Haushalte aller Einkommensschichten, einschließlich der ärmsten Haushalte, leichter zugänglich als andere Strategien der Einkommensdiversifizierung in nicht-landwirtschaftliche Aktivitäten.
Households in Kakamega District in Kenya
Lena Giesbert
Article Outline 1. Introduction
2. Migration as an Economic Household Strategy 3. Patterns of Migration in Kakamega District 4. Determinants of Migration
5. Effects from Migration 6. Conclusion
1. Introduction
Internal migration, especially the migration of labour out of rural areas and thereby out of farm jobs or the rural non-farm sector, has always been an important feature of economic de- velopment.1 While economists have typically studied rural-to-urban migration in developing countries and the role of economic opportunities in the cities, or basically the industrial sec- tor, it has increasingly been shown that today’s reality of internal migration in these countries does not usually follow this direction rigidly. Other dimensions may include that of a ‘spatial
1 The paper focuses on internal migration, as this kind of migration prevails in the region under study, the motivations behind are largely the same as with regional or international migration. In respect of the diffi- culties emerging up to today from colonial demarcations in African countries, the concept of 'internal' or 're- gional' migration are either way strongly interconnected, or even interchangeable in some cases (Adepoju 1995:93).
diversification’ of rural households, which react to a risky environment in terms of imperfect markets, land shortages, rising population, the insecurities of agricultural production etc.
This has been put forward particularly by the New Economics of Labour Migration (NELM) and several corresponding or extended approaches.2 As part of other income generating ac- tivities of a household, internal migration flows may well go into multiple directions and multiple sectors, including rural areas and activities. Not only in the migrant-receiving areas, but also in the migrant-sending areas, migration and potential remittances can have far- reaching impacts on incomes and on the production of agricultural households.
In this regard, there are strong arguments in the debate on both sides of the ‘migration-coin’.
On the one hand, the prominent argument of the ‘brain drain’, namely the loss of human capital and its consequences, as well as the opportunity costs of lost labour have been con- tinuously set out as the major effects of migration which are assumed to counteract any posi- tive backflows, such as remittances or newly acquired know-how. On the other hand, argu- ments have been made on the importance of migration for the welfare of the remaining households particularly in environments with a limited job market and income and produc- tion constraints. Strongly connected to the issue of the consequences of migration is that of its causes. Studies have revealed typical push- or pull-factors, but in recent years have also in- creasingly focused on underlying characteristics of the individuals, households and commu- nities of the migrant population, which are assumed to play a significant role with regard to the migration decision and inherently its potential benefits. Several studies have further pointed at a strong selectivity of migration, especially regarding physical and human capital characteristics, such as asset endowment and education.
Against the background of this ongoing debate, the following analysis aims at providing evi- dence from a typical case of a densely populated rural area in Sub-Saharan Africa with over half of the population living below the poverty line. It will shed light on the empirical situa- tion of the underlying factors of substantial ongoing migration flows from Kakamega District in the Western Province of Kenya, which has historically also been called the countries ‘hu- man resource reservoir’ (Oucho 1996:9).The district itself is characterized by a situation in which livelihoods are increasingly threatened as areas for cultivation are shrinking (per per- son), which leads to decreasing per capita income, soil fertility and hence productivity. As it is nearly impossible to intensify agricultural production in the district, due to the constraints mentioned above, there is an urgent need to resort to activities outside the agricultural sector within this area, including migration.
The paper aims at revealing which household and individual factors shape the decision to migrate. It tries to provide more insight into the potential causes of and the motivation be- hind the decision to migrate as well as to deliver evidence on who or which kind of house- holds and individuals have access to this strategy of income diversification. In addition to the assessment of patterns and determinants of migration, the paper will investigate its effects on migrant-sending households.
2 See e.g. Lucas and Stark 1985, 1993; Hoddinott 1994; Mendola 2005; Azam and Gubert 2006.
The analysis is based on a household survey conducted in Kakamega district from October 2005 to November 2005. By viewing migration as a household strategy and decision to diver- sify income sources it follows the NELM approach. Nevertheless, the analysis also includes the role of individual economic opportunities, which have been emphasized by the early studies of internal migration. These are partly traced back in individual migrant information, which has been collected in the survey. The investigation of the impact of migration and re- mittances on the migrant-sending households will concentrate primarily on their effects on the households’ income and resource allocation.
The paper starts with an outline of the theoretical and empirical background explaining mi- gration as a household strategy to cope with high risks and insecure incomes in risky envi- ronments of developing countries. This is followed by an assessment of migration flows out of Kakamega district, in terms of directions, time dimensions and motivations. The next sec- tion will present set out central characteristics of the individual migrants and the migrant households eventually generating a model of migration determinants in Kakamega district.
Finally, the social and economic linkages between the migrants and their households of ori- gin are set out as well as some of the major effects of migration, in terms of negative and posi- tive impact on the migrant sending household, especially with regard to remittances.
2. Migration as an Economic Household Strategy
The majority of the population in developing countries live in rural areas and their liveli- hoods are based on agricultural activities or small-scale entrepreneurial activities, as in the case of self-employed petty traders, which rarely offer more than an income on the subsis- tence level. Households in these regions are often exposed to strong production risks and economic constraints and react to them by a range of adaption- and coping strategies, which are employed ex-ante or ex-post to smooth income and consumption. In this regard, it is widely recognized that there is an increase of ‘multi-active’ households, which derive income from different household members and activities in order to survive as an economic entity.
As Barrett et al. (2001) observe, the typical image of Sub-Saharan Africa as a continent of sub- sistence farmers hardly reflects nowadays reality: non-agricultural income in poor rural areas (including remittances) often make up 40-45% of the mean monthly household income.
Viewing migration in developing countries in a context of household strategies such as diver- sification and informal self-insurance mechanisms against risks is an idea which has first emerged in the 1990s within migration theories such as NELM, or inherently within ap- proaches on risk management strategies, as for instance promoted by the World Bank, or sus- tainable rural livelihood strategies, as put forward by the Department for International De- velopment (DFID), United Kingdom.
Until the end of the 1980s, explanations for Sub-Saharan Africa of why people move, as well as its underlying causes and consequences have rather been dominated by a perspective which basically draws on individual factors and focuses almost exclusively on rural-urban
migration. This was based on assumptions of a dual economy in which labour migration is explained according to structural imbalances between the poor countryside and a growing industrial sector in the cities. This includes the argumentation along a ‘push-pull’ hypothesis (see below) and the so called ‘bright lights’ theory whereby migrants are attracted by the vir- tues of the destination.3 This body of literature follows the early works on migration of Ravenstein (1885, 1889) and his ‘laws’ of migration which drew attention to origin- destination economic differentials as the primary determinant of migration, and the system- atic extension of this work by Lee’s ‘theory of migration’ (1966) within which the ‘push-pull’
hypothesis was rationalized in a model. This theory also followed the ideas of Lewis’ (1954) seminal work on economic development based on a classical two-sector model in which the earnings at the capitalist-sector wage always exceed the non-capitalist sector earnings of in- dividuals willing to migrate, and its neo-classical interpretation by Ranis and Fei (1961) which includes the idea of equation of the marginal value products of labour between the two sectors through migration.4
Especially microeconomic models of rural out-migration have then been grounded on the work of Harris and Todaro (1970). Their model is based on wage differentials and the prob- ability of employment in the urban sector, whereby the individual decision to migrate is driven by the expected potential income. These neo-classical models of rural out-migration have later been criticized for a number of reasons, but mainly for the focus on wages and the disregard of other important impacts on the migration-decision, for treating migration as an individual decision, as well as the inability to explain substantial differences of migration- behaviour in various regions. Further, a major critique was the disregard of impacts on the rural economy.
Another body of literature has focused particularly on the relationship between migration and human capital. Particularly based on the work of Sjaastad (1962), such models view mi- gration as an investment decision, taking into account differences in return and the costs of migration, as a result of human capital characteristics of individuals. Thereby, the issue of possibly strong selectivity of migration is explicitly addressed.
Accordingly, the following studies, as introduced above, turned their view to the household as one unit of decision-making, including new ideas on ‘spatially diversified’ families, which react to and are influenced by the risky nature of rural production and the absence of finan- cial- and insurance markets in low-income rural areas.5 In this sense migration has also be- come part of the discussion on risk management and coping strategies of poor rural house- holds. Migration and remittances are seen as part of diversification strategies, which are em- ployed to informally insure against risks and gain additional or complementary household
3 E.g. the studies of Mitchell (1969) and Garbett (1975) for the present Zambia-Zimbabwe area. Later studies have again focused on the rural-urban divide in terms of wage as well as structural differences in the sense of a dual economy, yet they have generally changed towards a household-based perspective. E.g. the studies of Bigsten (1996) and Oucho (1996) for Kenya.
4 As cited in Taylor and Martin (2001).
5 E.g. Rosenzweig 1988, Hoddinott 1994, Tacoli 1998.
income. Accordingly, Ellis and Harris (2004) argue, that migration is one of the central ways to react to and minimize risks:
For rural households, risks are particularly related to natural shocks (floods, drought etc.). All households, whether rural or urban, are prone to the personal shocks of chronic illness (incl. HIV/Aids), accidents, and death. Risks are reduced by diversifying livelihoods, and mobility is the main, but not only means of doing this (Ellis and Harris 2004:6).
These approaches have also put emphasis on the effects of income diversification, including remittances, on the consumption and investment behaviour of the receiving households.6 In economic migration theories it has been particularly put forward by the New Economics of Labour Migration (NELM) that migration in developing countries is part of a household strategy which aims at maximizing utility of all its members and which is driven by insur- ance motives (e.g. Lucas and Stark 1985, Stark 1991). It is argued that a risky environment, especially with regard to income insecurity, encourages out-migration as a diversification strategy. As Lucas and Stark (1985) argue, the solidarity and support of both sides, the mi- grants and its household of origin, is guaranteed in a way of a contractual arrangement in which remittances play an important role. A similar view can also be found within ap- proaches outside NELM. According to Bigsten (1996), internal migration in Kenya may well be determined by individual factors with regard to permanent migration. Yet, particularly in the context of rural areas in Eastern Africa dominated by small-scale farming he observes a tendency towards circular migration, including a clear return option, in which households divide their labour force between the shamba and the city, so as to benefit the whole family.
Eventually, NELM has introduced a new aspect in the debate by explicitly considering the consequences of migration in the sending household and area. These can be negative effects such as migration costs and entry barriers (e.g. loss of labour force and human capital re- sources, fixed and opportunity costs for the whole household) and positive effects such as ris- ing income and productive investment at origin. Both are assumed to be weighted against each other and to determine the migration decision. Based on this perspective, a number of contributions have emphasized the existence of complex motivations and effects of migration and remittances in search of the role migration might play in fostering or hindering economic development in sending communities, or, on the household level, the level of wealth of its members (e.g. Taylor and Martin 2001, Mendola 2005).
Within the above outlined household based approaches it is broadly understood, that it is primarily the unit of a household, which takes the migration decision and benefits through the diversification of income and sharing of risk. The individual is only implicitly assumed to also gain from this ‘contractual’ arrangement. Hoddinott (1994), drawing from an empirical study in Western Kenya, goes beyond this purely household-based perspective. In his model of migration he combines individual factors, such as wage-based considerations in the sense
6 E.g. Ellis 1998, Rosenzweig und Stark 1989, Cox et al. 1998, Nelson 2002, Bryceson 2002.
of the migrants’ income potentials, as well as the household level, expressed for instance by income flows in the household with or without migration. Thereby he considers migration to be an individual as well as a household based strategy to maximize utility.
Based on the findings of NELM, this paper views migration in Kakamega district as a house- hold strategy in reaction to risks and economic constraints. Though, in line with Hoddinott’s extended approach, migration is not only seen as a household decision determined by factors on the household level, but also determined by individual motivations of the migrants them- selves. Therefore the analysis also includes individual characteristics of the migrants.7 In view of the above-mentioned limitations for households in the district to raise agricultural produc- tion significantly and an apparent lack of credit- and insurance markets in the area, it is hy- pothesized, that (a) migration in Kakamega district is a reaction to area specific risks and economic constraints. It is a strategy of households to informally insure against risks and di- versify their income portfolio. Drawing from the literature, it is further aimed to provide evi- dence for the determining factors of migration in the district, which can be said to serve as an example for rural areas in Subsaharan Africa in terms of the above-mentioned economic con- straints going along with a high overpopulation. Therefore it is further hypothesized, that (b) the likelihood of the migration is determined by individual-, as well as household character- istics. This is particularly true for characteristics influencing the income generating abilities of migrant- vis-à-vis non-migrant household members. The likelihood of migration is not de- pendent on the household’s wealth position, which means that poor households are not a priori excluded from participating in migration.
By testing the hypotheses, the analysis shows who migrates and why. By doing so, the analy- sis should provide insights into the premises and possible consequences from that for the households of origin, particularly against the background of the assumption that migration is a gainful and risk reducing strategy. Finally, this can provide important insight into the po- tentials of migration as a way to contribute to poverty reduction and eventually increase wealth.
3. Patterns of Migration in Kakamega District 3.1. Migration in Kakamega District: Overview
After independence, reflecting a typical trend for the whole of Sub-Saharan Africa, Kenya has continuously experienced rapid urbanization rates, largely based on a great population influx from the densely populated rural areas in the western part of the country. As for today, these areas have then been characterized by a low development of the rural economy, subsistence farming and high poverty rates. For several decades migration patterns were clearly domi-
7 It is important to note, that the information on individual migrants was collected in the household survey underlying the analysis, unfortunately it was not possible to follow up the individuals and thereby gain di- rect information from them. This may well have lead to a somewhat weighted perspective in favour of moti- vations on the household level.
nated by rural-urban migration into the largest cities Nairobi, Mombasa, and increasingly Ki- sumu (Development Plan 1974-1978; 1989-1993). Nevertheless, in the last two decades migra- tion patterns have started to become much more heterogeneous, with growing shares of mi- grants moving from rural areas into other rural areas or smaller towns, such as Nakuru or Eldoret (GoK 2005).
While the Western Province, in which Kakamega District is one of eight districts, has perma- nently experienced a high average population loss, it has still remained the area with the highest population density in the whole country due to persistent population growth.
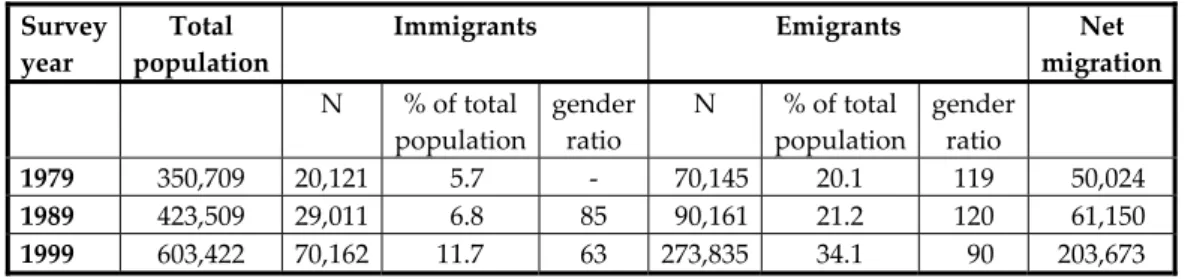
Kakamega district contributes most to the high population share and hence also shows the highest emigration rates. As illustrated by Table 1, there has been a rising tendency of migra- tion out of the district throughout the periods surveyed by the last three national population censuses.
Table 1: In- and Out-migration in Kakamega District
Survey year
Total population
Immigrants Emigrants Net
migration N % of total
population
gender ratio
N % of total population
gender ratio
1979 350,709 20,121 5.7 - 70,145 20.1 119 50,024 1989 423,509 29,011 6.8 85 90,161 21.2 120 61,150 1999 603,422 70,162 11.7 63 273,835 34.1 90 203,673 Source: GoK, Central Bureau of Statistics, 1979, 1996, 1999, 2005, compiled and calculated by Wondimu Kenea
(2006, previously unreleased).
It can be seen that the net population loss has remained most significant within the group of young males between the age of 10-39 years throughout the above mentioned periods.
Changes, though, can be seen with regard to the overall share of female migrants, which has considerably increased as can be seen by a gender ratio of 90 by 1999 compared to around 120 in the previous two censuses. Other changing trends, which have been identified, concern the marital status, with growing numbers of married migrants, and the educational level, which has continuously converged and increased for male and female migrants.8 Looking at mone- tary transfers from migrants, there is a range of studies, which have underscored the impor- tance of remittances for the Western Province of Kenya.9 Yet, data on remittances transfers from and to migrants have not been collected in any of the censuses from 1969 onwards.
Therefore, historical trends cannot be outlined at this point and the underlying household survey of the paper offers the first representative data on these transfers for Kakamega Dis- trict.
8 One reason for this is certainly an overall increase in the education level of the Kenyan population due to the invention of free primary schools in the country.
9 See e.g. the studies of Hoddinott (1994), Oucho (1996) or Agesa (2001).
3.2. Data and Descriptive Statistics
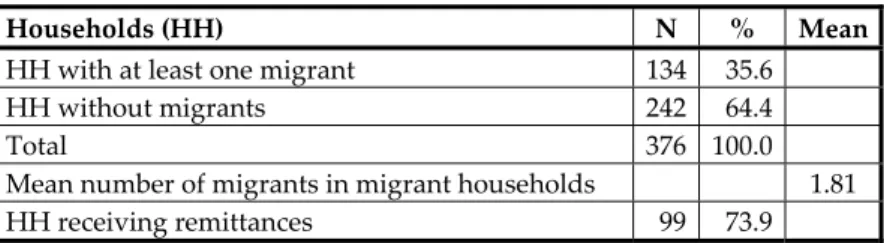
The following analysis is based on a survey of 376 households with 1,949 household mem- bers from 20 clusters in Kakamega District, Kenya, conducted in October and November 2005.10 From these clusters 16 were situated in rural areas and 4 were situated in some urban agglomerations. The survey collected information on household characteristics, asset en- dowment, agricultural production and non-farm activities amongst others. A special annex questionnaire on migration was included. As can be seen in Table 2, within the sample of 376 households there were 134 households (35.6%) with at least one migrant. Migrant households had a mean number of 1.81 migrants. Remittances from at least one migrant were received by 99 of the migrant households (73.9%).
Table 2: Incidence of Migration and Remittances
Households (HH) N % Mean HH with at least one migrant 134 35.6
HH without migrants 242 64.4
Total 376 100.0 Mean number of migrants in migrant households 1.81 HH receiving remittances 99 73.9 Source: Author’s calculations.
In the following, this paper will give an overview on the major characteristics of migration from Kakamega Districts in terms of its geographical and temporal patterns, as well as the major motivations underlying this migration.
3.3. Geographical and Temporal Patterns of Migration
As outlined above, many studies on internal migration in Africa have emphasized the signifi- cance of increasing rural-urban migration and urbanisation. It has been pointed out, that within Kenya migration out of rural areas into the cities is indeed still of great importance, which is especially true for the Western Province. Data by place of birth indicate that the ma- jority of out-migrants from Western province went to urban areas, mainly Nairobi and Mom- basa (GoK 1999: 21). Yet, there are also substantial amounts of movements out of urban areas or into rural areas, which can be seen by the fact that besides Nairobi and Mombasa also sev- eral rural districts (e.g. Nakuru, Kajiado, Uasin Gishu, Laikipia, Kericho) recorded a net gain of migration (ibid: 7, 15). The phenomenon of internal migration in Kenya in general and in Kakamega district in particular is therefore complex and highly varied. Likewise, this is re-
10 The household, which has been analyzed in the survey is that of the people who live on the shamba (Kiswa- hili: farm), generally referred to as the people who 'eat from the same pot' and who understand themselves as a unit of decision-making under one household head. Former members of this household who have migrated, but retain strong links with the resident household are considered as associated but spatially divi- ded members of the household. These may include husbands or wives of the head of household, sons or daughters including those who are still students or who have gone for marriage and other relatives or per- sons who have formerly been considered as part of the household.
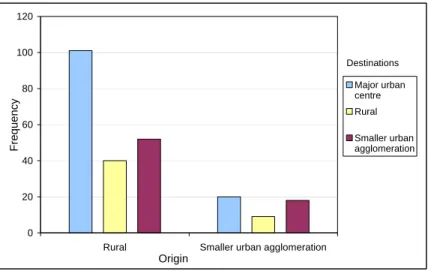
flected in the results of this study, which shows the existence of rural-urban mobility and vice versa as well as rural-rural migration and urban-urban migration11, illustrated in Figure 1.
Figure 1: Origins and Destinations of Migrants
0 20 40 60 80 100 120
Rural Smaller urban agglomeration Origin
Frequency
Major urban centre Rural Smaller urban agglomeration Destinations
Source: Author’s calculations.
It can be seen that the largest number of people from rural areas in the district as well as Kakamega town and other urban agglomerations have migrated to urban centres or other ur- ban agglomerations. Yet a substantial part, especially from rural origins, has obviously moved to other rural areas. International migration does not occur in the area, a result which is not particularly surprising in view of the high poverty rates and the strong rural character of the region.
With regard to temporal dimensions of migration, it is long-term migration, meaning the complete relocation of residence out of the district or from rural areas to Kakamega town, which prevails with 72.4% while short-term migration, referring to seasonal, periodic and ir- regular moves throughout the year, amounts to 27.6% (see Table 3).
Table 3: Temporal Patterns of Migration*
Patterns N %
Short-term (seasonal, periodic and irregular) 66 27.6
Long-term 173 72.4
Total 239 100.0
* Figures in valid percent, system missing: 2.
Source: Author’s calculations.
Destinations of long-term and short-term migrants vary to a certain extent. In both groups, not surprisingly, the largest share goes to Nairobi (around 23%). Yet, among long-term mi-
11 Although this should rather be referred to as migration from smaller urban agglomerations to urban areas, since it considers the out-migration from Kakamega town. The pure term 'urban' may be misleading in comparison to the big urban centres of the country.
grants a relatively high share moves to other rural areas in Western Province (15.7%), or smaller towns such as Kisumu (8.7%) and other cities (11.6%), whereas short-term migrants for the most part move to smaller towns such as Kakamega town (10.6%), Nakuru (10.6%), other cities in Western Province (12.1%) and other cities (12.1%); (see Annex, Figure A1, A2).
Thus, the majority of short-term migrants go into smaller urban areas, providing an indication that they are generally working-migrants. The high proportion of rural destinations of long- term migrants is explainable by the nature of the decision to change residence for a long pe- riod, which includes e.g. those decisions based on marriage or the acquisition of new land.
3.4. Reasons for Migration
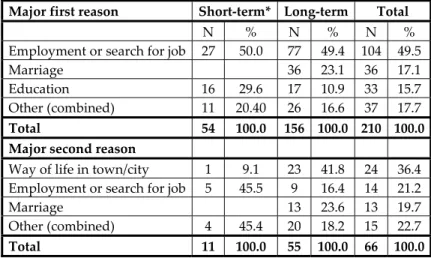
The structure of income generating activities in Kakamega District is highly diverse. Based on the same household survey, Lay et al. (2007) have shown that only 40 percent of the house- holds fully specialize in agriculture, whereas 55 percent diversify into non-agricultural activi- ties, which, however, mostly consist of low-return activities. The highest income share of households in Kakamega district is still derived from agriculture, yet the authors have shown that, for instance, with rising age of the household head the share of agricultural income in- creases sharply while income shares from non-agricultural sources sharply drop. They relate this to inheritance patterns and land shortages, which give advantage to households with older household heads in terms of land for agricultural cultivation and which lead to a neces- sity for younger ones to secure their livelihoods via non-agricultural activities. Given addi- tionally the high population rates and increasing signs of land degradation mentioned above, as well as the fact that the highest share of unemployed household members consists of young individuals between the age of 18-30 years (see Annex, Figure A3) there seem to be several indications that today the traditional agricultural income base cannot secure liveli- hoods of the whole regional population in a sustainable way. This creates a high pressure on households to switch to local non-agricultural activities, but at the same time the local job market does not seem to be able to fully absorb the local labour force, especially with regard to the younger generation. In this situation, sending household members away for migration may often be the only feasible option for households to gain enough (regular) monetary in- come. Taking a closer look on the motivations of migrants, this is mirrored by the fact that the major first reasons are largely economic in kind.
Employment or search for job dominates as the most important reason to migrate for both short-term (50%) and long-term (49.4%) migrants. For long-term migrants this is followed by marriage (23.1%) and education (10.9%) whereas for short-term migrants marriage does not count at all, but education with 29.6 percent does.12 As the major second reason for long-term migration it was stated ‘way of life in town’ (41.8%), followed by marriage (23.6%) and em- ployment or search for job (16.4%). As for short-term migrants, the major second migration
12 In a strict sense those short-term migrants who only went for education could also be excluded from the sample, since they are still part of their household of origins as children. Yet in many cases they also send remittances to their households either from additional work or education funds etc., therefore their movement might not serve only their own education but other purposes at the place of origin as well.
reason remains employment or search for job and only minor other reasons. Interestingly, this shows that at least for long-term migrants besides working reasons the motivations also seem to be based on assumed advantages of the city life (see Table 4).
Table 4: Reasons for Migration
Major first reason Short-term* Long-term Total
N % N % N %
Employment or search for job 27 50.0 77 49.4 104 49.5
Marriage 36 23.1 36 17.1
Education 16 29.6 17 10.9 33 15.7
Other (combined) 11 20.40 26 16.6 37 17.7
Total 54 100.0 156 100.0 210 100.0 Major second reason
Way of life in town/city 1 9.1 23 41.8 24 36.4 Employment or search for job 5 45.5 9 16.4 14 21.2
Marriage 13 23.6 13 19.7
Other (combined) 4 45.4 20 18.2 15 22.7
Total 11 100.0 55 100.0 66 100.0
* Seasonal, periodic and irregular.
Source: Author’s calculations.
3.5. Individual Characteristics
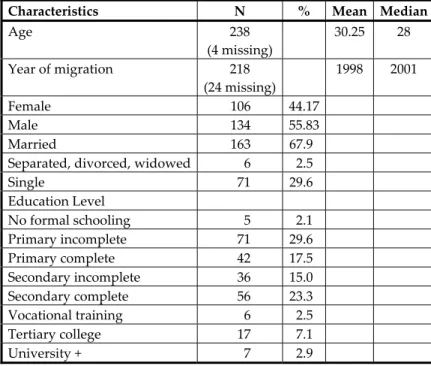
Altogether there are 242 migrants reported by the households in the sample, who are charac- terized by the following features (Table 5). On average, migrants left the district in 1998 and they are predominantly young men with an average age of 30 (median: 28) at the time of in- terview.13 It can be seen that the proportion of married migrants clearly outweighs that of single migrants with 67.9% compared to 29.6%. This is contrary to many empirical studies, which have found the largest proportion of migrants to be singles.14 Concerning the educa- tion level, the largest share of migrants has completed secondary school and a negligible number of migrants have never received formal education.
In contrast, the remaining household members have the largest proportions at the lower end of education levels, meaning high shares of people without having any formal schooling or completed primary school and almost negligible figures of tertiary college or university edu- cation (see Annex, Table A1). It may be assumed, that major reasons for this may be a lack of higher education facilities and high school failure rates due to shortages of human and mate- rial resources at most schools in the area. Moreover, the labour market is unable to absorb all the higher educated people, as noted above.
13 The age-sex structure of migrants differs substantially from that of the remaining population of the house- hold sample. While the latter shows the typical cylindrical demographic distribution, which is often obser- ved in development countries, the distribution of migrant is round shaped with the largest proportion aged between 20-40 and a larger proportion of males.
14 See e.g. Maphosa (2004) in his Report on Labour Migration in Zimbabwe, Oucho (1996) for rural Kenya and Agesa (2001).
Table 5: Characteristics of Migrants*
Characteristics N % Mean Median Age 238
(4 missing)
30.25 28 Year of migration 218
(24 missing)
1998 2001
Female 106 44.17
Male 134 55.83
Married 163 67.9
Separated, divorced, widowed 6 2.5
Single 71 29.6
Education Level
No formal schooling 5 2.1 Primary incomplete 71 29.6 Primary complete 42 17.5 Secondary incomplete 36 15.0 Secondary complete 56 23.3 Vocational training 6 2.5 Tertiary college 17 7.1
University + 7 2.9
* Figures in valid percent, system missing: 2.
Source: Author’s calculations.
3.6. Household Characteristics and Entry Barriers
Across the study sites, the average size of the households (without migrants) does not differ in non-migrant and migrant households. Before the migration of household members, though, these households must have been somewhat larger in size than their counterparts.
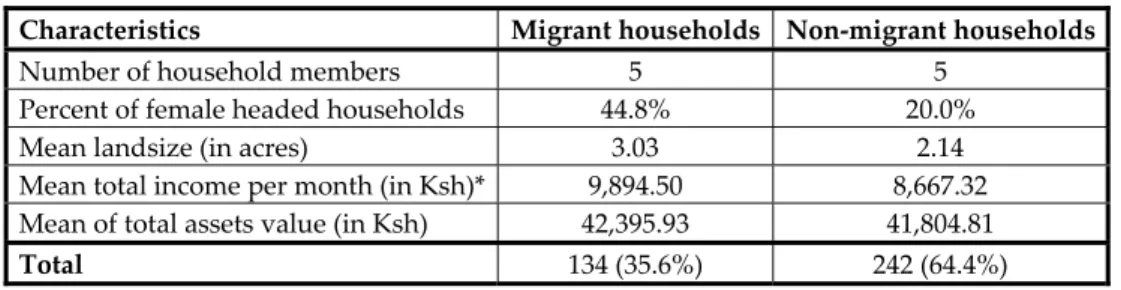
Notably, there are substantial differences in the number of female-headed households which is more than twice as high in migrant households with 44.8% compared to 20.0% in non- migrant households. This indicates, again, that there are quite a number of male spouses hav- ing migrated (as shown above). In terms of wealth, including income status and assets, mi- grant households turn out to be somewhat better off than non-migrant households.15 Their average size of land, as well as their average asset endowments and their average total in- come are slightly higher than those of non-migrant households (see Table 6).
Looking at the portfolio of activities, agriculture dominates within both categories, with mi- grant households being even more engaged in agriculture, accounting for 86.6% of all mi- grant households compared to 79.3% of non-migrant households (see Table 7).
Further, migrant households are largely involved in wage activities with 71.6% compared to 58% of non-migrant households, whereas this relation is reversed in terms of self-employ- ment activities of which 49.2% of non-migrant households report to be engaged in compared to 41.8% of migrant households. Other income activities (or rather sources in this case), such as rents or pensions, are stated by 23.1% of the migrant households and only 6.6% of the non-
15 This is formulated with cautiousness, since the information given by the respondents in the interviews is not always reflecting clear facts, but often estimations by the individual. Also the average figure can be mislea- ding in certain ways.
migrant households. 73.9% of the migrant households report the receipt of remittances The high proportion of agricultural activities in migrant households could be explained by the fact, that most of the migrants have moved out of job reasons. Moreover, households may have sent away predominantly those members with a relatively high education level and job skills, who are not absorbed by the non-agricultural sector in their home region, leaving be- hind those who are less skilled and more likely to receive a higher utility from farming. Yet, the still relatively high figures of wage activities and not inconsiderable figure of self-em- ployment prevent the determination of such a clear tendency. They may give a hint, though, that amongst the migrant households there might be a high proportion of highly diversified households. This will be examined by the following multivariate data analysis.
Table 6: Household Characteristics of Migrant and Non-migrant Households
Characteristics Migrant households Non-migrant households
Number of household members 5 5
Percent of female headed households 44.8% 20.0%
Mean landsize (in acres) 3.03 2.14
Mean total income per month (in Ksh)* 9,894.50 8,667.32 Mean of total assets value (in Ksh) 42,395.93 41,804.81 Total 134 (35.6%) 242 (64.4%)
* Including remittances-income in migrant households. Exchange rate at survey time (Dec. 2005): 1 € = 86.9 Ksh, source: Central Bank of Kenya.
Source: Author’s calculations.
Table 7: Income Activities of Households
Activities Migrant households Non-migrant households
Number Percent Number Percent
Agricultural activities 116 86.6 191 79.3
Wage activities 38 71.6 100 58.7
Self-employment activities 56 41.8 119 49.2 Other income activities/sources 31 23.1 16 6.6 Remitting migrants 99 73.9
Total 134 35.6 242 64.4
Source: Author’s calculations.
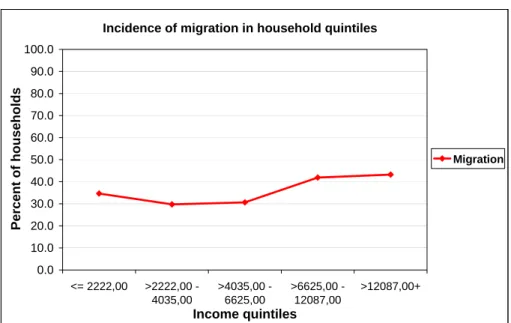
In many studies it has been argued that diversification in general and mobility in particular is highly correlated to the wealth and income status of households. This means that there are assumed to be entry barriers in terms of the costs of migration and obstacles in terms of the returns, such as remittances. In short, it is argued that poorer households are more likely to be excluded from participation in and positive returns and opportunities of migration than wealthier households (Barrett, Reardon and Webb, 2001; Bigsten, 1996; Bryceson, 2000). In Kakamega District, the incidence of migration along income quintiles of households indeed rises with income levels as shown in Figure 2. The same holds true for the percentage of households reporting remittances income (see Figure 3).
Figure 2: Incidence of Migration in Income Quintiles
Incidence of migration in household quintiles
0.0 10.0 20.0 30.0 40.0 50.0 60.0 70.0 80.0 90.0 100.0
<= 2222,00 >2222,00 - 4035,00
>4035,00 - 6625,00
>6625,00 - 12087,00
>12087,00+
Income quintiles
Percent of households
Migration
Source: Author’s calculations.
Figure 3: Incidence of Migration in Income Quintiles
Income sources in household quintiles
0.0 10.0 20.0 30.0 40.0 50.0 60.0 70.0 80.0 90.0 100.0
<= 2222,00 >2222,00 - 4035,00
>4035,00 - 6625,00
>6625,00 - 12087,00
>12087,00+
Income quintiles
Percent of households
Agriculture
Wage
Self- employment
Other activities
Remittances
Source: Author’s calculations.
Nevertheless, the extent of variation is not very large, as compared to alternative income sources such as wages, self-employment and other sources (rents, pensions etc.). It can be concluded that migration occurs across all income quintiles, although slightly rising with in- come levels. The incidence of remittances is also spread over all groups, yet rising stronger with income levels than the incidence of migration.
4. Determinants of Migration 4.1. Estimation Issues and Variables
Based on the foregoing descriptive investigation, the following econometric analysis aims at revealing determining factors of the migration decision. The evidence shown may then also lead to conclusions on whether migration can be seen as a strategy of households, which aim at self-insuring and diversifying their income sources, as well as of individuals in which both parties prefer to maximize a joint utility function. The analysis for this particular regional set- ting in Western Kenya can build on a substantial body of empirical studies on internal migra- tion based on cross-sectional data, such as Lucas (1988) for Botswana, Hoddinott (1994) and Agesa (2001) for Kenya, or Konseiga (2006) for Burkina Faso, to name just a few with regard to the Sub-Saharan African region. Following these studies, migration is modelled as a dis- crete choice of household members in which the decision to migrate out of Kakamega district or from rural parts of the district to the Kakamega city depends on a set of variables which have an influence on the potential gains from this strategy. The specificity of the analysis, however, lies in its regional focus, which reflects a typical densely populated rural area in which migration may be one of the most promising options within the portfolio of potential diversification strategies to secure livelihoods in the long run. It serves with the first and lat- est detailed empirical analysis of migration (and remittances) on the household and individ- ual level for this area.
In the estimation procedure the paper uses a probit model in which the probability of migra- tion Yi is a function of a range of individual and household characteristics, economic activi- ties and the existence of networks at the place of destination.16 The dependent variable Yi takes the value 1 if an individual household member is a migrant (Yi = 1 if yi > 0), and 0 if the individual is a non-migrant household member (Yi = 0 if yi < 0). Under the assumption of a standardized normal distribution of the residuals the probability of an observed positive re- sult is
πi = Φ (βX) + ε i, (1)
with εi being the random error term and the vector X reflecting the independent variables thought to determine the participation in the migration process. These are considered to be socio-demographic household- and individual characteristics, which are especially related to labour endowment (HHDC, IndDC), human capital endowment (Hcap), physical capital en- dowment (Pcap) and economic activities (Act) of households. These commonly tested factors
16 According to certain selection criteria, the sample for the probit analysis was slightly reduced compared to the total survey households. It was tried to select a relatively homogenous sample by selecting only recent migrants, which have moved after the year 2000 (in order to keep socio-economic circumstances in which the migration decision took place relatively constant). Out of the same reason, only migrants within the age of 16 and 64 were selected and single-person households, as well as urban clusters were removed, as it is as- sumed that the explanatory factors for migration decisions differ from that of rural areas.
are complemented by treating the migration decision also as a function of migrant networks.
The specification of the respective model yields the equation:
Φ-1 (yi | X) = β i (HHDC i, IndDC i, HCap i, PCap i, Act i, Net i) (1)
The individual socio-demographic characteristics tested are age, gender and marital status. It is assumed, that the age of a household member and potential migrant plays a significant role with regard to intra-household and individual decision-making as well as the income poten- tial of individuals. In line with the foregoing descriptive analysis it is assumed that the likeli- hood of migration decreases with rising age. A dummy for gender was included so as to fol- low up a widespread assumption that men are much more likely to migrate than women, the same of which is thought about singles vs. married members of households, with the former outweighing the latter in the migrant population. On the ground of results from the descrip- tive analysis, though, it is assumed that this relationship is reversed in the case of Kakamega district.
As part of socio-demographic household characteristics, the analysis includes the number of dependant household members, which are thought to negatively relate to the likelihood of migration (more dependant members lead to a possibly higher responsibility and reservation wage of potential migrants, which may have a deterrent impact on migration). Further it is looked at the equivalent size of households, with an expected positive relationship to the mi- gration-decision, as opportunity costs for the whole household may thereby be reduced.
The indicators for human capital endowment are a dummy variable for a high education level (completed secondary school and higher), the years of education of the household head, as well as the number of household members between the age of 18 and 25 with higher edu- cation (secondary school and higher). For all variables a strong positive relationship to the likelihood of migration is expected.
So as to verify the influence of the wealth position of households on the migration-decision it is looked at the land size possessed by the households, precisely the total land size as well as land size per potential inheritor17, and their asset endowments (tangibles, productive assets and livestock). Several studies have tested for the impact of these factors and have come to rather diverse results. Hoddinott (1994), for instance, has shown that the likelihood of migra- tion rises in wealthier households, measured by their endowment with land and assets, as they are in a better position to bear the costs of migration. Other studies, though, have found that the likelihood of migration rises as asset endowment and land size drop. This is referred to a larger disposedness of poorer households to use migration rather as a coping strategy in the absence of local options to gain enough money to adequately secure their livelihoods (e.g.
Mendola 2005, Barham and Boucher 1998). The a priori assumption in this paper is that in Kakamega district a decreasing total land size and land size per potential inheritor will lead to an increasing likelihood of migration as individuals as well as households are then de-
17 A 'potential inheritor' is defined as a son within a household (women are not able to inherit in this area) whose age difference from the household head lies in the range of 18-45 years.
pendent on other income sources aside from land cultivation (such as migration). The same is assumed with regard to the asset related variables. As to the economic activities of house- holds the analysis tests a dummy variable for land holdings (as an indication for agricultural activities), a dummy variable for sugar cane cultivation, a variable reflecting the degree of on- farm diversification (number of different crops) and a dummy variable for the existence of small-scale enterprise activities. A priori considerations are, that the first may enhance and the last three factors may reduce the likelihood of migration. This is believed, as the more households depend on agricultural activities usually the less total income they have, whereas particularly sugar cane farmers derive comparably more income from their production the same of which is assumed about those households engaged in more diversified agricultural production or more diversified activities in general (such as entrepreneurial activities). Even- tually, the existence of migrant networks at the place of destination is examined, measured by the total share of migrants within a cluster before the year 2000, who are considered to be the ‘predecessors’ of those migrants considered in the sample of this analysis. A positive rela- tionship to the likelihood of migration is assumed.
4.2. Results and Discussion
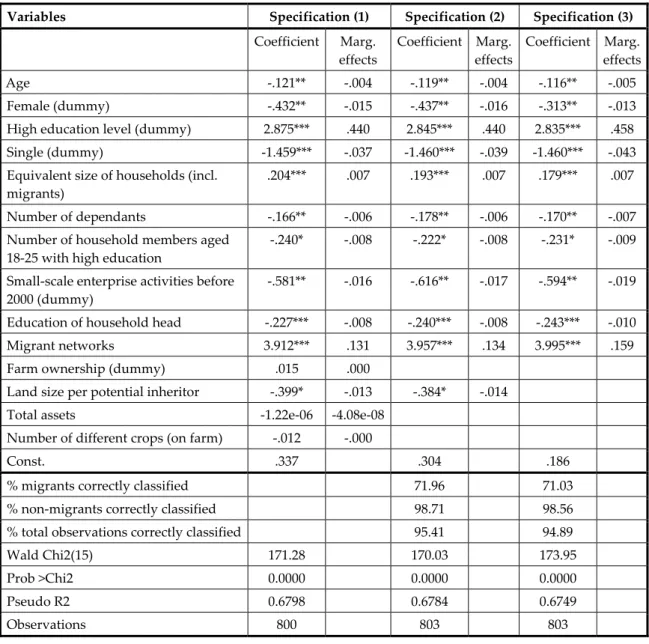
In the following, the results of the applied probit model to estimate the determinants of the migration decision are presented.18 Before turning to detailed results of the individual pa- rameter estimates it can be said that overall the model performs very well regarding the ap- plied measures of quality. The null-hypothesis, tested by the chi-squared statistics, that alto- gether the regressors are zero, can be strongly rejected. The estimation predicts very well, which individuals migrate and which do not. Table 8 shows the results of three specifications which have been tested, including the last and final model with all significant variables.
In accordance with a priori considerations it is shown that with rising age migration becomes more unlikely (significant negative relationship). As the descriptive analysis had already shown, particularly the younger generation is affected by high unemployment rates, so that incentives to search for income sources outside the local job market are presumably high.
Likewise, the gender-variable proves to be significant and has the expected positive sign.
Thus, migration is less likely for women compared to men, which is in line with several other studies mentioned above and reflects a certain role perception in which women are responsi- ble for a different set of activities related more closely to the household itself and have less chances for gainful jobs in the labour market. In the same way, the dummy variable for single individuals has the expected significant negative sign, which is a result contrary to many ex- isting studies, but in conformity with the descriptive results on the characteristics of migrants from Kakamega district.
oth of the socio-demographic household characteristics tested, the number of dependant household members and the equivalent size of the household, reveal the expected relation- ship with the likelihood of migration, which is negative in the former and positive in the lat-
18 The means and standard deviation of variables can be found in the Annex, Table A 2).
ter case. This is explicable, as usually a rising number of dependant members in the house- hold implies a rising responsibility at home for adult members of the household in working age and therefore less freedom for them to leave the family for longer periods of time. On the other hand, in overall larger households migration is less costly compared to smaller house- holds, as there are more household-members, who can compensate the loss of labour.
Table 8: Determinants of Migration (Reduced Probit Model)
Variables Specification (1) Specification (2) Specification (3)
Coefficient Marg.
effects
Coefficient Marg.
effects
Coefficient Marg.
effects
Age -.121** -.004 -.119** -.004 -.116** -.005
Female (dummy) -.432** -.015 -.437** -.016 -.313** -.013 High education level (dummy) 2.875*** .440 2.845*** .440 2.835*** .458 Single (dummy) -1.459*** -.037 -1.460*** -.039 -1.460*** -.043 Equivalent size of households (incl.
migrants)
.204*** .007 .193*** .007 .179*** .007 Number of dependants -.166** -.006 -.178** -.006 -.170** -.007 Number of household members aged
18-25 with high education
-.240* -.008 -.222* -.008 -.231* -.009 Small-scale enterprise activities before
2000 (dummy)
-.581** -.016 -.616** -.017 -.594** -.019 Education of household head -.227*** -.008 -.240*** -.008 -.243*** -.010 Migrant networks 3.912*** .131 3.957*** .134 3.995*** .159 Farm ownership (dummy) .015 .000
Land size per potential inheritor -.399* -.013 -.384* -.014 Total assets -1.22e-06 -4.08e-08
Number of different crops (on farm) -.012 -.000
Const. .337 .304 .186
% migrants correctly classified 71.96 71.03
% non-migrants correctly classified 98.71 98.56
% total observations correctly classified 95.41 94.89
Wald Chi2(15) 171.28 170.03 173.95
Prob >Chi2 0.0000 0.0000 0.0000
Pseudo R2 0.6798 0.6784 0.6749
Observations 800 803 803
* Significant at 10% level; ** significant at 5% level; *** significant at 1% level.
Source: Author’s calculations.
Of very high importance for the model is the variable for a high education level. The relation- ship is positive and highly significant, the same of which is true for the education level of the household head. Education can be seen as a factor exerting a high influence on the income potential of migrants, or, in the case of the household head’s education level, as an indicator for the human capital endowment of the whole household. These results strongly support the ideas of Sjaastad (see above) and other theories on the relevance of education for migration
and the related problem of selectivity. Indeed, this result could serve as an indication for cer- tain entry barriers to migration related to the endowment with education. Contrary to this seems to be the result that the number of household members between the age of 18-25 sig- nificantly reduces the likelihood of migration. However, on a very cautious level a possible explanation for this may be, in opposite to the foregoing education-related variables, that a larger number of higher educated young adults also reflect a better income situation in the household. It may be assumed, that these households are somewhat better off in the first place and financially able to send many of their offspring to school beyond the primary level.
This, in turn, may indicate that such households have an economically better position on lo- cation and face less necessity to send members away to gain income.
Interestingly, regarding the wealth-related variables and those reflecting economic activities of the households, land size as well as asset endowment are not significant in the model.
Though, the variable land per potential inheritor, tested in the first and second specification, does have a slightly significant relationship to the likelihood of migration (at the 10%-level).
This mirrors the foregoing assumption, that income sources for individuals of the younger generation, which is most likely to be attracted to migration, are dependant on the amount of land they can inherit from their parents. Individuals without the option to inherit enough land for making a living throughout the year, have less opportunities to gain sufficient in- come independent from their parent’s household, meaning aside from land cultivation.
Therefore they are much more attracted to migration than their counterparts with inheritance options.
In line with a priori expectations, the more households diversify in non-farm activities, namely in small-scale enterprise activities, the more the likelihood of migration of household members is reduced. On the contrary, on-farm diversification such as cultivation of many di- verse crops or cash-crops (sugar cane) being tested in the first specification, does not seem to play a role for the likelihood of migration, as both variables appear to be insignificant. Inter- esting, though, is the fact that households engaged in sugar cane farming do not have mi- grants at all throughout the sample.
Finally, the effect of migrant networks is positive as expected and appears to be of highest importance among the variables considered in the model. This confirms the hypothesis that potential migrants tend to be encouraged to migrate, if they can follow others from their home area whereby their options to have better access to information and contacts at the place of destination rise and enhance their chances on the job market.
5. Effects from Migration 5.1. Social and Economic Linkages
Strong social and economic links between migrants and their households of origin is a com- mon phenomenon of internal (as well as international) migration in developing countries.
The same is true for the Kenyan case and that of Kakamega district. Usually, there is reciproc-
ity of those links, e.g. through visits, information and social networks on both sides as well as certain economic dependencies. These may be origin-based dependencies, insecurity of urban employment which may lead to return migration, the inability to manage or care for farm en- terprise and household affairs from the distance, as well as household dependencies, such as the reliance on complementary income through the migrant.19 Generally, these links can re- flect the extent to which migration may be a joint household decision, as outlined above.
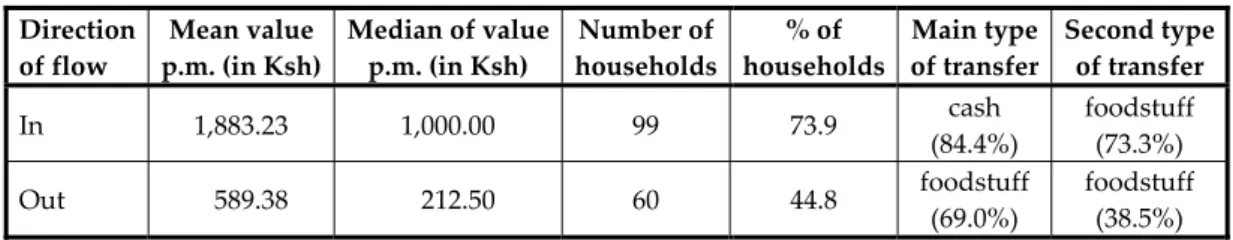
One major index for such linkages is that of home visits (see Annex, Table A3). In the survey area, almost all of the (long-term) migrants maintain relations to their households of origin in terms of more or less frequent visits. Yet, the majority of them comes ‘home’ only once or less than once a year (both 28.3%). It is important to mention the distance and the high costs of transportation as major factors shaping these visits besides other underlying factors. In terms of the economic linkages between migrants and their households of origins, many studies have underscored the role of remittances in terms of money and goods, which criss-cross be- tween destination and migrant-sending areas. The characteristics of remittances flows in Kakamega district are set out in Table 9.
Table 9: Flows of Remittances per Household and Types of Transfer
Direction of flow
Mean value p.m. (in Ksh)
Median of value p.m. (in Ksh)
Number of households
% of households
Main type of transfer
Second type of transfer
In 1,883.23 1,000.00 99 73.9 cash
(84.4%)
foodstuff (73.3%)
Out 589.38 212.50 60 44.8 foodstuff
(69.0%)
foodstuff (38.5%) Notes: Multiple statements were permitted.
Source: Author’s calculations.
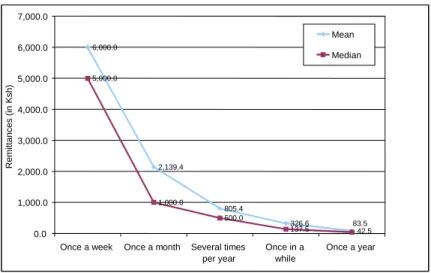
In general, inflows of remittances are of much more importance than outflows. The mean value of remittances per month received by the households is substantially higher with 1,883.23 Ksh compared to the mean value of transfers sent to the migrants of 589.38 Ksh. Fur- thermore, there is a number of 99 households which accounts for 73.9% of the total mi grant- households receiving remittances, whereas only 60 households (44.8% of total migrant households) send transfers to their migrant family member. Finally, while the main type of in-remittances consists of cash transfers (84.4% of main types), foodstuff dominates the main (69.0%) as well as the second important types (38.5%) of out-remittances. With regard to the channels of these remittances, they were mainly sent through informal ways, namely per- sonal delivery by the remitters, relatives or friends. Other important channels were the post office and bus companies, matatus (van) or taxis (mainly the Easy Coach bus company) whereas bank transfers were extremely rare (see Annex, Table A4). Figure 4 shows clearly, that the amount of remittances received sharply drops with less frequent transfer-behaviour.
Whereas those households receiving remittances once a week obtain on average 6,000.0 Ksh
19 For Africa and Kenya this has been noted in several studies such as those of Gugler and Flanagan (1978), Oucho (1996) and Agesa (2001).