Research Collection
Educational Material
Risk and safety in civil engineering 2001
Author(s):
Faber, Michael H.
Publication Date:
2001
Permanent Link:
https://doi.org/10.3929/ethz-a-004344893
Rights / License:
In Copyright - Non-Commercial Use Permitted
This page was generated automatically upon download from the ETH Zurich Research Collection. For more
Risk and Safety
in Civil Engineering
Lecture Notes on
Risk and Safety in Civil Engineering
Imprint:
Prof. Dr. M.H. Faber
Institute of Structural Engineering Group Risk and Safety
Foreword
During the last decade there has been an increasing societal concern on sustainable developments focusing on the conservation of the environment, the welfare and safety of the individual and at the same time the optimal allocation of the available natural and economical resources of society. This problem complex may easily be realised to be a complex decision problem highly influenced by the possible consequences of our actions and the probabilities that these consequences will occur – the product of which is known as the risk.
The continued development of society demands that we are able to manage the prevailing natural and manmade risks in a conscious, consistent and rational manner. According to fundamental principles of decision theory this is a prerequisite for the success of society. Managing risks is a matter of choice on how to allocate the available resources of society. A choice, which cannot be seen in isolation from the qualities on which we base society, e.g. the right to equal opportunities, education, welfare and safety. The question is and should always be – how can the resources of society best be allocated in accordance with these qualities. In this light risk management on behalf of society should be seen as a very serious matter and decision makers at all levels in society thus carry a tremendous responsibility.
Risk management concerns the analysis, assessment and decision-making in regard to the risks involved in a given activity or associated with a given hazard. The risk management process includes the joint consideration of all uncertainties prevailing the problem and all possible consequences.
Several important tasks are lying ahead, not least in the area of civil engineering. As always new civil engineering projects should be planned, designed and executed in a cost optimal manner taking into consideration the benefit of the projects as well as the possible adverse consequences such as loss of lives, damage to the environment and of course the direct costs.
Future safeguarding, maintenance and decommissioning of the infrastructure of society will even more likely demand an intensified focus on risks. Not least in the view of the seemingly ongoing and expected climatic changes and the enormous efforts they may initiate to safeguard our existing infrastructure.
The methods of risk and reliability analysis in civil engineering, mainly developed during the last three decades, are increasingly gaining importance as decision support tools in civil engineering applications. Their value in connection with the quantification and documentation of risks and the planning of risk reducing and mitigating measures is by now fully appreciated in the civil engineering profession. In the time to come the importance of risk and reliability methods will increase for the civil engineer – a fact reflected by the increasing normative and legislative requirements for the documentation
Risk and reliability analysis is in fact a multi-disciplinary engineering field requiring a solid foundation in one or several classical civil engineering disciplines in addition to a thorough understanding of probability, reliability analysis and decision analysis.
The present book is meant to provide a basic understanding and insight to the issues of risk analysis in civil engineering and has been written on the basis of a set of my lecture notes for undergraduate students at the Swiss Federal Institute of Technology, ETH Zürich, having no or only little prior knowledge in the area. The material for the book has generally been collected from what I find the best parts of already existing literature, including textbook material, scientific publications and research reports. Based on my own experience from consulting engineering and participation in industry development and research projects I have attempted to present the material in a context and a form compatible with the “approach of the engineer”. Aiming at highlighting the decision problems and their possible solutions. The cost being that some mathematical precision is lost, the benefit – hopefully – being that the potential practical significance of the presented material is more obvious.
It is important that the book is seen as an ongoing draft, evolving and hopefully improving from semester to semester. In pursuing this I gratefully acknowledge the help of my enthusiastic colleagues, Ph. D. students and assistants in my group.
Zürich, October, 2001
Prof. Dr. Michael Havbro Faber
Table of Contents
1. Risks, Hazards and Causes of Failures 1
1.1. Introduction ... 1
1.2. Definition of Risk and Detailing of the Risk Analysis ... 5
1.3. The Risk Based Decision Process ... 6
Define context... 6
Define System... 8
Identify Hazard Scenarios... 9
Analysis of Consequences... 9
Analysis of Probability... 9
Identify Risk Scenarios ... 9
Analyze Sensitivities ... 10
Risk Assessment ... 10
Risk Treatment ... 10
Monitoring and Review ... 11
1.4. Risks to Individuals and Causes of Death... 11
1.5. Sources of Risk in Engineering... 12
Failures in Structures – a Detailed Survey... 16
Failure in Dams... 21
Failures in Offshore Structures ... 23
Failures in Nuclear Power Plants... 27
Failures in Chemical Facilities ... 28
Summary Remarks ... 31
2. Basic Probability Theory 33
2.1. Introduction ... 332.2. Definition of probability... 33
Frequentistic definition ... 34
Classical definition ... 34
Bayesian definition... 35
Summary ... 35
2.3. Sample space and events... 36
2.4. The three axioms of probability theory ... 38
2.5. Conditional probability and Bayes rule... 38
3. Descriptive Statistics 43
3.1. Introduction ... 433.2. Graphical representations... 43
3.3. Numerical summaries ... 46
3.3.1 Central measures... 46
3.3.2 Dispersion measures ... 46
3.3.3 Other measures ... 47
3.3.4 Measures of correlation ... 47
4. Uncertainty Modeling 49
Stationarity and ergodicity... 59
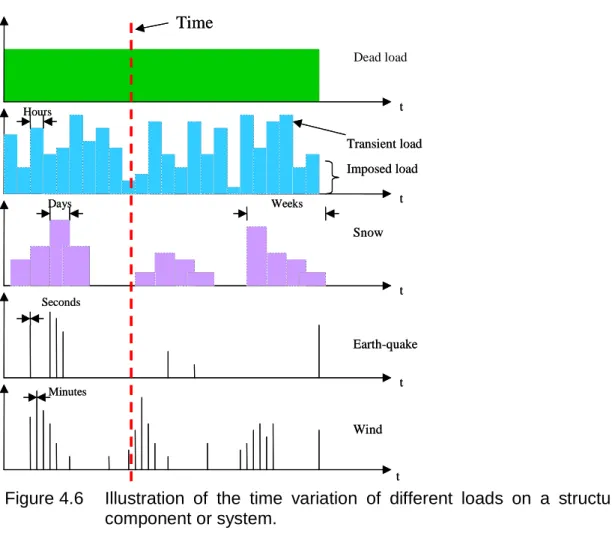
4.4. Modelling of loads... 60
4.4.1 Modelling of individual loads ... 60
Permanent loads... 61
Variable loads ... 61
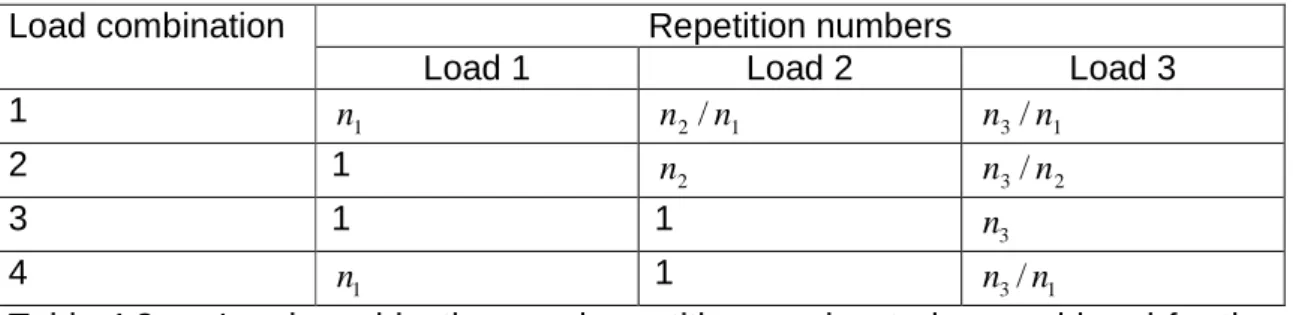
4.4.2 Combinations of loads ... 64
Turkstra’s load combination rule ... 65
The Ferry Borges – Castanheta load combination rule... 65
4.5. Modelling of resistances ... 67
4.5.1 Geometrical uncertainties ... 68
4.5.2 Material characteristics ... 68
The normal distribution ... 69
The log-normal distribution ... 70
The Weibull distribution... 70
4.6. Models uncertainties ... 70
5. Estimation and Model Building 73
5.1. Introduction ... 735.2. Selection of distribution function ... 74
Use of probability paper ... 75
5.3. Estimation of distribution parameters... 79
The method of moments ... 79
The method of maximum likelihood ... 79
5.4. Bayesian estimation methods ... 83
6. Hazard Identification and Logical Trees 89
6.1. Introduction ... 896.2. Hazard Identification ... 89
Preliminary hazard analysis - PHA ... 92
Failure modes and effect analysis - FMEA ... 93
Failure modes effect and criticality analysis - FMECA ... 93
Hazard and operability studies – HAZOP ... 94
Risk screening sessions - HAZID ... 94
Incident databanks... 96
Hazard identification in civil engineering applications ... 96
6.3. Logical Trees ... 99
6.3.1 Fault Tree Analysis ... 100
6.3.2 Event trees... 104
6.3.3 Cause Consequence Charts... 106
6.3.4 Decision trees ... 107
7. Reliability of Technical Components 109
7.1. Introduction ... 1097.2. Classical Reliability Analysis... 110
7.3. Structural Reliability Analysis... 116
8. Methods of Structural Reliability 121
8.1. Introduction ... 1218.6. Non-Normal and Dependent Random Variables... 131
8.7. The normal-tail approximation ... 131
8.8. The Rosenblatt transformation... 132
8.9. Software for FORM analysis ... 133
8.10. Assessment of partial safety factors by FORM analysis ... 133
8.11. Simulation Methods ... 136
Crude Monte Carlo Simulation... 137
Importance Sampling Simulation Method ... 139
9. Time Variant Reliability 141
9.1. Introduction ... 1419.2. General formulation ... 141
Poisson processes... 142
Normal processes... 145
9.3. Approximations to the time variant reliability problem ... 148
Non-ergodic components and random sequences ... 149
Situations to differentiate in practical cases ... 150
10. Reliability Analysis of Structural Systems 153
10.1. Introduction ... 15310.2. Probabilistic Characteristics of Systems ... 154
10.3. Mechanical Modelling of Structural Systems ... 159
Aspects of correlation ... 167
11. Bayesian Decision Analysis 169
11.1. Introduction ... 16911.2. The decision tree ... 169
11.3. Decisions based on expected values... 170
11.4. Utility assignment... 172
11.5. Decision Making Subject to Uncertainty... 172
11.6. Decision analysis with given information - prior analysis ... 172
11.7. Decision analysis with additional information - posterior analysis... 174
11.8. Decision analysis with ‘unknown’ information - pre-posterior analysis ... 176
11.9. The Risk Treatment Decision Problem ... 178
12. Bayesian Probabilistic Nets 181
12.1. Introduction ... 18112.2. Causality and Reasoning ... 181
12.3. Causal and Bayesian Networks Introduction ... 183
12.4. Bayesian Networks for Risk Analysis... 185
Fault tree and event tree analysis ... 185
Decision analysis ... 189
13. Aspects of Experiment Planning 193
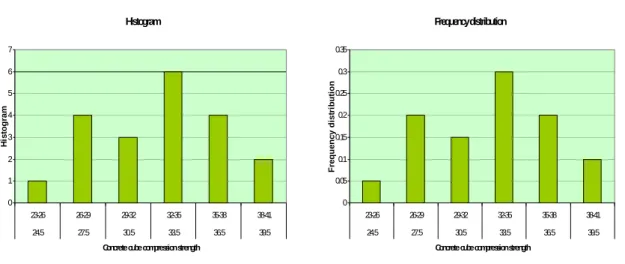
13.1. Introduction ... 19313.2. Modelling of response characteristics in structural engineering... 193
13.3. Hypothesis testing and planning of experiments... 193
13.4. Reporting of test results ... 196
14. Assessment of Existing Structures 199
Inspection strategy based on “known” deterioration ... 201
Inspection strategy based on unexpected deterioration... 203
14.3. Bayesian probabilistic reassessment of structures ... 203
14.4. Decision analysis in structural reassessment ... 205
The decision tree ... 205
Assessment of utility ... 206
Decision analysis with given information - prior analysis ... 207
Decision analysis with new information – posterior analysis... 208
Principles of reliability updating... 212
Decision analysis with ‘unknown’ information - pre-posterior analysis ... 215
Reliability updating in reassessment of structures ... 218
14.5. Updating techniques and software... 225
Probability Updating... 225
15. Risk Based Inspection Planning 229
15.1. Introduction ... 22915.2. Motivation for Risk Based Inspection Planning ... 230
Influence of uncertainties ... 230
15.3. The Problem Complex ... 232
15.4. Theoretical Framework ... 233
15.5. Assessment of Consequences ... 235
15.6. Assessment of Probabilities... 237
15.7. Degradation Processes... 240
15.8. Inspection Modelling ... 242
16. Risk Acceptance Criteria 245
16.1. Introduction ... 24516.2. Risk Acceptance by Individuals ... 246
16.3. Risk Acceptance by Society... 249
16.4. Commonly Used Formats for Acceptance Criteria ... 249
16.5. Using the Past as a Reference for Acceptable Risks... 254
16.6. Optimality Considerations ... 256
16.7. Inferred Costs of Avoiding a Fatality ... 258
16.8. Risk Aversion ... 259
16.9. Multi Attribute and Multi Objective Decision Analysis ... 260
17. References 263 18. Examples 269
18.1. Theorem of Bayes I... 26918.2. Theorem of Bayes II... 270
18.3. Descriptive Statistics... 271
18.4. Probability Density Function ... 273
18.5. Probability paper ... 275
18.6. Inference... 276
18.7. Parameter Estimation ... 278
18.8. Logical Trees ... 281
18.9. Structural Reliability I ... 284
1. 1.
1. 1. Risks, Hazards and Causes of Failures Risks, Hazards and Causes of Failures Risks, Hazards and Causes of Failures Risks, Hazards and Causes of Failures
1.1. Introduction
Civil engineering facilities such as bridges, power plants, dams and offshore platforms are all intended to benefit, some way or another, the quality of life of mankind. Therefore whenever such facilities are planned it is a prerequisite that the benefit of the facility can be proven considering all phases of the life of the facility, i.e. including design, manufacturing, construction, operation and eventually decommissioning. If this is not the case, clearly the facility should not be established.
Benefit is in essence a broad notion with different meanings for different individuals of the society, simply because different individuals may have different preferences. However, on a societal level benefit is normally understood as
• being economically efficient in serving a specific purpose
• fulfilling given requirements in regard to the safety of the personnel directly involved with and indirectly exposed to the facility
• fulfilling given requirements to the effects of the facility on the environment Taking basis in these requirements it is realised that the ultimate task of the engineer is to make decisions or to provide the decision basis for others such that it may be ensured that engineering facilities are established in such a way that they provide the largest possible benefit and such that if they cannot be proven to benefit they are not established at all.
Consider as an example the decision problem of exploitation of hydraulic power.
A hydraulic power plant project involving the construction of a water reservoir in a mountain valley is planned. The benefit of the hydraulic power plant is for simplicity assumed associated only with the monetary income from selling electricity to consumers. The decision problem thus simplifies to comparing the costs of establishing, operating and eventually decommissioning the hydraulic power plant with the incomes to be expected during the service life of the plant.
In addition it must of course be ensured that the safety of the personnel involved in the construction and operation of the plant and the safety of third persons, i.e.
the individuals of the society in general, is satisfactorily high.
Different solutions for establishing the power plant may be considered and their efficiency can be measured in terms of the expected income relative to the costs of establishing the power plant. However, a number of factors are important for the evaluation of the income and the costs of establishing the power plant. These are e.g. the period of time where the plant will be operating and produce
electricity and the capacity of the power plant in terms of kWh. Moreover the future income from selling electricity will depend on the availability of water, which again depends on the future snow and rainfall. But also the market situation may change and competing energy recourses such as thermal and solar power may cause a reduction of the market price on electricity in general.
In addition the different possible solutions for establishing the power plant will have different costs and different implication on the safety to personnel.
Obviously, the more capacity of the power plant, i.e. the higher the dam the larger the construction costs will be but also the potential flooding (consequence of dam failure) will be larger in case of dam failure and more people would be injured or die. See Figure 1.1.
Figure 1.1 Water reservoir/dam for exploitation of hydraulic power.
The safety of the people in the town downstream of the reservoir will also be influenced of the load carrying capacity of the dam structure relative to the pressure loading due to the water head in the reservoir. The strength of the dam structure depends in turn on the material characteristics of the dam structure and the properties of the soil and rock on which it is founded. As these properties are subject to uncertainty of various sources, as we shall see later the load carrying capacity relative to the loading may be expressed in terms of the probability that the loading will exceed the load carrying capacity or equivalently the probability of dam failure.
Finally the environmental impact of the power plant will depend on the water level in the reservoir, the higher the water level the more land will be flooded upstream of the dam structure and various inhabitants for animals and birds will be destroyed. On the other hand the water reservoir itself will provide a living basis for new species of fish and birds and may provide a range of recreational possibilities for people such as sailing and fishing which were not possible without the reservoir.
In order to evaluate whether or not the power plant is feasible it is useful to make a list of the various factors influencing the benefit and their effects. As the
Dam Water reservoir
Town Dam
Water reservoir
Town
the dam structure, the costs of constructing the dam structure and the implications on the safety of the people living in the town down-stream the power plant.
Table 1.1 Interrelation of benefits, costs and safety for the reservoir.
Reservoir water level
Load carrying capacity of dam structure
Income Costs Consequence of dam failure
Probability of dam failure
Low Low
Medium High
Small Low Medium High
Small High
Medium Low Medium Low
Medium High
Medium Low Medium High
Medium High
Medium Low
High Low
Medium High
Large Low Medium High
Large High
Medium Low
From Table 1.1, which is clearly a simplified summary of the complex interrelations of the various factors influencing the benefit of establishing the power plant it is seen that the various factors have different influences and that the different objectives such as income, costs and safety are conflicting. In the table it is assumed that the medium load carrying capacity of the dam structure corresponds to a medium probability of dam failure but of course other combinations are also possible.
Let us consider the case with a high water level in the reservoir. In this case the potential income is large but the costs of constructing the dam structure will also be high. Furthermore the potential consequences in case of dam failure will be large as well.
Table 1.1 clearly points to the true character of the decision problem, namely that the optimal decision depends on the consequences should something go wrong and moreover the probability that something goes wrong. The product of these two factors is denoted the risk, a measure we shall consider in much more detail in the chapters to follow. Furthermore not only the load carrying capacity of the dam structure is associated with uncertainty but in fact as indicated previously also the income to be expected from the power plant, due to uncertainties in the future market situation. In a similar way the costs of constructing the power plant are uncertain as also various difficulties encountered during the construction, such as unexpected rock formations, delay in construction works due to problems with material supplies, etc. may imply additional costs.
When deciding on whether or not to establish the hydraulic power plant it is thus necessary to be able to assess consequences and probabilities. Two key factors for the decision problem.
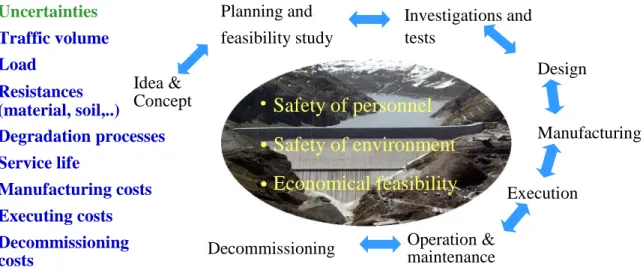
Both consequences and probabilities vary through the life of the power plant and this must be taken into account as well. At the time where the power plant is in the planning phase it is necessary to consider the risk contributions from all subsequent phases of its life including decommissioning, see Figure 1.2.
Figure 1.2 Risk contributions from different service life phases to be considered at the planning stage.
It is important to recognize that different things may go wrong during the different phases of the service life including events such as mistakes and errors during design and failures and accidents during construction, operation and decommissioning. The potential causes of errors, mistakes, failures and accidents may be numerous, as we shall see later, including human errors, failures of structural components, extreme load situations and not least natural hazards. Careful planning during the very first phase of a project is the only way to control the risks associated with such events.
As an example the dam structures must be designed such that the safety of the dam is ensured at all phases of the service life, taking into account yet another factor of uncertainty, namely the future deterioration, but also taking into account the quality of workmanship, the degree of quality control implemented during construction and not least the foreseen strategies for the inspection and maintenance of the structures and mechanical equipment during the operation of the power plant. As a final aspect concerning the structures these should at the end of the service life be in such a condition that the work to be performed during the decommissioning of the power plant can be performed safely for both the persons involved and the environment.
A final fundamental problem arises in regard to the question – what are the acceptable risks ? - what are we prepared to invest and / or loose for the purpose of getting a potential benefit. The decision problem whether or not to establish
•
•
•
Safety of environment Safety of personnel
Economical feasibility
Planning and
feasibility study tests Idea &
Concept
Investigations and
Manufacturing Design
Execution Operation &
maintenance Decommissioning
(material, soil,..) Uncertainties Traffic volume Load
Resistances
Degradation processes Service life
Manufacturing costs Executing costs Decommissioning costs
As will be illustrated in a later chapter the mathematical basis for the treatment of such decision problems is the decision theory. Important aspects of decision theory are the assessment of consequences and probabilities and in a very simplified manner one can say that risk and reliability analysis in civil engineering is concerned with the problem of decision making subject to uncertainty.
However, before we will proceed with the more advance topics such as decision analysis, we will consider a number of more basic aspects related to the evaluation of consequences and probabilities – the risk assessment.
The remainder of this chapter is thus concerned first with the definition of risk and a short discussion of different types of risk. Thereafter the risk based decision process is highlighted with a short introduction of the various steps in the analysis. Finally an overview is given of the risks we as human beings in a modern society are exposed to in our daily lives as well as the types of failures and causes of failures that are the main risk contributors when technical systems in engineering applications are considered.
1.2. Definition of Risk and Detailing of the Risk Analysis
In daily conversation risk is a rather commonly used notion used interchangeably with words like chance, likelihood and probability to indicate that we are uncertain about the state of the activity, item or issue under discussion. For example we talk about the risk of getting cancer due to cigarette smoking, the chance that we will succeed in developing a vaccine against the HIV virus in 2001, the likelihood of a getting a “Royal Flush” in a Poker game and the probability of getting a major earthquake in the Bay area of San Francisco within the next decade.
Even though we may understand from the context of discussion what is meant by the different words it is necessary in the context of engineering decision making that we are precise in our understanding of risk. As we shall see in a later chapter risk is to be understood as the expected consequences associated with a given activity, the activity being e.g. the construction, operation and decommissioning of a power plant.
Considering an activity with only one event with potential consequences C.The risk R is thus the probability that this event will occur P multiplied with the consequences given the event occurs i.e.
C P
R= ⋅ (1.1)
This definition is consistent with the interpretation of risk used e.g. in the insurance industry and risk may e.g. be given in terms of EURO, dollars or the
Risk analysis as we shall see might be performed at various levels of detail.
Therefore for the purpose of communicating the results of a risk analysis it is important that the degree of detailing used for the analysis is indicated at the same time as the analysis results. Otherwise the decision maker who bases the decision-making on the result of the risk analysis has no means for assessing the quality of the decision basis.
No general agreement has been established in this regard so far but in the nuclear industry the following categorisation has been agreed for so-called probabilistic risk analysis (PRA) or probabilistic safety analysis (PSA).
Level 1 : Analysis of the probability of occurrence for certain critical events in a nuclear power plant.
Level 2 : Analysis of the probability of occurrence and the consequences of certain critical events in a nuclear power plant.
Level 3 : As for level 2 but in addition including the effect of humans and the loss of human lives when this might occur.
Whether this classification is useful in other application areas also can be discussed but the idea of classifying the levels of risk analysis is under all circumstances a useful one.
1.3. The Risk Based Decision Process
Risk analysis may be represented in a generic format, which is largely independent from the application that is e.g. independent on whether the risk analysis is performed in order to document that the risks associated with a given activity are acceptable or whether the risk analysis is performed to serve as a basis for a management decision.
In Figure 1.3 a flow chart based on the Australian New Zealandic code 4369 (1995) is shown for a generic representation of risk analysis. In the following the individual steps of the individual steps in the flow chart will be briefly described.
Define context
Maybe the most important step in the process of a risk analysis is to identify and/or to clarify the context of the decision problem, i.e. the relation between the considered engineering system and/or activity and the analyst performing the analysis. To this end it is useful to seek answers for the following questions.
• Who are the decision maker(s) and the stakeholders and parties
• Which matters might have a negative influence on the impact of the risk analysis and its results?
• What might influence the manner in which the risk analysis is performed (e.g. political, legal, social, financial and cultural)?
Furthermore the crucial step of setting the acceptance criteria must be performed. This includes the specification of the accepted risks in regard to economical risks, the risk to personnel and the risk to the environment. In setting the acceptable risks – which might be considered a decision problem itself, due account should be taken to both international and national regulations in the considered application area. However, for risk analysis performed for decision making in the private or inter-company sphere with no potential consequences for personnel or third parties the criteria may be established without the consideration of such regulations.
Figure 1.3 Generic representation of the flow of risk-based decision analysis.
Define System
In this task the system or the activity – hereafter system - being analyzed is described and all assumptions regarding the system representation and idealizations are stated. This includes a justification of the parts of the system not being considered in the analysis. The system representation will have consequences for the level of detail in the risk analysis and this aspect should be addressed in the system description.
Define Context and Criteria
Define System
Identify Hazard Scenarios - what might go wrong
- how can it happen - how to control it
Analysis of Consequences
Analysis of Probability
Identify Risk Scenarios
Analyse Sensitivities
Assess Risks
Risk Treatment Monitor and
Review
Define Context and Criteria
Define System
Identify Hazard Scenarios - what might go wrong
- how can it happen - how to control it
Analysis of Consequences
Analysis of Probability
Identify Risk Scenarios
Analyse Sensitivities
Assess Risks
Risk Treatment Monitor and
Review
Identify Hazard Scenarios
As a next step the system is analyzed in regard to how this might fail and/or lead to consequences. Three steps are usually distinguished in this analysis, namely the
1) Decomposition of the system into a number of components and/or sub- systems. This decomposition will form the basis for the further assessment of hazards and the logical and numerical treatment of their risks.
2) Identification of possible states of failure for the considered system and sub-systems – i.e. the hazards associated with the system. This step may be performed on the basis of experiences from similar systems and information from databases containing records of failures for different kinds of systems and subs-systems.
3) Identification of how the hazards might be realized for the considered system and sub-systems, i.e. the identification of the scenarios of failure events of components and sub-systems which if they occur will lead to system failure. Important aspects in this step are to consider possible
“common cause” failures, which may lead to failure of two or more of the components or sub-systems of the considered system.
Analysis of Consequences
The consequences to be considered in the consequence analysis are the same consequences as contained in the specification of the acceptance criteria.
Typically economical consequences, loss of lives and effects on the environment have to be considered. The estimation of consequences given failure of the system of sub-systems requires a thorough understanding of the system and its interrelation with its surroundings and is thus best performed in collaboration with experts who have “hands-on” experience from the considered type of activity.
Analysis of Probability
The assessment of the probabilities of failure for the individual components and sub-systems may be based on two different approaches depending on the type of component/sub-system and the information available in regard to its performance. For components in electrical systems or process facilities where significant amounts of information is available the failure probabilities may be assessed on the basis of observed failure rates, which will be discussed later.
For structural components the situation is different in the sense that failure rate information is virtually non-existent. In these cases methods of structural reliability theory are required for the assessment of failure probabilities as explained in a later chapter.
Identify Critical Risk Scenarios
Having performed the analysis of consequences and probabilities the hazard scenarios, which dominate the risk may be identified – these are called the risk
scenarios. Often the critical risk scenarios are ranked in accordance with the risk contribution but it is also useful to consider a categorization in accordance with the components and sub-systems they involve. This facilitates the planning of risk treatment following in a later step.
Analyze Sensitivities
The sensitivity analysis is useful for the further analysis of the identified risk scenarios and normally includes an identification of the most important factors for the risks associated with the different critical risk scenarios. Also the sensitivity analysis may include studies of “what if” situations for the evaluation of the importance of various system simplifications performed under the definition of the system. In this way the robustness of the analysis may be assessed but also possible ways of reducing the risks by modification of the system or the performance of its components may be investigated.
Risk Assessment
The risk assessment process is merely a comparison of the estimated risks with the accepted risks initially stated in the risk acceptance criteria. In the risk assessment the risk contributions to the different criteria may be presented in terms of critical risk scenarios, components and sub-systems. Furthermore the results of the sensitivity analysis may be included as a guideline on possible measures to be taken for the reduction or control of risks should they not be acceptable.
Risk Treatment
Should the risks not be acceptable in accordance with the specified risk acceptance criteria there are principally four different ways to proceed
Risk mitigation : In essence risk mitigation is implemented by reducing the probability of the occurrence of the hazard scenario to zero.
In practice by modification of the system. The risk of corrosion damages in concrete structures may e.g. be mitigated by the use of non-corrosive reinforcement.
Risk reduction : Risk reduction may be implemented by reduction of both the consequences and the probability of either of these alone – in practice risk reduction is normally performed by a physical modification of the considered system. Considering the risk of fatigue failures in welded connections, this might be reduced by increasing the requirements to the quality control of the weld seams.
Risk transfer : Risk transfer may be performed by e.g. insurance or other financial arrangements where a third party takes over the
cost. Risks not related to cost consequences are normally not transferable.
Risk acceptance : As a last option if the risks do not comply with the risk acceptance criteria and if other approaches for risk treatment are not effective - risk acceptance may be an option. This may e.g. be the case when considering unacceptable economical risks and where the costs of risk mitigation and/or risk reduction or transfer are higher than the desired risk reduction. Risk acceptance may normally not be pursued when risks to personnel are considered, and if then usually only for limited periods of time.
Monitoring and Review
Risk analyses may be performed as already stated for a number of decision support purposes. For many engineering applications such as monitoring of the safety of offshore oil production platforms, cost control during large construction projects and inspection and maintenance planning for bridge structures the risk analysis is a living process involving a constant feedback of information from the considered system into the risk analysis. Whenever new information is obtained the risk analysis may be updated and in this manner used as a vehicle for optimizing the system performance in regard to the specified acceptance criteria.
1.4. Risks to Individuals and Causes of Death
For the purpose of setting the scene in regard to risks and causes of deaths for individual persons consider the statistics (valid for the UK, Thoft-Christensen &
Baker [1]) given in Table 1.2 indicating the frequency of deaths for a number of different causes.
These figures clearly illustrate that the risk to life from structural failures is negligible. For the 3-year period considered in the reported study, the average number of deaths per annum directly attributable to structural failure was 14, distributed almost equally on failures occurring during construction and the failures of completed structures. Structural failures in which there are no fatalities or injuries also occur but data on such failures are more difficult to collect because in many countries they do not have to be reported.
When comparing the relative frequencies of death given in Table 1.2, the differences in exposure times typical for the various activities should be taken into consideration. Even though air travel is a rather dangerous activity the probability that a typical individual travelling, say, 10 - 100 hours per year die due to air travel is in the range of 10-5and 10-4per year. On the other end of the scale most people spend at more than 70% of their life indoors and are therefore exposed to the possible effects of structural failure, however, this leads to an
-7
When evaluating the acceptability of risks associated with an engineering system to third party individuals the inescapable minimum risk that has to be accepted by any individual member of society such as e.g. the risk of death due to disease is often used as a measure of comparison. Many people, however, accept voluntary risks several orders of magnitude higher, but these should not be taken into account when considering the safety of engineering systems such as structures and nuclear power plants.
Activity/Cause Number of deaths per
hour per 108persons Mountaineering (international)
Air travel (international) Deep water trawling Car travel
Coal mining Construction sites Manufacturing
Accidents at home (all)
Accidents at home (able-bodied persons) Fire at home
Structural failures
2700 120 59 56 21
7.7 2.0 2.1 0.7 0.1 0.002
Table 1.2 Comparative study of annual probabilities of death of different sources. Adapted from Thoft-Christensen & Baker [1].
1.5. Sources of Risk in Engineering
Risks in engineering may be caused by a number of different sources, including failure of technical equipment, failure of structural components, operational errors, and human errors.
Generally speaking any activity such as e.g. the realization of a power plant has a certain hazard potential, i.e. the sum of all things that can go wrong. Of course not all things that potentially might go wrong will go wrong, this clearly depends on the probability that the hazards will actually occur. However, the hazard potential is a key descriptor for the risk associated with a given activity.
One of the most important roles of the engineer is to understand the hazard potential associated with a given activity and to appreciate the corresponding risks. This means that the engineer in an informed and consciously way shall be able to implement adequate means of risk treatment such that the risks associated with the activity are reduced and controlled to an acceptable level.
subjectively realized. Therefore only a certain part of the total hazard potential may be considered in the implementation of risk treatment measures. The risk treatment measures are implemented in order to deal with the risks, which are not accepted. For structural design risk treatment measures could be to design the structure such that the probability of failure is adequately low. However, only a part of the risk treatment measures will be adequate and again only a part of these will be implemented correctly. Therefore in the end only a part of the risk, which is not acceptable will be circumvented by the risk treatment measures and the remaining part may be considered risks due to human errors.
It should be mentioned that human errors not necessarily leads to increased risks. Even though this might be the normal case a number of human errors could actually lead to a reduction of risks. However, human errors are more visible when they lead to severe consequences and otherwise they are seldom discovered.
It is important to realize that when we are dealing with the design, execution operation, maintenance and decommissioning of technical installations such as e.g. structures we can only base our decisions on the knowledge we have. On the basis of this knowledge the decision problem thus is to use the resources of society or on a smaller scale the resources of the owner and/or operator of the installation cost optimally with due account to the requirements to the safety to third parties and the environment. The hazard potential, which in effect remains un-known can only be reduced by means of research, education and learning from experience.
The treatment and/or acceptance of risks, which are realized is essentially the core issue of this course. According to Lind [39] 10 to 20 percent of the total wealth produced in the developed countries is in one way or the other reinvested in to risk treatment such as safety, risk reduction and public health. The decisions on how to allocate these resources should be justifiable. A responsible way to ensure this is by quantifying the risks and by quantifying the acceptable risks.
Figure 1.4 Interrelation between the total hazard potential for an activity and the distribution of accepted risks, safety and risks due to human errors. Adapted from Schneider [14].
In Figure 1.5a and 1.5b. As a classical example of human errors consider arch bridge shown in Figure 1.5b just after completion. The intension with the bridge was that the ship traffic should pass under the bridge mid stream as indicated with buoys positioned in the river. The fact that the river is equally deep close to the banks of the river and that the captains normally sailing on the river were accustomed to sailing close to the banks rather than mid stream - in order not to worry about the ship traffic coming in the opposite direction – was either not known to the designers of the bridge or not realized as a potential hazard. The result being that the bridge after only a few months in operation was rammed by a passing ship and collapsed completely into the river as seen in Figure 1.5b.
Subsequently a new bridge was build at the same location but this time the designers had learned their lesson and decided on a suspension bridge allowing a free passage under the bridge over the full width of the river. The risk of ship collision was thus treated by a mitigation measure.
Safety through risk treatment Accepted
risks
Hazards due to human errors Objective hazard potential
Objectivly known Subjectivly realised Taken into account
Risk treatment measures Adequate measures
Correctly implemented measures
Notrealised
Neglected Notknown
Notadequate
Wrong
AkzeptiertesRisiko
Safety through risk treatment Accepted
risks
Hazards due to human errors Objective hazard potential
Objectivly known Subjectivly realised Taken into account
Risk treatment measures Adequate measures
Correctly implemented measures
Notrealised
Neglected Notknown
Notadequate
Wrong
AkzeptiertesRisiko
Hazards due to human errors Objective hazard potential
Objectivly known Subjectivly realised Taken into account
Risk treatment measures Adequate measures
Correctly implemented measures
Notrealised
Neglected Notknown
Notadequate
Wrong
AkzeptiertesRisiko
Figure 1.5a Arch bridge just after erection, Göteborg, Sweden.
Figure 1.5b Arch bridge after collision with ship.
It is always informative to consider the history, not least when risks and sources of risks are considered. In the following an overview based on Matousek and Schneider [2] and Stewart and Melchers [3] is therefore given concerning the dominating sources of risks for
• Building and bridge structures
• Dams
• Offshore structures
• Pipelines
• Nuclear power plants
• Chemical facilities
• Ships
Failures in Structures – a Detailed Survey
Based on a total of 800 reported failures and errors leading to accidents and/or damages from the area of structural engineering Matousek and Schneider [2]
have reported a detailed review of causes and how the failures and errors might have been counteracted by adequate means of risk treatment measures.
In Figure 1.6 it is illustrated when in the project the failures and errors were discovered for different types of structures.
0%
10%
20%
30%
40%
50%
60%
70%
80%
90%
100%
Highrisebuildings(362) Industrialbuildings(152)
Trafficstructures(75) Dams
(51) Rest
(52) All692
cases
Retrofit/disposal Usage
Execution
Figure 1.6 Illustration of when in the course of the projects the failures and errors were discovered, Matousek and Schneider [2].
From Figure 1.6 it is seen that in average the failures and errors were discovered equally during execution and usage of the structures. Some differences in the distribution between the different types of structures are evident. One explanation to these differences may be attributed to the interaction between man and structure during the period of operation. Clearly industrial structures suffer mostly from failures and errors during the operation, whereas dam structures with very little interaction with humans during the operation experience the largest part of failures and errors during the period of execution.
In Figure 1.7 the relative distribution of causes of the failures and errors are illustrated. It is seen that the major contributions have origin in structural failures and failures of interim structures used during the execution phases of the projects. These also are the cause of the majority of incidents leading to the loss of lives and injuries and completely dominate the damage costs.
0%
10%
20%
30%
40%
50%
60%
70%
80%
90%
100%
Structuraldamages (692)
Damagesum
Cases withinjuries(60)
Rest
Technical installations Fitting
Structure
Interrim structures Site and installation
Figure 1.7 Illustration of the relative distribution of causes of incidents, Matousek and Schneider [2].
In Figure 1.8 the primary causes of structural failures, Stewart and Melchers [3] is illustrated.
Figure 1.8 Illustration of primary causes for structural failures, Stewart and Melchers [3].
It is seen that the major contributors are poor construction procedures, inadequate connecting elements and inadequate load behaviour.
In Figure 1.9 the relative distribution of reasons for the failures and errors are illustrated.
Primary causes of structural failure
1.2 1.8
2.5 7.1
21.8 23.5
42.2 47
54.3
0 10 20 30 40 50 60
Complexity of project system Reliance on construction accuracy Errors in design calculations Unforeseeable events Contravention of instructions Unclear contract information Inadequate load behavior Inadequate connection elements Poor construction procedures
Frequency (%)
0%
10%
20%
30%
40%
50%
60%
70%
80%
90%
100%
Allcases (723)
Damagesum
Cases withinjuries(63)
Not known Accepted risk Insufficient
Neglected and wrong Wrong measures Neglected
Figure 1.9 Illustration of the relative distribution of causes for the failures and errors, Matousek and Schneider [2].
From Figure 1.9 it is seen that neglected risks and risks treated with wrong and insufficient measures dominate the picture when all incidents are considered. It should also be noted that a relatively large part of the failures and errors represent risks, which were accepted. Considering the failures and incidents leading to damage costs, loss of lives and injuries these are dominated by neglected risks and risks treated by wrong measures. In the latter cases the accepted risks contribute with a clearly smaller percentage.
In Figure 1.10 the relative distribution of where in the phases of the projects risks were not adequately treated. It is seen that most of the failures and errors take origin already in the planning and execution phases. The failures and errors with cost consequences predominantly have origin in the planning phase and the failures and errors leading to loss of lives and injuries in the execution phase.
0%
10%
20%30%
40%
50%
60%
70%
80%
90%
100%
Structuraldamages (623)
Damagecosts
Injuries(63)
Remaining and combinations Usage
Planning and execution Execution
Planning
Figure 1.10 Relative distribution of where in the phases of the projects failures and errors have origin in inadequate treatment of risks, Matousek and Schneider [2].
In Figure 1.11 a similar illustration is given based on numbers from Stewart and Melchers [3], summarising parts of a number of studies of failures and errors in structural engineering. In Figure 1.11 it is seen that the distribution found by Matousek and Schneider [2] is consistent with other studies, however, it is also seen that the distribution might deviate when specific types of structures are considered, such as bridges.
Figure 1.11 Relative distribution of failures and errors in the phases of building and bridge structures, Stewart and Melchers [3].
In Figure 1.12 the failures and errors, which have origin in inadequate treatment of risks during the planning phase are considered in more detail. There it is seen that concept and structural analyses contribute the most in general. When considering failures and errors leading to costs consequences structural analysis dominate. However, concerning failures and errors leading to loss of lives and injuries it is seen that also work preparation plays an important role.
Distribution of errors in buildings and bridges
45 53
77
64
43
12
39 49
47
22
31
32
23
40 6
25
65
21
1 1
0%
10%
20%
30%
40%
50%
60%
70%
80%
90%
100%
Matousek and Schneider (1977)/ 800
Fraczek (1979)/ 277
Walker (1980)/ 120
Logeais (1980)/
10000
Hadipriono (1985)/ 87 Buildings
Hadipriono (1985)/ 54 Bridges
Eldukair and Ayyub (1991)/ 604
Source/Number of failures surveyed
Planning and Design Construction Utilization and maintenance
0%
10%
20%
30%
40%
50%
60%
70%
80%
90%
100%
Allobserved cases(723)
Damagecosts
Cases withinjuries(63)
Combinations Work preparation Drawings, etc.
Structural analysis Concept
Figure 1.12 Illustration of the distribution of the phases during planning where risks were inadequately treated, Matousek and Schneider [2].
It is interesting to investigate how the failures and errors, which may be attributed to accepted risks and human errors contribute to the total damage sum, total number of injuries and loss of lives and the total number of failures and errors, respectively. This is illustrated in Figure 1.13.
0%
10%
20%
30%
40%
50%
60%
70%
80%
90%
100%
Informedaccepted risk
Human errors
Injuries Damage sum Number of damage cases
Figure 1.13 Illustration of the total number of injuries and loss of lives, costs consequences and total number of failures and errors attributed to accepted risks and human errors, respectively, Matousek and Schneider [2].
In Figure 1.14 the distribution of causes for the failures and errors are illustrated.
There it is seen that ignorance and insufficient knowledge are the most important contributions to failures and errors. Thereafter comes underestimation of effects, failing to remember, unright transfer of responsibility and simply not knowing.
37%
27%
4%
10%
6% 6%
Ignorance
Insufficient knowledge Underestimation of effects
Errors, forgotten Unright transfer of responsibility Did not know
Figure 1.14 Distribution of reasons why failures and errors occur, Matousek and Schneider [2].
Finally in Figure 1.15 it is illustrated whether and how the failures and errors might have been avoided. From this figure it is evident that control is one of the most important risk treatment measures, a fact, which is generally realised by most engineers, but unfortunately not fully appreciated. Often control is considered an obstruction in the routines of the daily work. However, normal care or precaution also plays an important role. It is seen that a smaller part of the failures and errors are actually unavoidable. The potential for improvements is thus large.
32%
55%
13%
Normal care Additional control Unavoidable
Figure 1.15 Illustration of the relative distribution of risk treatment measures which might have circumvented the failures and errors, Matousek and Schneider [2].
Failure in Dams
The failure mode, which has the most severe consequences for dam structures, is wall rupture, as this type of failure will release a flood wave potentially resulting
in severe damages and a large number of fatalities and/or injuries downstream of the dam structure. Failures of dams are typically the result of extreme load conditions exceeding the resistance of the dam structures. Extreme load conditions may be caused by large floods, earthquakes and failures of upstream dams. The resistance of the dam structure depends on the characteristics of the dam structure materials and the soil and rock properties. Such properties exhibit a certain inherent variability and may be influenced by external factors such as degradation processes and e.g. pore pressures.
Initiating events for dam failures have been analyzed by Blind [4] and some results are illustrated in Figure 1.16.
Initiating events for dam failure
Failure of foundation
36%
Overtopping 33%
Cracks in dams 7%
Slides (banks or dam slopes)
5%
Incorrect calculations
1%
Unknown reason 18%
Figure 1.16 Distribution of initiating event for dam structures.
It is seen that the most important initiating events may be attributed to overtopping and failure of the foundation. Overtopping typically is the result of scour of the foundation due to extreme floods or malfunction of gates.
Studies have shown that the predominant reason for dam failures are human errors as also seen from Figure 1.17 based on data from Loss and Kennett [5].
From the figure it is seen that various errors during both the construction and the operation of the dams are the predominant cause for dam failures.
Cause of dam failure
Design error 23%
Poor assumptions 12%
Poor construction 12%
Poor inspection 12%
Management/com munication
7%
Practice error 7%
Other 27%
Figure 1.17 Illustration of the distribution of causes for dam failures.
Failures in Offshore Structures
Failures of offshore installations are typically associated with either failure of the structural system or parts hereof or failures and accident in the process facilities causing loss of production, damage and/or fatalities and injuries.
In Figure 1.18a and 1.18b the distribution of initiating events causing failures for fixed and mobile offshore facilities are shown corresponding to the period of 1955-1990.
Figure 1.18a Initiating event for failures of Jack-up rigs, Bertrand and Escoffier [6].
Jack-up rigs are normally used for exploration purposes, moving from location to location, drilling and test producing. This is also evident from the types of initiating events shown in Figure 1.18 where it is seen that structural damages play an important role in the overall picture and the second most important event is blowout.
In Figure 1.19 the distribution of initiating event is shown for submersible rigs, which normally operate as production facilities.
Initiating events causing severe offshore platform accidents (Jack-up rigs)
Blowout 23%
Fire/explosion 6%
Collision 5%
Capsizing 9%
Structural damage
32%
Drifting, grounding
8%
Weather, flooding 6%
Other 11%
Initiating events causing severe offshore platform accidents (Submersible rigs)
Blowout 50%
Fire/explosion 14%
Collision 3%
Capsizing 10%
Structural damage 7%
Drifting, grounding 3%
Weather, flooding 10%
Other 3%
Figure 1.19 Distribution of initiating events for failures of submersible rigs, Bertrand and Escoffier [6].
For these rigs structural failures are far less important and here the dominating initiating event is blowout.
Figure 1.20 Distribution of initiating event for failures of semi-submersible rigs, Bertrand and Escoffier [6].
Initiating events causing severe offshore platform accidents (Semisubsermible rigs)
Blowout 28%
Fire/explosion 6%
Collision 11%
Capsizing 3%
Structural damage 13%
Drifting, grounding 20%
Weather, flooding 9%
Other 10%
Semi-submersible rigs are more exposed and vulnerable to the weather conditions, which may also be seen in Figure 1.20. For these structures weather and drifting and grounding are important initiating event together with blowout’s and collisions.
Finally in Figure 1.21 the distribution of initiating events for failures in fixed offshore installations is shown. Again it is seen that blow out’s are important but also fire and explosions contribute significantly.
Figure 1.21 Distribution of initiating events for failures of fixed rigs, Bertrand and Escoffier [6].
Failures of Pipelines
Failure of pipelines may lead to spillage of chemical combustions, which may be dangerous to the environment and the people exposed. Furthermore such event will also lead to economical consequences due to potential production losses and the costs for cleaning up the spillage. Typically pipeline failures occur due to mechanical failures, operating errors, deterioration (corrosion, fatigue, wear, etc.), natural hazards and the actions of third party.
In Figure 1.22 the distribution of initiating events for pipeline failures is illustrated based on Anderson and Misund [7].
Initiating events causing severe offshore platform accidents (Fixed platforms)
Blowout 37%
Fire/explosion 27%
Collision 9%
Capsizing 8%
Structural damage 8%
Drifting, grounding 0%
Weather, flooding 3%
Other 8%
Cause of oil pipeline failures
Corrosion 29%
Third-party damage 27%
Operational error 27%
Mechanical failure 11%
Natural hazard 6%
Figure 1.22 Distribution of initiating events for failures of pipelines, Anderson and Misund [7].
From Figure 1.22 it is seen that deterioration, operation and third party actions hold the most important contributions to failures of pipelines.
Failures in Nuclear Power Plants
For nuclear power plants failure is normally defined as a release of radioactive material beyond the boundary of the plant, typically set to 1 mile from the plant.
Such releases imply consequences to the surroundings in terms of health effects, injuries, fatalities but also consequences such as inhabitability of the effected area and significant costs. Furthermore rather intangible consequences may occur such as e.g. changes of the genetic material of humans and fauna.
Failure of nuclear power plants may occur as a result of one or more failures of the components and systems comprising the power plant. Typically failure of the power plant as defined previously requires a larger number of failure of individual components and subsystems. Thereby a certain redundancy of the systems is ensured and the power plants in general thereby become safer.
A critical component in nuclear power plants are valves, the malfunction of which may lead to a loss of core cooling, which in turn may lead to severe consequences such as core damage and even melt down.
In Figure 1.23 an overview is given showing the distribution of valve failures in various sub-systems of a boiling water nuclear power plant.
![Table 1.2 Comparative study of annual probabilities of death of different sources. Adapted from Thoft-Christensen & Baker [1].](https://thumb-eu.123doks.com/thumbv2/1library_info/3907901.1525835/21.892.124.754.344.639/table-comparative-annual-probabilities-different-sources-adapted-christensen.webp)
![Figure 1.8 Illustration of primary causes for structural failures, Stewart and Melchers [3].](https://thumb-eu.123doks.com/thumbv2/1library_info/3907901.1525835/26.892.149.604.622.874/figure-illustration-primary-causes-structural-failures-stewart-melchers.webp)
![Figure 1.9 Illustration of the relative distribution of causes for the failures and errors, Matousek and Schneider [2].](https://thumb-eu.123doks.com/thumbv2/1library_info/3907901.1525835/27.892.245.729.168.441/figure-illustration-relative-distribution-causes-failures-matousek-schneider.webp)
![Figure 1.12 Illustration of the distribution of the phases during planning where risks were inadequately treated, Matousek and Schneider [2].](https://thumb-eu.123doks.com/thumbv2/1library_info/3907901.1525835/29.892.251.706.157.418/figure-illustration-distribution-planning-inadequately-treated-matousek-schneider.webp)
![Figure 1.23 Distribution of valve failures on the various sub-systems of boiling water nuclear power plants, Scott and Gallaher [8].](https://thumb-eu.123doks.com/thumbv2/1library_info/3907901.1525835/37.892.237.656.237.631/figure-distribution-failures-various-systems-boiling-nuclear-gallaher.webp)
![Figure 1.25 Distribution of major causes of fires and explosion in the chemical industry, Spigelman [10].](https://thumb-eu.123doks.com/thumbv2/1library_info/3907901.1525835/39.892.152.621.234.522/figure-distribution-major-causes-explosion-chemical-industry-spigelman.webp)